

The DOI matches its Crossref record; 42 of the 42 references it cites were found in a registry or an index.
Membership and Behavior of Ultra-Low-Diversity Pathogen Communities Present in the Gut of Humans during Prolonged Critical Illness
Open accessAbstract
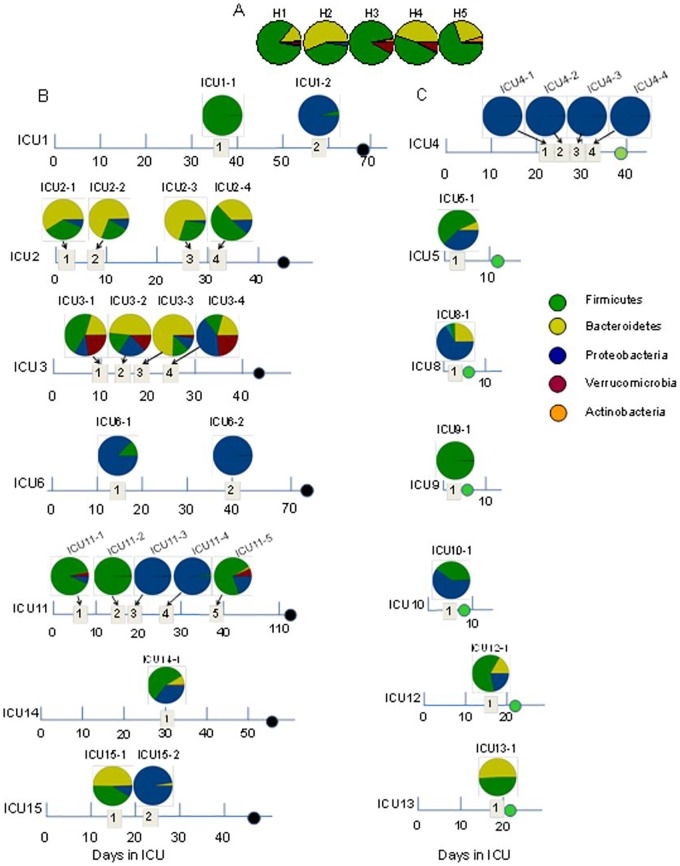
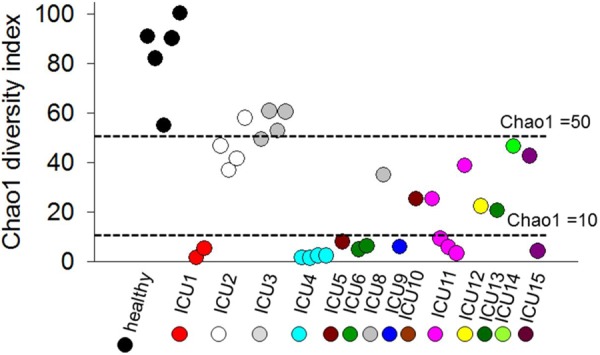
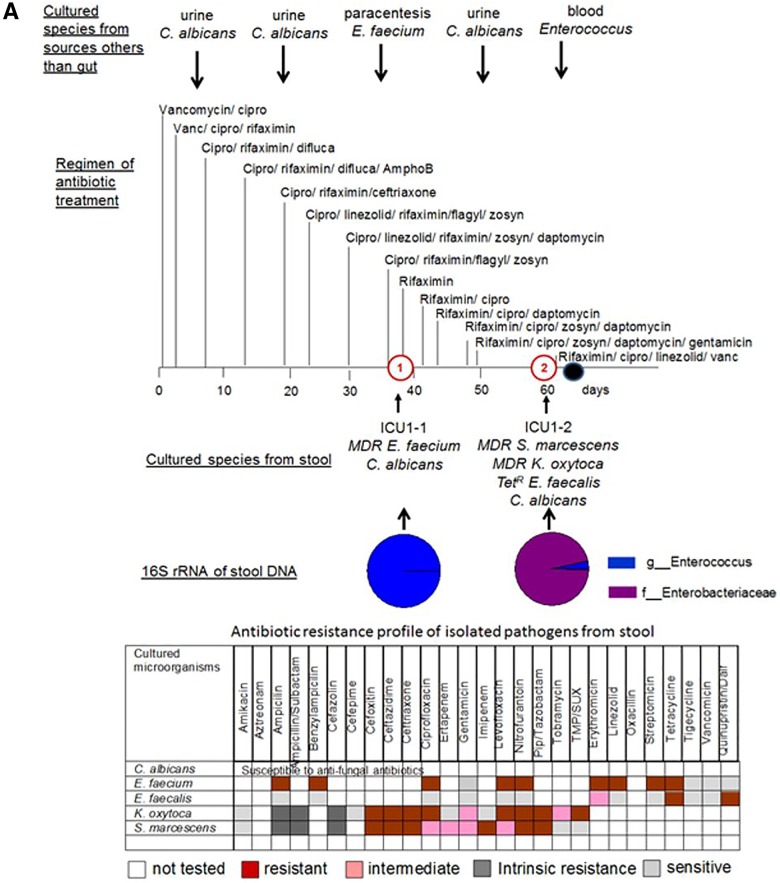
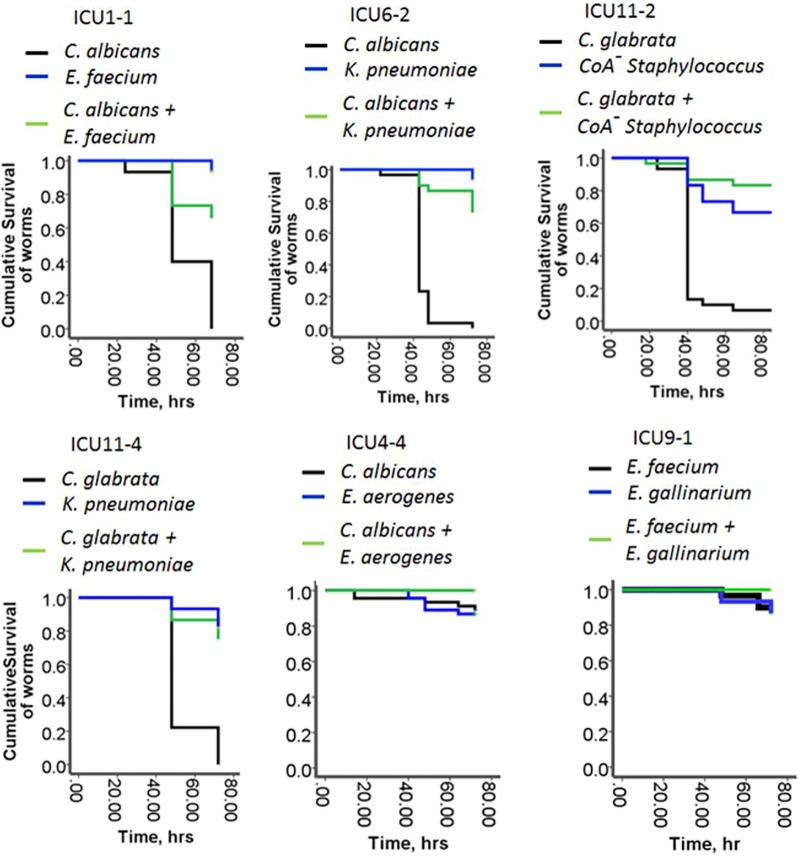
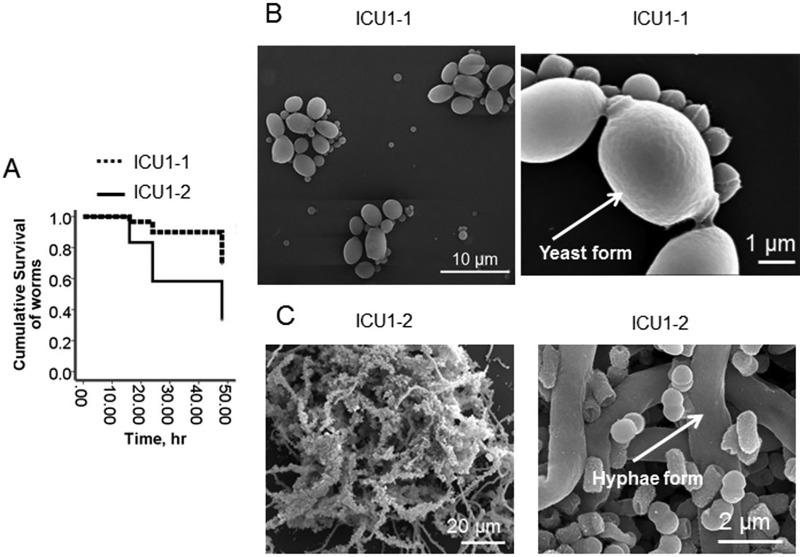
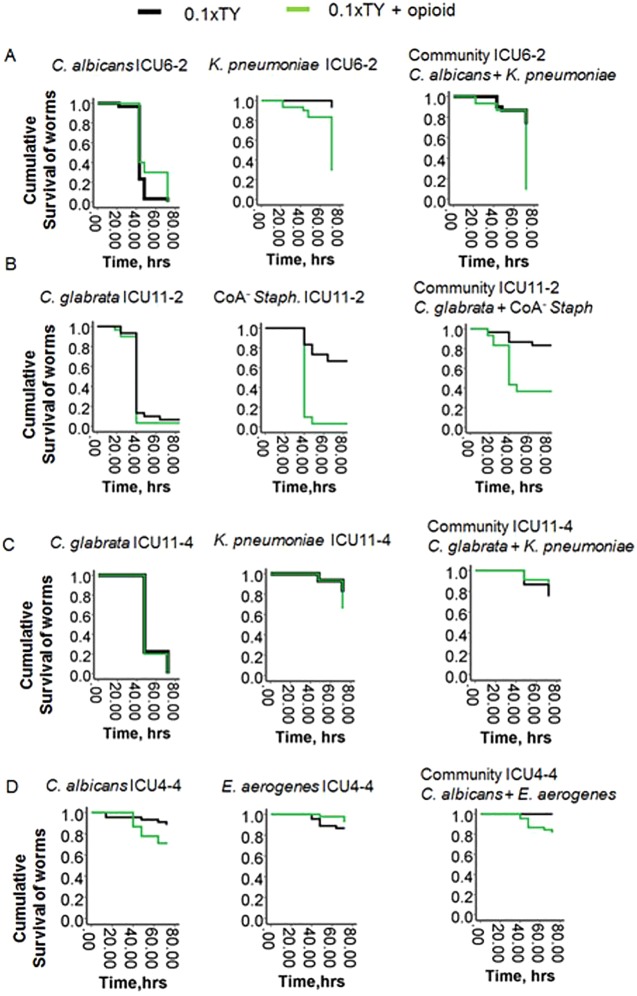
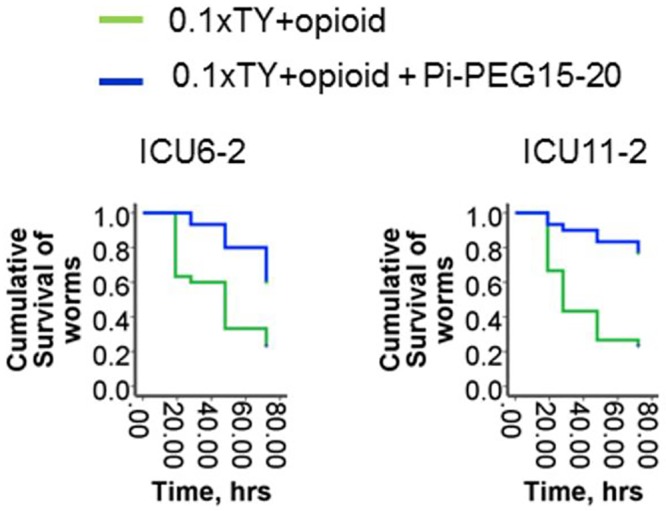
UNLABELLED: We analyzed the 16S rRNA amplicon composition in fecal samples of selected patients during their prolonged stay in an intensive care unit (ICU) and observed the emergence of ultra-low-diversity communities (1 to 4 bacterial taxa) in 30% of the patients. Bacteria associated with the genera Enterococcus and Staphylococcus and the family Enterobacteriaceae comprised the majority of these communities. The composition of cultured species from stool samples correlated to the 16S rRNA analysis and additionally revealed the emergence of Candida albicans and Candida glabrata in ~75% of cases. Four of 14 ICU patients harbored 2-member pathogen communities consisting of one Candida taxon and one bacterial taxon. Bacterial members displayed a high degree of resistance to multiple antibiotics. The virulence potential of the 2-member communities was examined in C. elegans during nutrient deprivation and exposure to opioids in order to mimic local conditions in the gut during critical illness. Under conditions of nutrient deprivation, the bacterial members attenuated the virulence of fungal members, leading to a "commensal lifestyle." However, exposure to opioids led to a breakdown in this commensalism in 2 of the ultra-low-diversity communities. Application of a novel antivirulence agent (phosphate-polyethylene glycol [Pi-PEG]) that creates local phosphate abundance prevented opioid-induced virulence among these pathogen communities, thus rescuing the commensal lifestyle. To conclude, the gut microflora in critically ill patients can consist of ultra-low-diversity communities of multidrug-resistant pathogenic microbes. Local environmental conditions in gut may direct pathogen communities to adapt to either a commensal style or a pathogenic style. IMPORTANCE: During critical illness, the normal gut microbiota becomes disrupted in response to host physiologic stress and antibiotic treatment. Here we demonstrate that the community structure of the gut microbiota during prolonged critical illness is dramatically changed such that in many cases only two-member pathogen communities remain. Most of these ultra-low-membership communities display low virulence when grouped together (i.e., a commensal lifestyle); individually, however, they can express highly harmful behaviors (i.e., a pathogenic lifestyle). The commensal lifestyle of the whole community can be shifted to a pathogenic one in response to host factors such as opioids that are released during physiologic stress and critical illness. This shift can be prevented by using compounds such as Pi-PEG15-20 that interrupt bacterial virulence expression. Taking the data together, this report characterizes the plasticity seen with respect to the choice between a commensal lifestyle and a pathogenic lifestyle among ultra-low-diversity pathogen communities that predominate in the gut during critical illness and offers novel strategies for prevention of sepsis.
Overview
The claims and statistics of this paper haven’t been checked yet.
Run the check — free, no account needed. It reads the open-access text and checks the sources it cites.
Integrity signals
Registry
Cites
Statistics
Figures
Verification
Claims the paper makes
The claims and statistics of this paper haven’t been checked yet.
Run the check — free, no account needed. It reads the open-access text and checks the sources it cites.
Claims other papers make about this one
Each is checked against this paper’s own text: does it say what the citing paper says it does?
In the citing paper
“The lower gastrointestinal tract, which in healthy people contains hundreds of distinct bacterial species, loses diversity, and the community is overrun by a few (in some cases only one) bacterial species.”
From The microbiome and critical illness (2016) · cites this paper as [20]
In the citing paper
“Dominant species include S aureus, Enterococcus spp, and members of the Enterobacteriaceae family (including E coli and Klebsiella spp).”
From The microbiome and critical illness (2016) · cites this paper as [20]
In the citing paper
“In studies of the gut microbiome in critically ill patients, butyrate-producing bacteria are uncommon or absent,20,69–71 and butyrate production is at a minimum.”
From The microbiome and critical illness (2016) · cites this paper as [20]
In the citing paper
“P aeruginosa, which is normally low in abundance, grows in prominence.”
From The microbiome and critical illness (2016) · cites this paper as [20]
In the citing paper
“normally rare fungi, such as Candida spp, bloom and thrive;20 culture-based detection of candidaemia is a marker of disease severity and predictive of a poor outcome.”
From The microbiome and critical illness (2016) · cites this paper as [20]
In the citing paper
“The virulence of pathogens familiar in intensive care is promoted by conditions of nutrient scarcity, competition from neighbouring community members, disruption of stabilising commensal relationships,20 and exposure to the mediators of the host stress response”
From The microbiome and critical illness (2016) · cites this paper as [20]
Self-check
Percentages, sums and reported differences re-computed from the paper’s own numbers.
The self-check needs the paper’s full text.
Citations
Cites
R: A Language and Environment for Statistical Computing
R Core Team (2000) · doi:10.32614/r.manuals · Cited by 355,893
QIIME allows analysis of high-throughput community sequencing data
Caporaso, J. G., Kuczynski, J., Stombaugh, J., Bittinger, K., Bushman, F. D., Costello, E. K., Fierer, N., Peña, A. G., Goodrich, J. K., Gordon, J. I., et al. (2010) · Nature Methods · doi:10.1038/nmeth.f.303 · Cited by 34,887
Search and clustering orders of magnitude faster than BLAST
Edgar, R. C. (2010) · Bioinformatics · doi:10.1093/bioinformatics/btq461 · Cited by 21,098
Naive Bayesian Classifier for Rapid Assignment of rRNA Sequences into the New Bacterial Taxonomy
Wang, Q., Garrity, G. M., Tiedje, J. M., & Cole, J. R. (2007) · Applied and Environmental Microbiology · doi:10.1128/aem.00062-07 · Cited by 20,145
Greengenes, a Chimera-Checked 16S rRNA Gene Database and Workbench Compatible with ARB
DeSantis, T. Z., Hugenholtz, P., Larsen, N., Rojas, M., Brodie, E. L., Keller, K., Huber, T., Dalevi, D., Hu, P., & Andersen, G. L. (2006) · Applied and Environmental Microbiology · doi:10.1128/aem.03006-05 · Cited by 10,891
Kindt, R., & Coe, R. L. (2006) · Cited by 1,024
Bacteria–host communication: the language of hormones
Sperandio, V., Torres, A. G., Jarvis, B., Nataro, J. P., & Kaper, J. B. (2003) · Proceedings of the National Academy of Sciences · doi:10.1073/pnas.1537100100 · Cited by 902
Human intestinal bacteria as reservoirs for antibiotic resistance genes
Salyers, A. A., GUPTA, A., & WANG, Y. (2004) · Trends in Microbiology · doi:10.1016/j.tim.2004.07.004 · Cited by 847
Lyte, M. (2013) · PLoS Pathogens · doi:10.1371/journal.ppat.1003726 · Cited by 399
Opioid receptors in the gastrointestinal tract
Holzer, P. D. (2009) · Regulatory Peptides · doi:10.1016/j.regpep.2009.03.012 · Cited by 378
Cited by
Sorted by citations
Enhancing Recovery From Sepsis: A Review
Prescott, H. C., & Angus, D. C. (2018) · JAMA · doi:10.1001/jama.2017.17687 · Cited by 1,059
Dickson, R. P., Singer, B. H., Newstead, M. W., Falkowski, N. R., Erb-Downward, J. R., Standiford, T. J., & Huffnagle, G. B. (2016) · Nature Microbiology · doi:10.1038/nmicrobiol.2016.113 · Cited by 724
The microbiome and critical illness
Dickson, R. P. (2016) · The Lancet Respiratory Medicine · doi:10.1016/s2213-2600(15)00427-0 · Cited by 460
Extreme Dysbiosis of the Microbiome in Critical Illness
McDonald, D., Ackermann, G., Khailova, L., Baird, C., Heyland, D., Kozar, R., Lemieux, M., Derenski, K., King, J., Vis-Kampen, C., et al. (2016) · mSphere · doi:10.1128/msphere.00199-16 · Cited by 426
Shogan, B. D., Belogortseva, N., Luong, P. M., Zaborin, A., Lax, S. M., Bethel, C., Ward, M. A., Muldoon, J. P., Singer, M., An, G. C., et al. (2015) · Science Translational Medicine · doi:10.1126/scitranslmed.3010658 · Cited by 402
The role of the gut microbiota in sepsis
Haak, B. W., & Wiersinga, W. J. (2017) · The Lancet. Gastroenterology & hepatology · doi:10.1016/s2468-1253(16)30119-4 · Cited by 392
The gut microbiome’s role in the development, maintenance, and outcomes of sepsis
Adelman, M. W., Woodworth, M. H., Langelier, C., Busch, L. M., Kempker, J. A., Kraft, C. S., & Martin, G. S. (2020) · Critical Care · doi:10.1186/s13054-020-02989-1 · Cited by 342
Sepsis therapies: learning from 30 years of failure of translational research to propose new leads
Cavaillon, J., Singer, M., & Skirecki, T. (2020) · EMBO Molecular Medicine · doi:10.15252/emmm.201810128 · Cited by 333
Köhler, J. R., Hube, B., Puccia, R., Casadevall, A., & Perfect, J. R. (2017) · Microbiology Spectrum · doi:10.1128/microbiolspec.funk-0014-2016 · Cited by 318
Lankelma, J. M., van Vught, L. A., Belzer, C., Schultz, M. J., van der Poll, T., de Vos, W. M., & Wiersinga, W. J. (2016) · Intensive Care Medicine · doi:10.1007/s00134-016-4613-z · Cited by 282
Surviving sepsis campaign: research priorities for sepsis and septic shock
Coopersmith, C. M., Backer, D. D., Deutschman, C. S., Ferrer, R., Lat, I., Machado, F. R., Martin, G. S., Martín‐Loeches, I., Nunnally, M., Antonelli, M. M., et al. (2018) · Intensive Care Medicine · doi:10.1007/s00134-018-5175-z · Cited by 292
Freedberg, D. E., Zhou, M. J., Cohen, M. E., Annavajhala, M. K., Khan, S. D., Moscoso, D. I., Brooks, C., Whittier, S., Chong, D. H., Uhlemann, A., et al. (2018) · Intensive Care Medicine · doi:10.1007/s00134-018-5268-8 · Cited by 247
The gut microbiota and gastrointestinal surgery
Guyton, K. L., & Alverdy, J. C. (2016) · Nature Reviews Gastroenterology & Hepatology · doi:10.1038/nrgastro.2016.139 · Cited by 230
Ojima, M., Motooka, D., Shimizu, K., Gotoh, K., Shintani, A., Yoshiya, K., Nakamura, S., Ogura, H., Iida, T., & Shimazu, T. (2015) · Digestive Diseases and Sciences · doi:10.1007/s10620-015-4011-3 · Cited by 220
Kumamoto, C. A., Gresnigt, M. S., & Hube, B. (2020) · Current Opinion in Microbiology · doi:10.1016/j.mib.2020.05.006 · Cited by 218
Wipperman, M. F., Fitzgerald, D. W., Juste, M. A. J., Taur, Y., Namasivayam, S., Sher, A., Bean, J. M., Bucci, V., & Glickman, M. S. (2017) · Scientific Reports · doi:10.1038/s41598-017-10346-6 · Cited by 213
Sepsis-Induced T Cell Immunoparalysis: The Ins and Outs of Impaired T Cell Immunity
Jensen, I. J., Sjaastad, F. V., Griffith, T. S., & Badovinac, V. P. (2018) · The Journal of Immunology · doi:10.4049/jimmunol.1701618 · Cited by 205
Maurer, M., Gresnigt, M. S., Last, A., Wollny, T., Berlinghof, F., Pospich, R., Cseresnyés, Z., Medyukhina, A., Graf, K., Gröger, M., et al. (2019) · Biomaterials · doi:10.1016/j.biomaterials.2019.119396 · Cited by 209
Understanding Long-Term Outcomes Following Sepsis: Implications and Challenges
Shankar-Hari, M., & Rubenfeld, G. D. (2016) · Current Infectious Disease Reports · doi:10.1007/s11908-016-0544-7 · Cited by 180
Impact of antimicrobial therapy on the gut microbiome
Bhalodi, A. A., van Engelen, T. S. R., Virk, H. S., & Wiersinga, W. J. (2018) · Journal of Antimicrobial Chemotherapy · doi:10.1093/jac/dky530 · Cited by 205
Collapse of the Microbiome, Emergence of the Pathobiome, and the Immunopathology of Sepsis
Alverdy, J. C., & Krezalek, M. A. (2017) · Critical Care Medicine · doi:10.1097/ccm.0000000000002172 · Cited by 185
The intestinal microenvironment in sepsis
Fay, K. T., Ford, M. L., & Coopersmith, C. M. (2017) · Biochimica et Biophysica Acta (BBA) - Molecular Basis of Disease · doi:10.1016/j.bbadis.2017.03.005 · Cited by 196
Hospitalization type and subsequent severe sepsis
Prescott, H. C., Dickson, R. P., Rogers, M. A. M., Langa, K. M., & Iwashyna, T. J. (2015) · American Journal of Respiratory and Critical Care Medicine · doi:10.1164/rccm.201503-0483oc · Cited by 181
Antimicrobial-associated harm in critical care: a narrative review
Arulkumaran, N., Routledge, M., Schlebusch, S., Lipman, J., & Conway Morris, A. (2020) · Intensive Care Medicine · doi:10.1007/s00134-020-05929-3 · Cited by 175
Krezalek, M. A., DeFazio, J. R., Zaborina, O. Y., Zaborin, A., & Alverdy, J. C. (2015) · Shock · doi:10.1097/shk.0000000000000534 · Cited by 174
Microbiota-Immune Interaction in the Pathogenesis of Gut-Derived Infection
Wang, C., Li, Q., & Ren, J. (2019) · Frontiers in Immunology · doi:10.3389/fimmu.2019.01873 · Cited by 172
Agudelo-Ochoa, G. M., Valdés-Duque, B. E., Giraldo-Giraldo, N. A., Jaillier-Ramírez, A. M., Giraldo-Villa, A., Acevedo-Castaño, I., Yepes-Molina, M. A., Barbosa-Barbosa, J., & Benítez-Paéz, A. (2020) · Gut Microbes · doi:10.1080/19490976.2019.1707610 · Cited by 166
Gut integrity in critical illness
Otani, S., & Coopersmith, C. M. (2019) · Journal of Intensive Care · doi:10.1186/s40560-019-0372-6 · Cited by 165
Sepsis Subclasses: A Framework for Development and Interpretation*
DeMerle, K. M., Angus, D. C., Baillie, J. K., Brant, E. B., Calfee, C. S., Carcillo, J. A., Chang, C. H., Dickson, R. P., Evans, I. V. R., Gordon, A. C., et al. (2021) · Critical Care Medicine · doi:10.1097/ccm.0000000000004842 · Cited by 163
Role of the microbiome, probiotics, and ‘dysbiosis therapy’ in critical illness
Wischmeyer, P. E., McDonald, D. T., & Knight, R. D. (2016) · Current Opinion in Critical Care · doi:10.1097/mcc.0000000000000321 · Cited by 167
Therapeutic Potential of the Gut Microbiota in the Prevention and Treatment of Sepsis
Haak, B. W., Prescott, H. C., & Wiersinga, W. J. (2018) · Frontiers in Immunology · doi:10.3389/fimmu.2018.02042 · Cited by 163
Kim, S. M., DeFazio, J. R., Hyoju, S. K., Sangani, K. A., Keskey, R. C., Krezalek, M. A., Khodarev, N. N., Sangwan, N., Christley, S., Harris, K. G., et al. (2020) · Nature Communications · doi:10.1038/s41467-020-15545-w · Cited by 144
Disruption of the microbiota across multiple body sites in critically ill children
Rogers, M. B., Firek, B., Shi, M., Yeh, A., Brower–Sinning, R., Aveson, V. G., Kohl, B. L., Fabio, A., Carcillo, J. A., & Morowitz, M. J. (2016) · Microbiome · doi:10.1186/s40168-016-0211-0 · Cited by 127
van den Berg, F. F., van Dalen, D., Hyoju, S. K., van Santvoort, H. C., Besselink, M. G., Wiersinga, W. J., Zaborina, O. Y., Boermeester, M. A., & Alverdy, J. C. (2020) · Gut · doi:10.1136/gutjnl-2019-320430 · Cited by 131
Plasmid Dynamics in KPC-Positive Klebsiella pneumoniae during Long-Term Patient Colonization
Conlan, S., Park, M., Deming, C., Thomas, P. J., Young, A., Coleman, H., Sison, C., Program, N. C. S., Weingarten, R. A., Lau, A. F., et al. (2016) · mBio · doi:10.1128/mbio.00742-16 · Cited by 127
Buelow, E., Gonzalez, T. D. J. B., Fuentes, S., Piters, W. A. A. D. S., Lahti, L., Bayjanov, J. R., Majoor, E. A. M., Braat, J. C., van Mourik, M. S. M., Oostdijk, E. A. N., et al. (2017) · Microbiome · doi:10.1186/s40168-017-0309-z · Cited by 130
Loss of microbial diversity and pathogen domination of the gut microbiota in critically ill patients
Ravi, A., Halstead, F. D., Bamford, A. L., Casey, A., Thomson, N. M., van Schaik, W., Snelson, C., Goulden, R., Foster-Nyarko, E., Savva, G. M., et al. (2019) · Microbial Genomics · doi:10.1099/mgen.0.000293 · Cited by 128
Dysbiosis of the intestinal microbiota in neurocritically ill patients and the risk for death
Xu, R., Tan, C., Zhu, J., Zeng, X., Gao, X., Wu, Q., Chen, Q., Wang, H., Zhou, H., He, Y., et al. (2019) · Critical Care · doi:10.1186/s13054-019-2488-4 · Cited by 123
Fungal Endocarditis: Pathophysiology, Epidemiology, Clinical Presentation, Diagnosis, and Management
Thompson, G. R., Jenks, J. D., Baddley, J. W., Lewis, J. S., Egger, M., Schwartz, I. S., Boyer, J., Patterson, T. F., Chen, S. C. ‐., Pappas, P. G., et al. (2023) · Clinical Microbiology Reviews · doi:10.1128/cmr.00019-23 · Cited by 132
Surviving Sepsis Campaign: Research Priorities for Sepsis and Septic Shock
Coopersmith, C. M., Backer, D. D., Deutschman, C. S., Ferrer, R., Lat, I., Machado, F. R., Martin, G. S., Martín‐Loeches, I., Nunnally, M., Antonelli, M. M., et al. (2018) · Critical Care Medicine · doi:10.1097/ccm.0000000000003225 · Cited by 117
What Is a Host? Incorporating the Microbiota into the Damage-Response Framework
Casadevall, A., & Pirofski, L. (2014) · Infection and Immunity · doi:10.1128/iai.02627-14 · Cited by 115
Characterization of oral and gut microbiome temporal variability in hospitalized cancer patients
Galloway-Peña, J., Smith, D. P., Sahasrabhojane, P. V., Wadsworth, W. D., Fellman, B. M., Ajami, N. J., Shpall, E. J., Daver, N. G., Guindani, M., Petrosino, J. F., et al. (2017) · Genome Medicine · doi:10.1186/s13073-017-0409-1 · Cited by 118
Zhu, C. S., Grandhi, R., Patterson, T. F., & Nicholson, S. E. (2018) · Brain Sciences · doi:10.3390/brainsci8060113 · Cited by 112
Gut-derived immune cells and the gut-lung axis in ARDS
Ziaka, M., & Exadaktylos, A. K. (2024) · Critical Care · doi:10.1186/s13054-024-05006-x · Cited by 118
Enteric dysbiosis is associated with sepsis in patients
Liu, Z., Li, N., Fang, H., Chen, X., Guo, Y., Gong, S., Niu, M., Zhou, H., Jiang, Y., Chang, P., et al. (2019) · The FASEB Journal · doi:10.1096/fj.201900398rr · Cited by 107
Pettigrew, M. M., Gent, J. F., Kong, Y., Halpin, A. L., Pineles, L. L., Harris, A. D., & Johnson, J. K. (2018) · Clinical Infectious Diseases · doi:10.1093/cid/ciy936 · Cited by 106
The microbiota in pneumonia: From protection to predisposition
Thibeault, C., Suttorp, N., & Opitz, B. (2021) · Science Translational Medicine · doi:10.1126/scitranslmed.aba0501 · Cited by 111
Dickstein, Y., Edelman, R., Dror, T. W., Hussein, K., Bar‐Lavie, Y., & Paul, M. (2016) · Journal of Hospital Infection · doi:10.1016/j.jhin.2016.05.018 · Cited by 103
Sepsis and the Microbiome: A Vicious Cycle
Miller, W. D., Keskey, R. C., & Alverdy, J. C. (2020) · The Journal of Infectious Diseases · doi:10.1093/infdis/jiaa682 · Cited by 106
The central and biodynamic role of gut microbiota in critically ill patients
Wozniak, H., Beckmann, T. S., Fröhlich, L., Soccorsi, T., Terrier, C. L., de Watteville, A., Schrenzel, J., & Heidegger, C. (2022) · Critical Care · doi:10.1186/s13054-022-04127-5 · Cited by 102
Microbial dysbiosis and mortality during mechanical ventilation: a prospective observational study
for the PROSPECT Investigators, Lamarche, D., Canadian Critical Care Trials Group, Canadian Critical Care Translational Biology Group, Johnstone, J., Zytaruk, N. L., Clarke, F. J., Hand, L. E., Loukov, D., Szamosi, J. C., et al. (2018) · Respiratory Research · doi:10.1186/s12931-018-0950-5 · Cited by 100
“ Candida Albicans Interactions With The Host: Crossing The Intestinal Epithelial Barrier”
Basmaciyan, L., Bon, F., Paradis, T., Lapaquette, P., & Dalle, F. (2019) · Tissue Barriers · doi:10.1080/21688370.2019.1612661 · Cited by 89
Harris, A. D., Jackson, S. S., Robinson, G. L., Pineles, L. L., Leekha, S., Thom, K. A., Wang, Y., Doll, M. E., Pettigrew, M. M., & Johnson, J. K. (2016) · Infection Control and Hospital Epidemiology · doi:10.1017/ice.2015.346 · Cited by 87
Gut microbiome, surgical complications and probiotics
Stavrou, G. (2016) · Annals of Gastroenterology · doi:10.20524/aog.2016.0086 · Cited by 93
The Importance of the Microbiome in Critically Ill Patients: Role of Nutrition
Morón, R., Gálvez, J., Colmenero, M., Anderson, P. O., Barrera, J. C., & Rodríguez‐Cabezas, M. E. (2019) · Nutrients · doi:10.3390/nu11123002 · Cited by 85
Can the Cecal Ligation and Puncture Model Be Repurposed To Better Inform Therapy in Human Sepsis?
Alverdy, J. C., Keskey, R. C., & Thewissen, R. (2020) · Infection and Immunity · doi:10.1128/iai.00942-19 · Cited by 81
Hyoju, S. K., Klabbers, R. E., Arron, M. N. N., Krezalek, M. A., Zaborin, A., Wiegerinck, M., Hyman, N., Zaborina, O. Y., Goor, H. V., & Alverdy, J. C. (2017) · Annals of Surgery · doi:10.1097/sla.0000000000002167 · Cited by 81
The role of the microbiota in the management of intensive care patients
Szychowiak, P., Villageois-Tran, K., Patrier, J., Timsit, J., & Ruppé, É. (2022) · Annals of Intensive Care · doi:10.1186/s13613-021-00976-5 · Cited by 86
Commensalism and pathogenesis of Candida albicans at the mucosal interface
Schille, T. B., Sprague, J. L., Naglik, J. R., Brunke, S., & Hube, B. (2025) · Nature Reviews Microbiology · doi:10.1038/s41579-025-01174-x · Cited by 83
Haak, B. W., Argelaguet, R., Kinsella, C. M., Kullberg, R. F. J., Lankelma, J. M., Deijs, M., Klein, M., Jebbink, M. F., Hugenholtz, F., Kostidis, S., et al. (2021) · mSystems · doi:10.1128/msystems.01148-20 · Cited by 75
Candida albicans colonization of the gastrointestinal tract: A double-edged sword
Alonso‐Monge, R., Gresnigt, M. S., Román, E., Hube, B., & Plá, J. (2021) · PLoS Pathogens · doi:10.1371/journal.ppat.1009710 · Cited by 77
Sekyere, J. O., Maningi, N. E., & Fourie, P. B. (2020) · Annals of the New York Academy of Sciences · doi:10.1111/nyas.14300 · Cited by 74
The central role of the gut in intensive care
Corriero, A., Gadaleta, R. M., Puntillo, F., Inchingolo, F., Moschetta, A., & Brienza, N. (2022) · Critical Care · doi:10.1186/s13054-022-04259-8 · Cited by 78
Readmissions for Recurrent Sepsis: New or Relapsed Infection?*
DeMerle, K. M., Royer, S., Mikkelsen, M. E., & Prescott, H. C. (2017) · Critical Care Medicine · doi:10.1097/ccm.0000000000002626 · Cited by 72
Improving Long-Term Outcomes After Sepsis
Prescott, H. C., & Costa, D. K. (2017) · Critical Care Clinics · doi:10.1016/j.ccc.2017.08.013 · Cited by 75
Livanos, A. E., Snider, E. J., Whittier, S., Chong, D. H., Wang, T. C., Abrams, J. A., & Freedberg, D. E. (2018) · PLoS ONE · doi:10.1371/journal.pone.0200322 · Cited by 71
Enemies and brothers in arms:Candida albicansand gram-positive bacteria
Förster, T. M., Mogavero, S., Dräger, A., Graf, K., Polke, M., Jacobsen, I. D., & Hube, B. (2016) · Cellular Microbiology · doi:10.1111/cmi.12657 · Cited by 67
Afshinnekoo, E., Chou, C., Alexander, N., Ahsanuddin, S., Schuetz, A. N., & Mason, C. E. (2017) · Journal of Biomolecular Techniques JBT · doi:10.7171/jbt.17-2801-007 · Cited by 65
Skonieczna‐Żydecka, K., Kaczmarczyk, M., Łoniewski, I., Lara, L. F., Koulaouzidis, A., Misera, A., Maciejewska, D., & Marlicz, W. M. (2018) · Journal of Clinical Medicine · doi:10.3390/jcm7120556 · Cited by 66
The microbiome of the critically ill patient
Akrami, K., & Sweeney, D. A. (2017) · Current Opinion in Critical Care · doi:10.1097/mcc.0000000000000469 · Cited by 69
The 2016 ESPEN Arvid Wretlind lecture: The gut in stress
McClave, S. A., Lowen, C. C., & Martindale, R. G. (2018) · Clinical Nutrition · doi:10.1016/j.clnu.2017.07.015 · Cited by 63
Aardema, H., Lisotto, P., Kurilshikov, A., Diepeveen, J. R. J., Friedrich, A. W., Sinha, B. N. M., de Smet, A. M. G. A., & Harmsen, H. J. M. (2020) · Frontiers in Cellular and Infection Microbiology · doi:10.3389/fcimb.2019.00467 · Cited by 63
Ojima, M., Shimizu, K., Motooka, D., Ishihara, T., Nakamura, S., Shintani, A., Ogura, H., Iida, T., Yoshiya, K., & Shimazu, T. (2021) · Digestive Diseases and Sciences · doi:10.1007/s10620-021-07000-7 · Cited by 65
Faleck, D. M., Salmasian, H., Furuya, Y. E., Larson, E., Abrams, J. A., & Freedberg, D. E. (2016) · The American Journal of Gastroenterology · doi:10.1038/ajg.2016.343 · Cited by 64
The implication of gut microbiota in recovery from gastrointestinal surgery
Zheng, Z., Hu, Y., Tang, J., Xu, W., Zhu, W., & Zhang, W. (2023) · Frontiers in Cellular and Infection Microbiology · doi:10.3389/fcimb.2023.1110787 · Cited by 68
The emerging role of the microbiota in the ICU
Wolff, N. S., Hugenholtz, F., & Wiersinga, W. J. (2018) · Critical Care · doi:10.1186/s13054-018-1999-8 · Cited by 63
Microbiota-targeted therapies on the intensive care unit
Haak, B. W., Levi, M. M., & Wiersinga, W. J. (2017) · Current Opinion in Critical Care · doi:10.1097/mcc.0000000000000389 · Cited by 60
Fu, Y., Moscoso, D. I., Porter, J., Krishnareddy, S., Abrams, J. A., Seres, D. S., Chong, D. H., & Freedberg, D. E. (2019) · Journal of Parenteral and Enteral Nutrition · doi:10.1002/jpen.1682 · Cited by 59
Shakhsheer, B. A., Versten, L. A., Luo, J. N., DeFazio, J. R., Klabbers, R. E., Christley, S., Zaborin, A., Guyton, K. L., Krezalek, M. A., Smith, D. P., et al. (2016) · Journal of Gastrointestinal Surgery · doi:10.1007/s11605-016-3237-5 · Cited by 57
Gut microbiota and host defense in critical illness
Jacobs, M. C., Haak, B. W., Hugenholtz, F., & Wiersinga, W. J. (2017) · Current Opinion in Critical Care · doi:10.1097/mcc.0000000000000424 · Cited by 60
Schmitt, F. C. F., Brenner, T., Uhle, F., Loesch, S., Hackert, T., Ulrich, A. B., Hofer, S., Dalpke, A. H., Weigand, M. A., & Boutin, S. (2019) · BMC Microbiology · doi:10.1186/s12866-019-1399-5 · Cited by 56
The human microbiota: novel targets for hospital-acquired infections and antibiotic resistance
Pettigrew, M. M., Johnson, J. K., & Harris, A. D. (2016) · Annals of Epidemiology · doi:10.1016/j.annepidem.2016.02.007 · Cited by 55
Seelbinder, B., Lohinai, Z., Vazquez-Uribe, R., Brunke, S., Chen, X., Mirhakkak, M. H., Lopez-Escalera, S., Döme, B., Megyesfalvi, Z., Berta, J., et al. (2023) · Nature Communications · doi:10.1038/s41467-023-38058-8 · Cited by 54
The Gut Microbiome in Sepsis: From Dysbiosis to Personalized Therapy
Piccioni, A., Spagnuolo, F., Candelli, M., Voza, A., Covino, M., Gasbarrini, A., & Franceschi, F. (2024) · Journal of Clinical Medicine · doi:10.3390/jcm13206082 · Cited by 56
Wurm, P., Spindelboeck, W., Krause, R., Plank, J., Fuchs, G., Bashir, M., Petritsch, W., Halwachs, B., Langner, C., Högenauer, C., et al. (2017) · Critical Care Medicine · doi:10.1097/ccm.0000000000002310 · Cited by 53
Mu, S., Xiang, H., Wang, Y., Wei, W., Long, X., Han, Y., Kuang, Z., Yang, Y., Xu, F., Xue, M., et al. (2022) · Critical Care · doi:10.1186/s13054-022-03943-z · Cited by 57
Pathogenesis and therapeutic opportunities of gut microbiome dysbiosis in critical illness
Cho, N. A., Strayer, K., Dobson, B., & McDonald, B. (2024) · Gut Microbes · doi:10.1080/19490976.2024.2351478 · Cited by 60
Patel, J. J., Rosenthal, M. D., Miller, K. R., & Martindale, R. G. (2016) · Current Opinion in Critical Care · doi:10.1097/mcc.0000000000000331 · Cited by 52
Streptococcus thermophilus Attenuates Inflammation in Septic Mice Mediated by Gut Microbiota
Han, F., Wu, G., Zhang, Y., Zheng, H., Han, S., Li, X., Cai, W., Liu, J., Zhang, W., Zhang, X., et al. (2020) · Frontiers in Microbiology · doi:10.3389/fmicb.2020.598010 · Cited by 50
The gut microbiota as a modulator of innate immunity during melioidosis
Lankelma, J. M., Birnie, E., Weehuizen, T. A. F., Scicluna, B. P., Belzer, C., Houtkooper, R. H., Roelofs, J. J. T. H., de Vos, A. F., van der Poll, T., Budding, A. E., et al. (2017) · PLoS neglected tropical diseases · doi:10.1371/journal.pntd.0005548 · Cited by 50
The use of fecal microbiota transplant in sepsis
Keskey, R. C., Cone, J., DeFazio, J. R., & Alverdy, J. C. (2020) · Translational research · doi:10.1016/j.trsl.2020.07.002 · Cited by 52
Enterobactin inhibits microbiota-dependent activation of AhR to promote bacterial sepsis in mice
Keskey, R. C., Xiao, J. F., Hyoju, S. K., Lam, A., Kim, D., Sidebottom, A. M., Zaborin, A., Dijkstra, A., Meltzer, R. S., Thakur, A., et al. (2025) · Nature Microbiology · doi:10.1038/s41564-024-01882-9 · Cited by 53
The microbiome and nutrition in critical illness
Oami, T., Chihade, D. B., & Coopersmith, C. M. (2019) · Current Opinion in Critical Care · doi:10.1097/mcc.0000000000000582 · Cited by 51
Hyoju, S. K., Zaborin, A., Keskey, R. C., Sharma, A., Arnold, W., van den Berg, F. F., Kim, S. M., Gottel, N., Bethel, C., Charnot‐Katsikas, A., et al. (2019) · mBio · doi:10.1128/mbio.00903-19 · Cited by 51
Prével, R., Enaud, R., Orieux, A., Camino, A., Berger, P., Boyer, A., Delhaès, L., & Gruson, D. (2022) · Critical Care · doi:10.1186/s13054-022-03980-8 · Cited by 49
The interplay between microbiota and inflammation: lessons from peritonitis and sepsis
Lobo, L. A., Benjamim, C. F., & Oliveira, A. C. (2016) · Clinical & Translational Immunology · doi:10.1038/cti.2016.32 · Cited by 52
Our interface with the built environment: immunity and the indoor microbiota
Lax, S. M., Nagler‐Anderson, C., & Gilbert, J. A. (2015) · Trends in Immunology · doi:10.1016/j.it.2015.01.001 · Cited by 48
Scheich, S., Lindner, S., Koenig, R., Reinheimer, C., Wichelhaus, T. A., Hogardt, M., Besier, S. M., Kempf, V. A. J., Kessel, J. M., Martin, H., et al. (2017) · Cancer · doi:10.1002/cncr.31045 · Cited by 47
Wang, W., Hao, G., Pan, Y., Ma, S., Yang, T., Shi, P., Zhu, Q., Xie, Y., Ma, S., Zhang, Q., et al. (2019) · BMC Nephrology · doi:10.1186/s12882-019-1238-9 · Cited by 48
Metadata
- Authors
- Zaborin, A., Smith, D., Garfield, K., Quensen, J., Shakhsheer, B., Kade, M., Tirrell, M., Tiedje, J., Gilbert, J. A., Zaborina, O., & Alverdy, J. C.
- Affiliations
- University of Chicago (US)
- Argonne National Laboratory (US)
- Michigan State University (US)
- Corresponding author
- Zaborina, Olga
- Alverdy, John C.
- ORCID
- Venue
- mBio
- Publisher
- American Society for Microbiology
- Published
- 2014-10-31
- Volume
- 5
- Issue
- 5
- Pages
- e01361-14
- ISSN
- 2150-7511 (ISSN-L)
- 2161-2129
- PMC
- PMC4173762
- OpenAlex
- W2112208246
- Cited by
- 367
- References
- 42
- Citations by year
- 2026: 32 · 2025: 31 · 2024: 19 · 2023: 36 · 2022: 40 · 2021: 30 · 2020: 39 · 2019: 31 · 2018: 34 · 2017: 34 · 2016: 28 · 2015: 12 · 2014: 1
- FWCI
- 10.19
- Type
- journal article
- Language
- en
- Open access
- gold
- doi.org
- Licence
- Locations
- mBio (publishedVersion, cc-by-nc-sa)
- Europe PMC (PubMed Central) (publishedVersion, cc-by-nc-sa)
- PubMed Central (publishedVersion, cc-by-nc-sa)
- PubMed (publishedVersion)
- DOAJ (DOAJ: Directory of Open Access Journals) (submittedVersion, cc-by-sa)
- eScholarship (California Digital Library) (submittedVersion)
- eScholarship (California Digital Library) (submittedVersion, cc-by-nc-sa)
- OSTI OAI (U.S. Department of Energy Office of Scientific and Technical Information) (submittedVersion)
- Funders
- National Institutes of Health (UL1TR000430)
- National Institute of General Medical Sciences (R01 2R01GM062344-13A1, R01GM062344)
- National Center for Advancing Translational Sciences
- Topics
- Life Sciences › Biochemistry, Genetics and Molecular Biology › Molecular Biology › Gut microbiota and health
- Health Sciences › Medicine › Infectious Diseases › Clostridium difficile and Clostridium perfringens research
- Health Sciences › Medicine › Microbiology (medical) › Antibiotic Resistance in Bacteria
- Keywords
- gut microbiota, critical illness, intensive care unit patients, multidrug resistance, Enterococcus, Staphylococcus, Enterobacteriaceae, Candida albicans, Candida glabrata, commensalism, fungal-bacterial interactions, anti-virulence agents, nutrient deprivation
- MeSH terms
- Animals, Anti-Bacterial Agents, Candida albicans, Enterobacteriaceae, Feces, Humans, Intensive Care Units, RNA, Ribosomal, 16S, Staphylococcus, Critical Illness, Enterococcus, Caenorhabditis elegans, Sepsis, Gene Expression Profiling, Drug Resistance, Bacterial, Drug Resistance, Fungal, Virulence Factors, Gastrointestinal Tract, Microbiota
About these checks
Registry, retraction, Cites and statistics results are computed, not judged, with one exception: a printed reference that no index lists is read once by a model before it counts as a citation error. Claims are extracted by a model and kept only when their quote appears verbatim in the text; each cited source is then checked, with a model’s help, for whether it says what the claim relies on. Those verdicts can be wrong — read the claim’s quote and the cited source before relying on one.
Statistics and arithmetic are recomputed, not judged.
Confidence bands are shown only for fields calibrated on our annotated test set. None is calibrated yet, so no band is shown.
What counts as a claim ›How we measure confidence ›How we check this ›
Are you an author, or do you see a problem with this page? Request a review
