

The DOI matches its Crossref record; 30 of the 30 references it cites were found in a registry or an index.
Image-based consensus molecular subtype (imCMS) classification of colorectal cancer using deep learning
Open accessPublished version of a preprint
Abstract
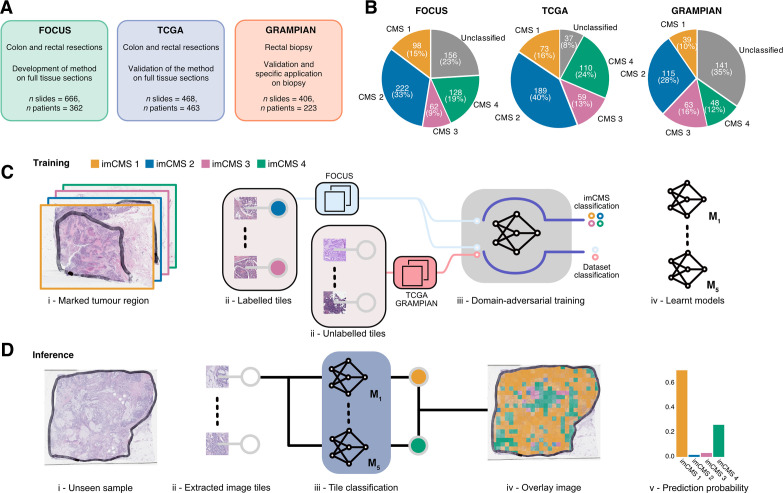
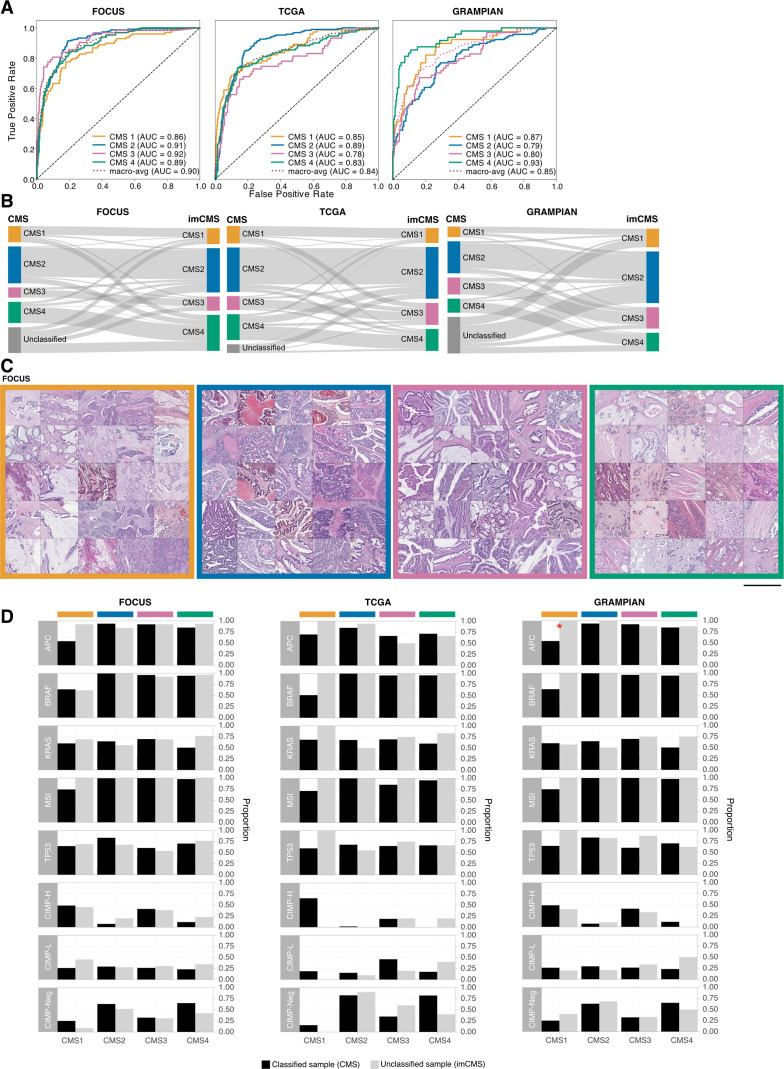
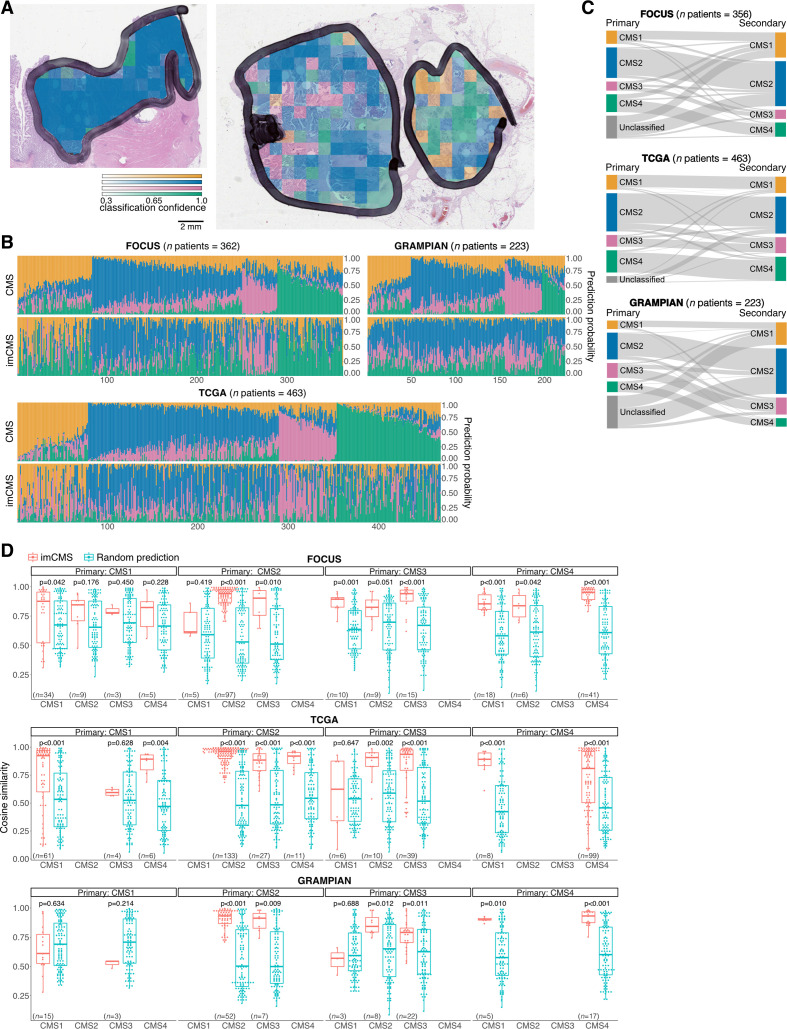
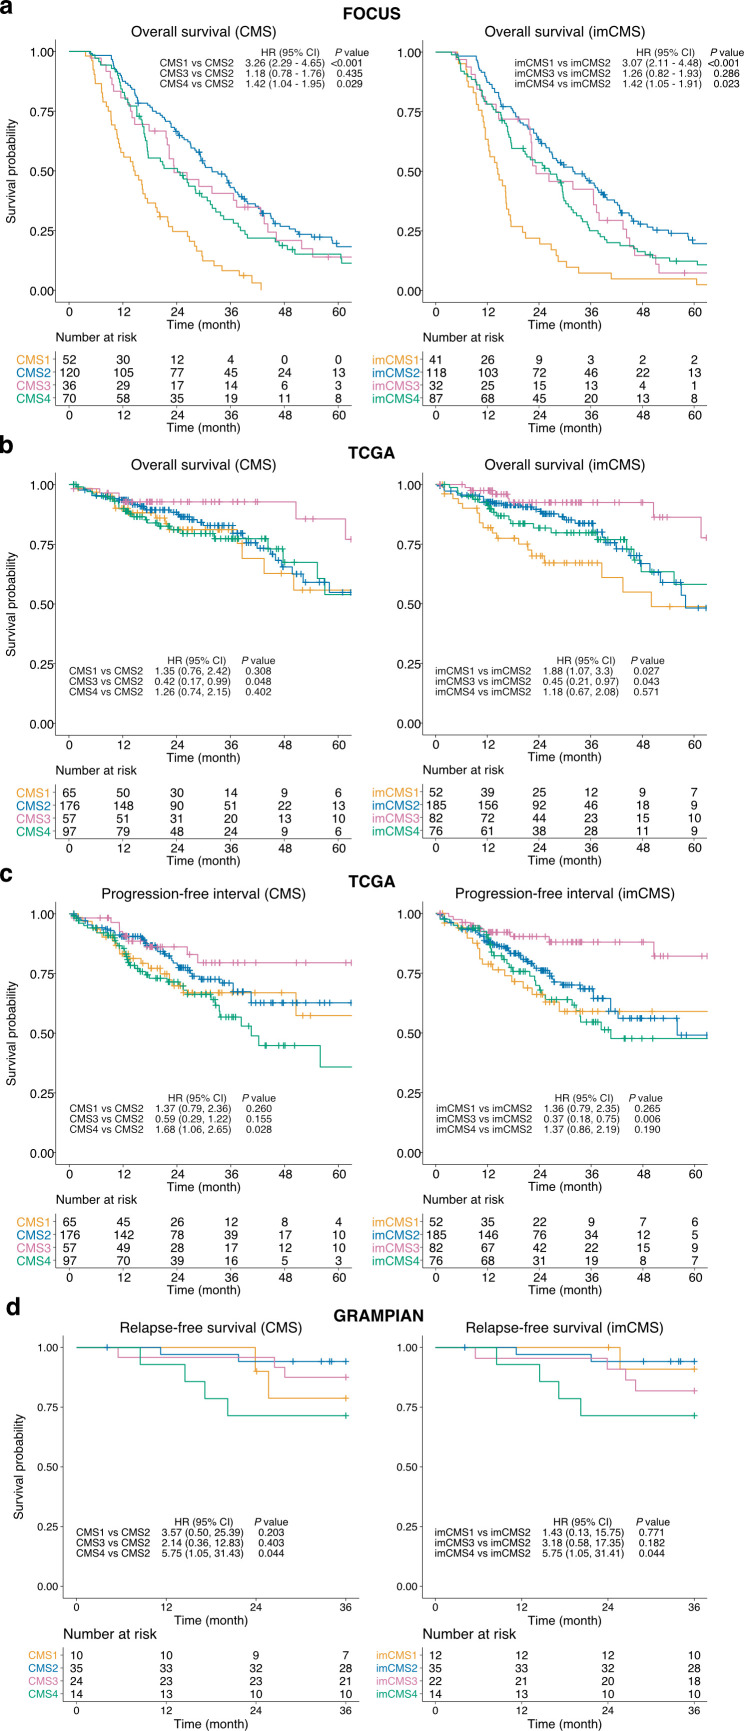
Objective: Complex phenotypes captured on histological slides represent the biological processes at play in individual cancers, but the link to underlying molecular classification has not been clarified or systematised. In colorectal cancer (CRC), histological grading is a poor predictor of disease progression, and consensus molecular subtypes (CMSs) cannot be distinguished without gene expression profiling. We hypothesise that image analysis is a cost-effective tool to associate complex features of tissue organisation with molecular and outcome data and to resolve unclassifiable or heterogeneous cases. In this study, we present an image-based approach to predict CRC CMS from standard H&E sections using deep learning. Design: Training and evaluation of a neural network were performed using a total of n=1206 tissue sections with comprehensive multi-omic data from three independent datasets (training on FOCUS trial, n=278 patients; test on rectal cancer biopsies, GRAMPIAN cohort, n=144 patients; and The Cancer Genome Atlas (TCGA), n=430 patients). Ground truth CMS calls were ascertained by matching random forest and single sample predictions from CMS classifier. Results: Image-based CMS (imCMS) accurately classified slides in unseen datasets from TCGA (n=431 slides, AUC)=0.84) and rectal cancer biopsies (n=265 slides, AUC=0.85). imCMS spatially resolved intratumoural heterogeneity and provided secondary calls correlating with bioinformatic prediction from molecular data. imCMS classified samples previously unclassifiable by RNA expression profiling, reproduced the expected correlations with genomic and epigenetic alterations and showed similar prognostic associations as transcriptomic CMS. Conclusion: This study shows that a prediction of RNA expression classifiers can be made from H&E images, opening the door to simple, cheap and reliable biological stratification within routine workflows.
Overview
The claims and statistics of this paper haven’t been checked yet.
Run the check — free, no account needed. It reads the open-access text and checks the sources it cites.
Integrity signals
Registry
Cites
Statistics
Figures
Verification
Claims the paper makes
The claims and statistics of this paper haven’t been checked yet.
Run the check — free, no account needed. It reads the open-access text and checks the sources it cites.
Claims other papers make about this one
Each is checked against this paper’s own text: does it say what the citing paper says it does?
In the citing paper
“A second outstanding and undisputed hallmark of CMS4 tumors is their stromal enrichment, which emerged both from transcriptomic signature (2) and histologic analyses (29).”
From Clinical Challenges of Consensus Molecular Subtype CMS4 Colon Cancer in the Era of Precision Medicine (2024) · cites this paper as [29]
In the citing paper
“several studies have documented an association between the CMS4 subtype and tumor budding, defined as a single tumor cell or tumor cluster of up to four cells at the invasive margin (29–31)”
From Clinical Challenges of Consensus Molecular Subtype CMS4 Colon Cancer in the Era of Precision Medicine (2024) · cites this paper as [29]
In the citing paper
“artificial intelligence is now opening up new avenues for colorectal cancer classification, with a high degree of robustness (29).”
From Clinical Challenges of Consensus Molecular Subtype CMS4 Colon Cancer in the Era of Precision Medicine (2024) · cites this paper as [29]
Self-check
Percentages, sums and reported differences re-computed from the paper’s own numbers.
The self-check needs the paper’s full text.
Citations
Cites
Rethinking the Inception Architecture for Computer Vision
Szegedy, C., Vanhoucke, V., Ioffe, S., Shlens, J., & Wojna, Z. (2016) · 2016 IEEE Conference on Computer Vision and Pattern Recognition (CVPR) · doi:10.1109/cvpr.2016.308 · Cited by 32,138
DeLong, E. R., DeLong, D. M., & Clarke-Pearson, D. L. (1988) · Biometrics · doi:10.2307/2531595 · Cited by 22,649
TNM Classification of Malignant Tumours
Hermanek, P., & Sobin, L. H. (1987) · Springer eBooks · doi:10.1007/978-3-642-82982-6 · Cited by 16,077
Domain-Adversarial Training of Neural Networks
Ganin, Y., Ustinova, E., Ajakan, H., Germain, P., Larochelle, H., Laviolette, F., Marchand, M., & Lempitsky, V. (2017) · Advances in Computer Vision and Pattern Recognition · doi:10.1007/978-3-319-58347-1_10 · Cited by 8,318
The consensus molecular subtypes of colorectal cancer
Guinney, J., Dienstmann, R., Wang, X., de Reyniès, A., Schlicker, A., Soneson, C., Marisa, L., Roepman, P., Nyamundanda, G., Angelino, P., et al. (2015) · Nature Medicine · doi:10.1038/nm.3967 · Cited by 5,170
WHO Classification of Tumours of the Digestive System
Bosman, F. T. (2010) · Medical Entomology and Zoology · Cited by 5,041
Cetuximab and Chemotherapy as Initial Treatment for Metastatic Colorectal Cancer
Van Cutsem, E., Köhne, C.-H., Hitre, E., Zaluski, J., Chang Chien, C.-R., Makhson, A., D'Haens, G., Pintér, T., Lim, R., Bodoky, G., et al. (2009) · New England Journal of Medicine · doi:10.1056/nejmoa0805019 · Cited by 3,877
Tumour heterogeneity and resistance to cancer therapies
Dagogo-Jack, I., & Shaw, A. T. (2018) · Nature Reviews Clinical Oncology · doi:10.1038/nrclinonc.2017.166 · Cited by 3,846
Striving for Simplicity: The All Convolutional Net
Springenberg, J. T., Dosovitskiy, A., Brox, T., & Riedmiller, M. (2014) · arXiv · doi:10.48550/arxiv.1412.6806 · Cited by 3,447
Coudray, N., Ocampo, P. S., Sakellaropoulos, T., Narula, N., Snuderl, M., Fenyö, D., Moreira, A. L., Razavian, N., & Tsirigos, A. (2018) · Nature Medicine · doi:10.1038/s41591-018-0177-5 · Cited by 2,930
Research works printed but not linked: 1
- Popovici, 2018, 30(th) European congress of pathology: recognising molecular subtypes of colon cancer from virtual slides, Virchows Arch, 473, 1
Cited by
Sorted by citations
Items 201–265 of 265
Reinisch, W., Rittscher, J., Iacucci, M., Travis, S. P. L., & Friedrich, M. (2026) · Gastroenterology · doi:10.1053/j.gastro.2025.12.002 · Cited by 2
Self-citationThe consensus molecular subtypes of esophageal squamous cell carcinoma
Cui, H., Zhu, Z., Xu, E., Qi, L., Cheng, Y., Zhang, Y., Zhang, L., Cheng, M. Y., Yang, B., Sun, R., et al. (2026) · Signal Transduction and Targeted Therapy · doi:10.1038/s41392-026-02577-9 · Cited by 1
“43 Combining imaging modalities with other omics and clinical data enhances tumor classi fi cation accuracy and stream-lines clinical implementation, which is essential for personalized therapeutics.”
van der Schee, L., & Laclé, M. M. (2024) · Diagnostic histopathology · doi:10.1016/j.mpdhp.2024.01.007 · Cited by 1
Lee, Y. C. (2024) · Korean Journal of Otorhinolaryngology - Head and Neck Surgery · doi:10.3342/kjorl-hns.2024.00010 · Cited by 1
Innovative Image Processing Methods for Colorectal Tumor Identification
Santhoshi, A., & Muthukumaravel, A. (2024) · Advances in computer and electrical engineering book series · doi:10.4018/979-8-3693-3739-4.ch014 · Cited by 1
Performance comparison of multiple neural networks for brain tumor classification
Wei, M. (2024) · International Conference on Biomedical Engineering and Applications (ICBEA) · doi:10.1109/icbea62825.2024.00012 · Cited by 1
“…contribute to this part by classifying the cancer subtypes based on genetic data [27], by predicting the molecular profiles based on image data [28–30], by predicting individual prognosis based on covariates (e.g., clinical and genetic features) [31–34], and by predicting drug response based on…”
MethodVolinsky-Fremond, S., Andani, S., Wolf, J. B., Dijkstra, J., Melsbach, S., Jobsen, J. J., Brinkhuis, M., Roothaan, S. M., Jurgenliemk-Schulz, I. M., Lutgens, L. C. H. W., et al. (2022) · SSRN Electronic Journal · doi:10.2139/ssrn.4144537 · Cited by 1
Self-citationOmar, M., Xu, Z., Rand, S. B., Mohammad, M., Salles, D. C., Schaeffer, E. M., Robinson, B. D., Lotan, T. L., Loda, M. F., & Marchionni, L. (2022) · bioRxiv (Cold Spring Harbor Laboratory) · doi:10.1101/2022.11.18.517111 · Cited by 1
“Additionally, DL has been employed in more advanced tasks including classification of tumor subtypes 20 – 22 , tumor grading 19,23 , and prediction of therapeutic response 24 .”
MethodEminağa, O., Leyh‐Bannurah, S., Shariat, S. F., et al. (2023) · Research Square · doi:10.21203/rs.3.rs-3151281/v1 · Cited by 1
Deep Learning and Digital Pathology Power Precision Treatment of Triple-Negative Breast CancerPreprint
Zhao, S., Yan, C., Lv, H., et al. (2021) · SSRN Electronic Journal · doi:10.2139/ssrn.3909786
White, B. S., Woo, X., Koc, S., Sheridan, T., Neuhauser, S. B., Wang, S., Evrard, Y. A., Landua, J. D., Mashl, R. J., Davies, S. R., et al. (2022) · bioRxiv (Cold Spring Harbor Laboratory) · doi:10.1101/2022.10.26.512745
“…2018) and expression (Coudray et al. 2018; Schmauch et al. 2020), survival (Kather et al. 2019), cancer types (Noorbakhsh et al. 2020), molecular (Sirinukunwattana et al. 2021), clinical (Rawat et al. 2020), and histological (J. Li et al. 2022) tumor subtypes, and response to both chemotherapy…”
BackgroundYavuz, A., Alpsoy, A., Gedik, E. O., Celik, M. Y., Başsorgun, C. İ., Ünal, B., & Elpek, G. Ö. (2022) · Artificial Intelligence in Gastroenterology · doi:10.35712/aig.v3.i5.142
Molecular Subtypes of High-Grade Serous Ovarian Carcinoma
Asaturova, A. V., Tregubova, A., & Magnaeva, A. (2022) · Interdisciplinary cancer research · doi:10.1007/16833_2022_102
Application of Artificial Intelligence in Gastrointestinal Cancer
崔, 洪. (2023) · Advances in Clinical Medicine · doi:10.12677/acm.2023.133566
Hu, Y., Sirinukunwattana, K., Li, B., Gaitskell, K. L., Bonnaffé, W., Wojciechowska, M., Wood, R., Alham, N. K., Malacrino, S., Woodcock, D. J., et al. (2023) · medRxiv · doi:10.1101/2023.07.30.23293391
“(1) (2) High attention tiles (heatmaps) with EMT-high / low labels”
BackgroundMethodInfluentialSelf-citationArtificial intelligence in pathology and application to liver disease
Caldéraro, J., & Vij, M. (2023) · Elsevier eBooks · doi:10.1016/b978-0-323-99136-0.00014-3 · Cited by 1
Shi, T., Li, M., & Yu, Y. (2023) · Frontiers in Molecular Biosciences · doi:10.3389/fmolb.2023.1284623
Prediction of Head-Neck Cancer Recurrence from Pet/CT Images with Havrda-Charvat Entropy
Brochet, T., Lapuyade‐Lahorgue, J., Li, H., et al. (2023) · International Conference on Image Processing Theory, Tools and Applications (IPTA) · doi:10.1109/ipta59101.2023.10320046
“Classification can be used to automatically identify the kind of cancer the patient is suffering from [15, 16] or the relevant outcomes after a specific treatment, such as survival expectation [17] or relation to treatment [18].”
BackgroundHECTOR: multimodal deep learning predicts recurrence risk in endometrial cancerPreprint
Volinsky-Fremond, S., Horeweg, N., Andani, S., Wolf, J. B., Lafarge, M. W., de Kroon, C. D., Ørtoft, G., Høgdall, E. V. S., Dijkstra, J., Jobsen, J. J., et al. (2023) · medRxiv · doi:10.1101/2023.11.27.23298994
Self-citationKünstliche Intelligenz in der Pathologie: Status quo und Zukunftsperspektiven
Foersch, S., & Schulz, S. (2024) · best practice onkologie · doi:10.1007/s11654-024-00572-6
Dai, Y., & Feng, Q. (2024) · Journal of Gastrointestinal Oncology · doi:10.21037/jgo-24-322
“Moreover, the analysis does not account for histological subtypes of colorectal cancer, which have been shown to vary in prognosis (4).”
Yu, T., Yan, J., Liu, C., Yao, C., Xu, Y., Xu, J., Xu, J., & Sun, Q. (2024) · Journal of Gastrointestinal Oncology · doi:10.21037/jgo-24-45
Prognosis in stage II colon cancer: Expanding the horizons of risk factors
Díaz, M. B. N., Gentili, C., Martín, M. J., & Carriere, P. (2025) · World Journal of Gastrointestinal Oncology · doi:10.4251/wjgo.v17.i2.100552
Xie, Z., Yu, Y., Xu, M., Zheng, Y., Huang, M., Chen, Y., Wu, J., Lin, L., Chen, S., Lin, H., et al. (2025) · SSRN Electronic Journal · doi:10.2139/ssrn.5159881
Uterine Tumors and the Environment
Yang, S., Parra-Forero, L. Y., Andrus, A. R., Sexton, C. N., Kuang, D., & Nowak, R. A. (2025) · Elsevier eBooks · doi:10.1016/b978-0-323-95488-4.00256-4
Integrating histopathology and epidemiology to explore cancer aetiology and survival
Gaitskell, K. L. (2025) · Diagnostic histopathology · doi:10.1016/j.mpdhp.2025.03.005
Predicting Multiomics Histopathology Features with Surface Parameterizations
Huang, K., Tan, Z.-H., Yu, W., Wang, X., Ding, Y., Shi-hui, X., Chen, Z., Zhang, Y., Liu, Y., Lin, W., et al. (2025) · Engineering · doi:10.1016/j.eng.2025.07.026
Gögenur, M., Bräuner, K. B., Löffler, L., et al. (2025) · Clinical Epidemiology · doi:10.2147/clep.s532957
“21,22 The enhanced algorithm provides a robust foundation to enrich existing registry data sources, so that AI-driven models can be developed aimed at predicting recurrence risk and informing clinical decision-making.”
Identification of PLXNC1 as a novel biomarker for consensus molecular subtype 4 in colorectal cancer
Wang, W., Zhou, M., Li, T., Gan, W., Lv, S., Yan, Z., Hou, Y., Zeng, Z., Yang, L., Zhang, F., et al. (2025) · Genes & Diseases · doi:10.1016/j.gendis.2025.101974
“Hema-toxylin-eosin staining is routine for patients with CRC; thus, this model does not require additional tests and is suitable for remote pathological diagnosis of CRC. 62 We propose PLXNC1 as a potential biomarker for CMS4 CRC.”
Ding, G.-Y., Tan, W.-M., Lin, Y.-P., Ling, Y., Huang, W., Zhang, S., Shi, J.-Y., Luo, R.-K., Ji, Y., Wang, X.-Y., et al. (2024) · Figshare · doi:10.6084/m9.figshare.26198920
Rao, S. R., Verrill, C., Cerundolo, L., Alham, N. K., Kaya, Z., O’Hanlon, M., Hayes, A. A., Lambert, A. G., James, M., Tullis, I. D. C., et al. (2024) · Figshare · doi:10.6084/m9.figshare.26682811
Self-citationPeng, J., Xu, Z., Dan, H., Li, J., Wang, J., Luo, X., Xu, H., Zeng, X. Y., & Chen, Q. (2024) · Figshare · doi:10.6084/m9.figshare.25572541
Rao, S. R., Verrill, C., Cerundolo, L., Alham, N. K., Kaya, Z., O’Hanlon, M., Hayes, A. A., Lambert, A. G., James, M., Tullis, I. D. C., et al. (2024) · Figshare · doi:10.6084/m9.figshare.26682808
Self-citationDing, G.-Y., Tan, W.-M., Lin, Y.-P., Ling, Y., Huang, W., Zhang, S., Shi, J.-Y., Luo, R.-K., Ji, Y., Wang, X.-Y., et al. (2024) · Figshare · doi:10.6084/m9.figshare.26745257
Rao, S., Verrill, C., Cerundolo, L., Alham, N. K., Kaya, Z., O’Hanlon, M., Hayes, A. A., Lambert, A. G., James, M., Tullis, I. D. C., et al. (2024) · Figshare · doi:10.6084/m9.figshare.26682805
Self-citationPeng, J., Xu, Z., Dan, H., Li, J., Wang, J., Luo, X., Xu, H., Zeng, X. Y., & Chen, Q. (2024) · Figshare · doi:10.6084/m9.figshare.25572699
Ding, G.-Y., Tan, W.-M., Lin, Y.-P., Ling, Y., Huang, W., Zhang, S., Shi, J.-Y., Luo, R.-K., Ji, Y., Wang, X.-Y., et al. (2024) · Figshare · doi:10.6084/m9.figshare.26745242
Ding, G.-Y., Tan, W.-M., Lin, Y.-P., Ling, Y., Huang, W., Zhang, S., Shi, J.-Y., Luo, R.-K., Ji, Y., Wang, X.-Y., et al. (2024) · Figshare · doi:10.6084/m9.figshare.26198890
Ding, G.-Y., Tan, W.-M., Lin, Y.-P., Ling, Y., Huang, W., Zhang, S., Shi, J.-Y., Luo, R.-K., Ji, Y., Wang, X.-Y., et al. (2024) · Figshare · doi:10.6084/m9.figshare.26745248
Ding, G.-Y., Tan, W.-M., Lin, Y.-P., Ling, Y., Huang, W., Zhang, S., Shi, J.-Y., Luo, R.-K., Ji, Y., Wang, X.-Y., et al. (2024) · Figshare · doi:10.6084/m9.figshare.26745230
Ding, G.-Y., Tan, W.-M., Lin, Y.-P., Ling, Y., Huang, W., Zhang, S., Shi, J.-Y., Luo, R.-K., Ji, Y., Wang, X.-Y., et al. (2024) · Figshare · doi:10.6084/m9.figshare.26745236
Ding, G.-Y., Tan, W.-M., Lin, Y.-P., Ling, Y., Huang, W., Zhang, S., Shi, J.-Y., Luo, R.-K., Ji, Y., Wang, X.-Y., et al. (2024) · Figshare · doi:10.6084/m9.figshare.26745221
Harness Behavioural Analysis for Unpacking the Bio-Interpretability of Pathology Foundation ModelsPreprint
Hu, Y., Batchkala, G., Gaitskell, K. L., Domingo, E., Li, B., Zhang, T., Li, Z., Friedrich, M., Woodcock, D. J., Verrill, C. L., et al. (2026) · Research Square · doi:10.21203/rs.3.rs-8090378/v1 · Cited by 1
Self-citationBergheim, I., Cadranel, J. F. D., Chen, J., Ding, W., Eferl, R., García‐Ruiz, C., Jaeschke, H., Kazerouni, F., Lonardo, A., Mann, D. A., et al. (2026) · Exploration of Digestive Diseases · doi:10.37349/edd.2026.1005110
Large-Scale Histological Image Dataset with Metadata for Colorectal Cancer Microenvironment
Wang, H., Li, H., Xue, J., Jiang, Y., Ma, K., Du, F., Mo, G., Li, H. R., Huang, Y., Xie, H., et al. (2026) · Scientific Data · doi:10.1038/s41597-026-06675-9
Zhou, W.-T., Liu, Y., Yu, G., Wang, K.-S., Xu, C., Greenbaum, J., Wu, C., Jiang, L., Papasian, C. J., Xiao, H.-M., et al. (2026) · Bioengineering · doi:10.3390/bioengineering13030334
“Several other studies have focused on molecular patterns of CRC [32–34] and used deep learning of histopathological images to directly extract prognostic features from these patterns [35–37].”
Self-citationDeep‑learning‑based CMS classification from whole slide images in colorectal cancer
Zara, S., Sartori, F., Sanavia, T., et al. (2026) · SPIE Medical Imaging: Digital and Computational Pathology · doi:10.1117/12.3085866
“In recent years, Deep Learning applied to Whole Slide Images (WSI) has emerged as a promising tool to predict these molecular phenotypes directly from routine histology, potentially bypassing the cost and complexity of genomic sequencing [4][5][6][7].”
Multimodal Fusion of 3D CT and Pathological Images for Gastric Cancer Recurrence Prediction
Cao, L., Tian, M., Li, J., Chen, Z., Wang, X., Zhong, S., Wu, G., Tang, Z., & Yu, J. (2026) · Cancer Management and Research · doi:10.2147/cmar.s563640
“4 9–12 Against this backdrop, an improved recurrence prediction model is therefore essential for enhancing prediction accuracy, delivering more personalized assessments of recurrence risk, and ultimately guiding tailored postoperative surveillance and adjuvant therapeutic strategies to optimize…”
Beyond Cellularity: MRI Radiomics and the CMS4 Mesenchymal Phenotype in Colorectal Cancer
Arita, Y., & Kim, T. (2026) · Radiology · doi:10.1148/radiol.261015
Feng, B., Yu, Z., Chen, Y., Xu, J., Lei, Y., Wan, M., Lin, F., Cui, J., Hu, Q., Jin, Q., et al. (2026) · Academic Radiology · doi:10.1016/j.acra.2026.04.041
Assessing Foundation Models for Computational Pathology in Endometrial CancerPreprint
Volinsky-Fremond, S., van den Berg, N., Wolf, J. B., Schoenpflug, L. A., Andani, S., Ørtoft, G., Jobsen, J. J., Lutgens, L. C. H. W., Powell, M. E., Mileshkin, L., et al. (2026) · medRxiv · doi:10.64898/2026.05.22.26353897
Self-citationWesselink, E., Kok, D. E. G., Lafarge, M. W., van Lanen, A., Nagtegaal, I. D., Sülter, M., Koopman, M., de Wilt, J. H. W., Kampman, E., Kölzer, V., et al. (2026) · Cancer Epidemiology · doi:10.1016/j.canep.2026.103120
Self-citationMontezuma, D., & Schmitt, F. C. (2026) · Acta Cytologica · doi:10.1159/000552799
Ji, J., Zheng, Q., (51274), X. L., et al. (2026) · Translational Oncology · doi:10.1016/j.tranon.2026.102840
“This technical approach makes it difficult to avoid the bias caused by intratumoral heterogeneity, and may even lead to the mixing of all subtypes in tumors at different proportions [14,15].”
Zhao, Z., Chen, K., Li, F., Wang, X., & Zhu, J. (2026) · Journal of Pharmaceutical Analysis · doi:10.1016/j.jpha.2026.101703 · Cited by 1
Deep learning in multi-omics integration for gastrointestinal cancer biomarker discovery
Lv, J., Liu, D., Guo, L., Wang, Y., Wang, J., & Huang, J. (2026) · Frontiers in Oncology · doi:10.3389/fonc.2026.1856641
Shi, R., Zhi, Y., Gao, L., Li, S., Zhi, K.-Q., & Ren, W. (2026) · Clinical and Translational Medicine · doi:10.1002/ctm2.70723
“114 These techniques quantify each microbial feature’s contribution to an individual prediction, enabling researchers to identify which specific bacterial taxa or functional genes drive the model’s decision.”
Kasai, S., Hatakeyama, K., Shiomi, A., Hotta, K., Manabe, S., Imai, K., Tanaka, Y., Kojima, T., Ohshima, K., Urakami, K., et al. (2026) · Journal of the Anus Rectum and Colon · doi:10.23922/jarc.2026-004
“More recently, deep learning-based image analysis of standard hematoxylin and eosin slides has enabled image-based CMS classification (imCMS), accurately reproducing transcriptomic CMS calls and distinguishing CMS4 by its distinctive stromal morphology[19].”
Esfahani, N. G., Emadi‐Baygi, M., Khanteymoori, A., Kakhaki, P. D., & Azar, B. (2026) · Informatics in Medicine Unlocked · doi:10.1016/j.imu.2026.101800
Assessing Foundation Models for Computational Pathology in Endometrial Cancer
van den Berg, N., Volinsky-Fremond, S., Wolf, J. B., Schoenpflug, L. A., Andani, S., Ørtoft, G., Jobsen, J. J., Lutgens, L. C. H. W., Powell, M. E., Mileshkin, L., et al. (2026) · Modern Pathology · doi:10.1016/j.modpat.2026.101070
Self-citationFlorentin, P. M., Șiancu, P., Mohor, C.-I., et al. (2026) · International Journal of Molecular Sciences · doi:10.3390/ijms27188025
“MSI-associated CRCs frequently exhibit mucinous or medullary morphology; however, extracellular mucin also appears in CMS3 and CMS4 contexts and may reduce overall tumor cellularity [26,34].”
InfluentialLoukopoulou, C., Koliarakis, I., & Tsiaoussis, J. (2026) · Cancers · doi:10.3390/cancers18183052
“Image-based CMS classifiers using deep learning (imCMS) have enabled cost-effective molecular subtyping directly from routine histopathology slides [43], with predicted CMS1 cases showing significantly higher likelihood of pathological complete response to neoadjuvant chemoradiotherapy [44].”
Mathisen, I. F., Koll, F. J., Mayer, R. S., Schulz, M. H., Bein, J., Chun, F. K. ‐., Eckstein, M., Fassl, A., Köllermann, J. W., Wenzel, M., et al. (2026) · Modern Pathology · doi:10.1016/j.modpat.2026.101092
van Duijvenvoorde, M., Kranenburg, O., van den Bos, M., Hagendoorn, J., Roodhart, J. M. L., Milne, A. N., Riele, W. W. T., Lange, M. M., Swijnenburg, R., Arensman, R., et al. (2026) · BMJ Open · doi:10.1136/bmjopen-2026-128210
Metadata
- Authors
- Sirinukunwattana, K., Domingo, E., Richman, S. D., Redmond, K. L., Blake, A., Verrill, C., Leedham, S. J., Chatzipli, A., Hardy, C., Whalley, C. M., Wu, C.-H., Beggs, A. D., McDermott, U., Dunne, P. D., Meade, A., Walker, S. M., Murray, G. I., Samuel, L., Seymour, M., Tomlinson, I., Quirke, P., Maughan, T., Rittscher, J., & Koelzer, V. H.
- Affiliations
- University of Oxford (GB)
- University of Leeds (GB)
- Queen's University Belfast (GB)
- Centre for Human Genetics (GB)
- Wellcome Sanger Institute (GB)
- University of Birmingham (GB)
- MRC Clinical Trials Unit at UCL (GB)
- Almac (United Kingdom) (GB)
- University of Aberdeen (GB)
- Aberdeen Royal Infirmary (GB)
- Department of Oncology, Leeds Institute of Cancer and Pathology, Leeds, UK
- Edinburgh Cancer Research (GB)
- Department of Pathology and Tumour Biology, Leeds Institute of Cancer and Pathology, Leeds, UK
- CRUK/MRC Oxford Institute for Radiation Oncology, University of Oxford, Oxford, UK
- University of Zurich (CH)
- Corresponding author
- Koelzer, Viktor H
- ORCID
- Sirinukunwattana, Korsuk
- Domingo, Enric
- Richman, Susan D
- Redmond, Keara L
- Blake, Andrew
- Verrill, Clare
- Leedham, Simon J
- Chatzipli, Aikaterini
- Whalley, Celina M
- Wu, Chieh-hsi
- Beggs, Andrew D
- McDermott, Ultan
- Dunne, Philip D
- Meade, Angela
- Walker, Steven M
- Murray, Graeme I
- Samuel, Leslie
- Tomlinson, Ian
- Maughan, Timothy
- Rittscher, Jens
- Koelzer, Viktor H
- Venue
- Gut
- Publisher
- BMJ
- Published
- 2020-07-20
- Volume
- 70
- Issue
- 3
- Pages
- 544-554
- ISSN
- 0017-5749 (ISSN-L)
- 1468-3288
- PMC
- PMC7873419
- OpenAlex
- W3043602140
- Semantic Scholar
- 9531fb91f6876c57e3cf9bcb77ec79cc6f2a84d3
- Cited by
- 264
- References
- 30
- Citations by year
- 2026: 35 · 2025: 40 · 2024: 63 · 2023: 37 · 2022: 57 · 2021: 28 · 2020: 4
- FWCI
- 12.37
- Type
- journal article
- Language
- en
- Open access
- hybrid
- doi.org
- Locations
- Gut (publishedVersion, cc-by)
- PubMed Central (publishedVersion, cc-by)
- PubMed (publishedVersion)
- Research Portal (Queen's University Belfast) (publishedVersion, cc-by)
- ePrints Soton (University of Southampton) (acceptedVersion)
- Zurich Open Repository and Archive (University of Zurich) (acceptedVersion, cc-by)
- Aberdeen University Research Archive (Aberdeen University) (submittedVersion)
- UCL Discovery (University College London) (submittedVersion)
- University of Birmingham Research Portal (University of Birmingham) (submittedVersion)
- University of Birmingham Research Portal (University of Birmingham) (submittedVersion, cc-by)
- Edinburgh Research Explorer (University of Edinburgh) (submittedVersion, cc-by)
- Zurich Open Repository and Archive (University of Zurich) (submittedVersion, cc-by)
- Zurich Open Repository and Archive (University of Zurich)
- Greater South Information System
- Funders
- National Institute for Health Research (NIHR) Oxford Biomedical Research Centre
- Engineering and Physical Sciences Research Council (EP/M013774/1)
- Medical Research Council UK
- Cancer Research UK
- Promedica Foundation (F-87701-41-01)
- Schweizerischer Nationalfonds zur Förderung der Wissenschaftlichen Forschung (P2SKP3_168322/1)
- Topics
- Physical Sciences › Computer Science › Artificial Intelligence › AI in cancer detection
- Health Sciences › Medicine › Radiology, Nuclear Medicine and Imaging › Radiomics and Machine Learning in Medical Imaging
- Health Sciences › Medicine › Pathology and Forensic Medicine › Genetic factors in colorectal cancer
- Keywords
- colorectal cancer, consensus molecular subtypes, image classification, H&E histology, deep learning, intratumoral heterogeneity, rectal cancer, histopathology, molecular classification, prognostic stratification, epigenetic modifications
- MeSH terms
- Deep Learning, Biopsy, Humans, Phenotype, Predictive Value of Tests, Prognosis, RNA, Biomarkers, Tumor, Colorectal Neoplasms, Gene Expression Regulation, Neoplastic, Disease Progression, Gene Expression Profiling, Consensus, Neoplasm Grading, Datasets as Topic
About these checks
Registry, retraction, Cites and statistics results are computed, not judged, with one exception: a printed reference that no index lists is read once by a model before it counts as a citation error. Claims are extracted by a model and kept only when their quote appears verbatim in the text; each cited source is then checked, with a model’s help, for whether it says what the claim relies on. Those verdicts can be wrong — read the claim’s quote and the cited source before relying on one.
Statistics and arithmetic are recomputed, not judged.
Confidence bands are shown only for fields calibrated on our annotated test set. None is calibrated yet, so no band is shown.
What counts as a claim ›How we measure confidence ›How we check this ›
Are you an author, or do you see a problem with this page? Request a review
