

The DOI matches its Crossref record; 54 of the 55 references it cites were found in a registry or an index.
A 600 kb deletion syndrome at 16p11.2 leads to energy imbalance and neuropsychiatric disorders
Open accessAbstract
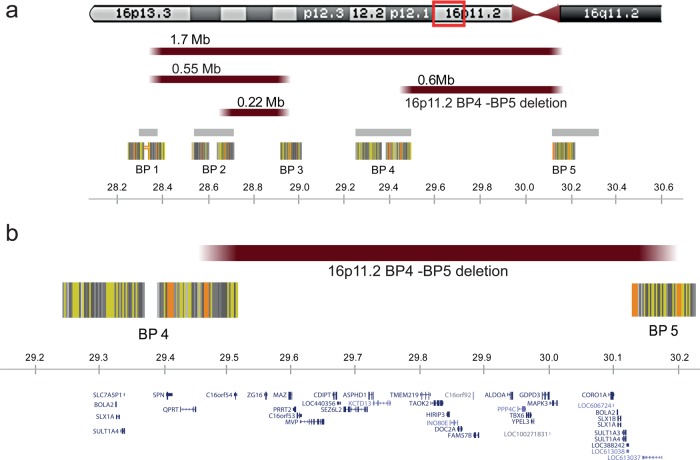
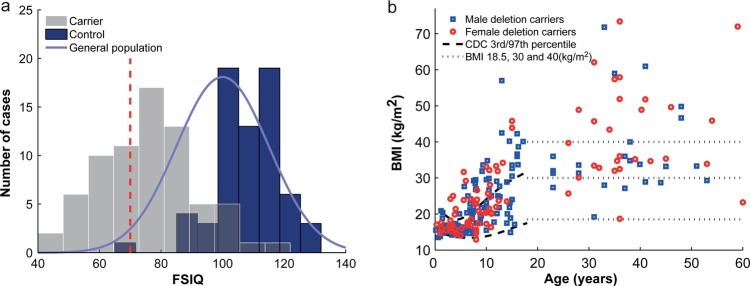
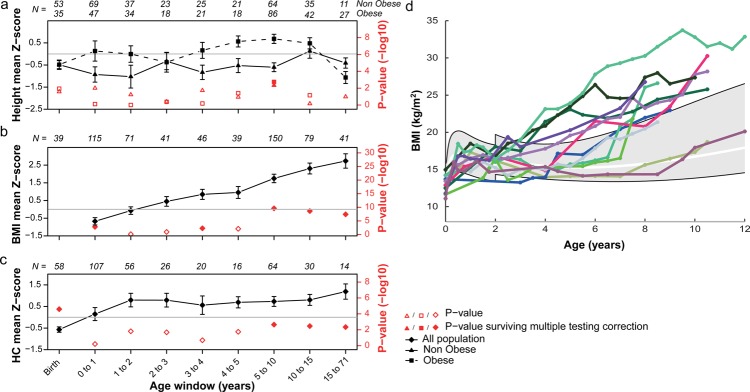
Background: The recurrent ∼600 kb 16p11.2 BP4-BP5 deletion is among the most frequent known genetic aetiologies of autism spectrum disorder (ASD) and related neurodevelopmental disorders. Objective: To define the medical, neuropsychological, and behavioural phenotypes in carriers of this deletion. Methods: We collected clinical data on 285 deletion carriers and performed detailed evaluations on 72 carriers and 68 intrafamilial non-carrier controls. Results: When compared to intrafamilial controls, full scale intelligence quotient (FSIQ) is two standard deviations lower in carriers, and there is no difference between carriers referred for neurodevelopmental disorders and carriers identified through cascade family testing. Verbal IQ (mean 74) is lower than non-verbal IQ (mean 83) and a majority of carriers require speech therapy. Over 80% of individuals exhibit psychiatric disorders including ASD, which is present in 15% of the paediatric carriers. Increase in head circumference (HC) during infancy is similar to the HC and brain growth patterns observed in idiopathic ASD. Obesity, a major comorbidity present in 50% of the carriers by the age of 7 years, does not correlate with FSIQ or any behavioural trait. Seizures are present in 24% of carriers and occur independently of other symptoms. Malformations are infrequently found, confirming only a few of the previously reported associations. Conclusions: The 16p11.2 deletion impacts in a quantitative and independent manner FSIQ, behaviour and body mass index, possibly through direct influences on neural circuitry. Although non-specific, these features are clinically significant and reproducible. Lastly, this study demonstrates the necessity of studying large patient cohorts ascertained through multiple methods to characterise the clinical consequences of rare variants involved in common diseases.
Overview
The claims and statistics of this paper haven’t been checked yet.
Run the check — free, no account needed. It reads the open-access text and checks the sources it cites.
Integrity signals
Registry
Cites
Statistics
Figures
Verification
Claims the paper makes
The claims and statistics of this paper haven’t been checked yet.
Run the check — free, no account needed. It reads the open-access text and checks the sources it cites.
Claims other papers make about this one
Each is checked against this paper’s own text: does it say what the citing paper says it does?
In the citing paper
“Deletions of 16p11.2 are associated with increased head circumference (macrocephaly) [10, 12, 17, 23] and obesity [10, 12, 16, 20], whereas duplications often result in below average head size (microcephaly) [10, 17, 23, 24] and low body weight/BMI [10, 24].”
From 16p11.2 Copy Number Variations and Neurodevelopmental Disorders (2020) · cites this paper as [12]
In the citing paper
“Deletions and duplications of 16p11.2 have highly pleiotropic phenotypic effects, with strong links to ASD [8–19], ID [8, 10, 12, 14–16, 19–21], motor/developmental delay [8–10, 12, 13, 15–19, 22], dysmorphic features [8, 12, 16, 17, 22], and epilepsy/seizures [10, 12, 17].”
From 16p11.2 Copy Number Variations and Neurodevelopmental Disorders (2020) · cites this paper as [12]
In the citing paper
“Several supporting studies also reported lower FSIQ scores in 16p11.2 deletion [12, 35] and duplication [19, 35] patients than intrafamilial controls.”
From 16p11.2 Copy Number Variations and Neurodevelopmental Disorders (2020) · cites this paper as [12]
In the citing paper
“In studies with at least 50 subjects, between 60–76% of 16p11.2 deletions were reported as de novo events [10, 12, 34, 36], while only 16–29% of 16p11.2 duplications occurred de novo [10, 19, 34, 36].”
From 16p11.2 Copy Number Variations and Neurodevelopmental Disorders (2020) · cites this paper as [12]
In the citing paper
“Epilepsy/seizures ranks among the most common phenotypes observed in both 16p11.2 deletions and duplications [10, 12, 16, 17, 33, 36] (Table 2).”
From 16p11.2 Copy Number Variations and Neurodevelopmental Disorders (2020) · cites this paper as [12]
In the citing paper
“16p11.2 deletions and duplications are linked to several other psychiatric conditions, including depression [14, 47] and anxiety [12, 14, 18, 19, 23, 34].”
From 16p11.2 Copy Number Variations and Neurodevelopmental Disorders (2020) · cites this paper as [12]
In the citing paper
“Attention-deficit/hyperactivity disorder (ADHD) is also observed in 16p11.2 CNV carriers [12, 15–17, 19, 23, 48], at rates as high as 29% (63/217) and 42% (48/114) in deletion and duplication carriers, respectively [34].”
From 16p11.2 Copy Number Variations and Neurodevelopmental Disorders (2020) · cites this paper as [12]
In the citing paper
“Several reports indicate higher BMI in 16p11.2 deletion patients [10, 12, 23].”
From 16p11.2 Copy Number Variations and Neurodevelopmental Disorders (2020) · cites this paper as [12]
Self-check
Percentages, sums and reported differences re-computed from the paper’s own numbers.
The self-check needs the paper’s full text.
Citations
Cites
Diagnostic and Statistical Manual of Mental Disorders
Williams, J. B. W., & First, M. B. (2013) · Oxford University Press eBooks · doi:10.1093/acrefore/9780199975839.013.104 · Cited by 109,845
Lord, C., Rutter, M., & Le Couteur, A. (1994) · Journal of Autism and Developmental Disorders · doi:10.1007/bf02172145 · Cited by 9,065
Lord, C., Risi, S., Lambrecht, L., Cook, E. H., Leventhal, B. L., DiLavore, P. C., Pickles, A., & Rutter, M. (2000) · Journal of Autism and Developmental Disorders · doi:10.1023/a:1005592401947 · Cited by 7,520
Diagnostic and Statistical Manual of Mental Disorders ( DSM ‐ IV ‐ TR )
Segal, D. L. (2010) · Wiley eBooks · doi:10.1002/9780470479216.corpsy0271 · Cited by 4,687
(1983) · Medical Entomology and Zoology · Cited by 4,251
Miller, D. T., Adam, M. P., Aradhya, S., Biesecker, L. G., Brothman, A. R., Carter, N. P., Church, D. M., Crolla, J. A., Eichler, E. E., Epstein, C. J., et al. (2010) · The American Journal of Human Genetics · doi:10.1016/j.ajhg.2010.04.006 · Cited by 2,882
Self-citationStrong association of de novo copy number mutations with autism
Sebat, J., Lakshmi, B., Malhotra, D., Troge, J., Lese-Martin, C., Walsh, T., Yamrom, B., Yoon, S., Krasnitz, A., Kendall, J., et al. (2007) · Science · doi:10.1126/science.1138659 · Cited by 2,795
Self-citationMcDonald-McGinn, D. M., Sullivan, K. E., Marino, B., Philip, N., Swillen, A., Vorstman, J. A. S., Zackai, E. H., Emanuel, B. S., Vermeesch, J. R., Morrow, B. E., et al. (2015) · Nature Reviews Disease Primers · doi:10.1038/nrdp.2015.71 · Cited by 2,236
Structural Variation of Chromosomes in Autism Spectrum Disorder
Marshall, C. R., Noor, A., Vincent, J. B., Lionel, A. C., Feuk, L., Skaug, J., Shago, M., Moessner, R., Pinto, D., Ren, Y., et al. (2008) · The American Journal of Human Genetics · doi:10.1016/j.ajhg.2007.12.009 · Cited by 1,815
Development of the Children’s Eating Behaviour Questionnaire
Wardle, J., Guthrie, C. A., Sanderson, S., & Rapoport, L. (2001) · Journal of Child Psychology and Psychiatry · doi:10.1111/1469-7610.00792 · Cited by 1,747
Research works printed but not linked: 2
- Wechsler D . Wechsler adult intelligence scale—third edition. Administration and scoring manual San Antonio, TX: The Psychological Corporation, 1997. · DOI · Paper page
- Sparrow SS Cichetti DV Balla DA . Vineland adaptative behavior scales. 2nd edn. Livonia, MN: Pearson Assessments, 2006. · DOI
Cited by
Sorted by citations
Items 101–200 of 331
Hanßen, R., Auwerx, C., Jõeloo, M., Sadler, M. C., Henning, E., Keogh, J. M., Bounds, R., Smith, M., Firth, H. V., Kutalik, Z., et al. (2023) · Cell Reports Medicine · doi:10.1016/j.xcrm.2023.101155 · Cited by 32
Self-citationIncreased TBX6 gene dosages induce congenital cervical vertebral malformations in humans and mice
Ren, X., Yang, N., Wu, N., Xu, X., Chen, W., Zhang, L., Li, Y., Du, R., Dong, S., Zhao, S., et al. (2019) · Journal of Medical Genetics · doi:10.1136/jmedgenet-2019-106333 · Cited by 31
Hudac, C. M., Bove, J., Barber, S., Duyzend, M., Wallace, A., Martin, C. L., Ledbetter, D. H., Hanson, E., Goin‐Kochel, R. P., Green‐Snyder, L., et al. (2020) · Autism Research · doi:10.1002/aur.2332 · Cited by 31
Self-citationAlinejad‐Rokny, H., Heng, J. I., & Forrest, A. R. R. (2020) · Cell Reports · doi:10.1016/j.celrep.2020.108307 · Cited by 30
Refinement of genotype‐phenotype correlation in 18 patients carrying a 1q24q25 deletion
Chatron, N., Haddad, V., Andrieux, J., Désir, J., Boute, O., Dieux, A., Baumann, C., Drunat, S., Gérard, M., Bonnet, C., et al. (2015) · American Journal of Medical Genetics Part A · doi:10.1002/ajmg.a.36856 · Cited by 31
Self-citationFilges, I., Sparagana, S., Sargent, M., Selby, K., Schlade‐Bartusiak, K., Lueder, G. T., Robichaux‐Viehoever, A., Schlaggar, B. L., Shimony, J. S., & Shinawi, M. (2014) · American Journal of Medical Genetics Part A · doi:10.1002/ajmg.a.36605 · Cited by 30
Hui, K. K., Katayama, Y., Nakayama, K. I., Nomura, J., & Sakurai, T. (2018) · Neuroscience & Biobehavioral Reviews · doi:10.1016/j.neubiorev.2018.08.001 · Cited by 31
Vasileiou, G., Hoyer, J., Thiel, C. T., Schaefer, J. F., Zapke, M., Krumbiegel, M., Kraus, C. S., Zweier, M., Uebe, S., Ekici, A. B., et al. (2019) · Prenatal Diagnosis · doi:10.1002/pd.5556 · Cited by 29
Comprehensive Behavioral Phenotyping of a 16p11.2 Del Mouse Model for Neurodevelopmental Disorders
Lynch, J. F., Ferri, S. L., Angelakos, C. C., Schoch, H., Nickl‐Jockschat, T., Gonzalez, A., O'Brien, W. T., & Abel, T. G. (2020) · Autism Research · doi:10.1002/aur.2357 · Cited by 28
Tomasello, D. L., Kim, J. L., Khodour, Y., McCammon, J. M., Mitalipova, M., Jaenisch, R., Futerman, A. H., & Sive, H. L. (2021) · iScience · doi:10.1016/j.isci.2021.103551 · Cited by 30
Campbell, I. M., Rao, M., Arredondo, S. D., Lalani, S. R., Xia, Z., Kang, S.-H. L., Bi, W., Breman, A. M., Smith, J. L., Bacino, C. A., et al. (2013) · PLoS Genetics · doi:10.1371/journal.pgen.1003797 · Cited by 26
Self-citationGuideLiner catheter facilitated PCI--a novel device with multiple applications.
Pershad, A., Sein, V., & Laufer, N. (2011) · PubMed · Cited by 26
Molecular Diagnosis of Craniosynostosis Using Targeted Next-Generation Sequencing
Yoon, J. G., Hahn, H. M., Choi, S., Kim, S., Aum, S., Yu, J. W., Park, E.-K., Shim, K., Lee, M. G., & Kim, Y. O. (2019) · Neurosurgery · doi:10.1093/neuros/nyz470 · Cited by 26
Mango, D., & Ledonne, A. (2023) · Cells · doi:10.3390/cells12121588 · Cited by 25
Chromosomal microarray analysis—a routine clinical genetic test for patients with schizophrenia
Baker, K., Costain, G., Fung, W. L. A., & Bassett, A. S. (2014) · The Lancet Psychiatry · doi:10.1016/s2215-0366(14)70308-6 · Cited by 27
Cross-Disorder Comparison of Four Neuropsychiatric CNV Loci
Moreno‐De‐Luca, D., Moreno-De-Luca, A., Cubells, J. F., & Sanders, S. (2014) · Current Genetic Medicine Reports · doi:10.1007/s40142-014-0045-7 · Cited by 26
Intrauterine phenotypic features associated with 16p11.2 recurrent microdeletions
Lin, S., Shi, S., Zhou, Y. Y., Ji, Y., Huang, P., Wu, J., Chen, B., & Luo, Y. (2018) · Prenatal Diagnosis · doi:10.1002/pd.5245 · Cited by 24
Pizzo, L., Lasser, M. C., Yusuff, T., Jensen, M., Ingraham, P., Huber, E., Singh, M. D., Monahan, C., Iyer, J. S., Desai, I., et al. (2021) · PLoS Genetics · doi:10.1371/journal.pgen.1009112 · Cited by 25
Rashidi‐Nezhad, A., Talebi, S., Saebnouri, H., Akrami, S. M., & Reymond, A. (2014) · BMC Medical Genetics · doi:10.1186/1471-2350-15-75 · Cited by 24
Self-citationAbnormal auditory and language pathways in children with 16p11.2 deletion
Berman, J., Chudnovskaya, D., Blaskey, L. G., Kuschner, E. S., Mukherjee, P., Buckner, R., Nagarajan, S. S., Chung, W. K., Spiro, J. E., Sherr, E. H., et al. (2015) · NeuroImage Clinical · doi:10.1016/j.nicl.2015.07.006 · Cited by 24
Self-citationVos, N., Kleinendorst, L., van der Laan, L., van Uhm, J., Jansen, P. R., van Eeghen, A. M., Maas, S. M., Mannens, M. M. A. M., & van Haelst, M. M. (2024) · European Journal of Human Genetics · doi:10.1038/s41431-024-01601-2 · Cited by 31
Berman, J., Chudnovskaya, D., Blaskey, L. G., Kuschner, E. S., Mukherjee, P., Buckner, R. L., Nagarajan, S. S., Chung, W. K., Sherr, E. H., & Roberts, T. P. L. (2016) · American Journal of Neuroradiology · doi:10.3174/ajnr.a4687 · Cited by 24
Self-citationLu, H.-C., Pollack, H., Lefante, J. J., Mills, A. A., & Tian, D. (2019) · Sleep · doi:10.1093/sleep/zsy253 · Cited by 22
Krepischi, A. C. V., Villela, D., da Costa, S. S., Mazzonetto, P. C., Schauren, J. D. S., Migliavacca, M. P., Milanezi, F., dos Santos, J. G., Guida, G., Guarischi‐Sousa, R., et al. (2022) · Scientific Reports · doi:10.1038/s41598-022-19274-6 · Cited by 23
Gill, R. J., Chen, Q., D’Angelo, D., & Chung, W. K. (2014) · Obesity · doi:10.1002/oby.20892 · Cited by 23
Self-citationLu, H.-C., Mills, A. A., & Tian, D. (2017) · Journal of Neurophysiology · doi:10.1152/jn.00306.2017 · Cited by 22
Expression of Genes in the 16p11.2 Locus during Development of the Human Fetal Cerebral Cortex
Morson, S., Yang, Y., Price, D. J., & Pratt, T. (2021) · Cerebral Cortex · doi:10.1093/cercor/bhab067 · Cited by 23
Hudac, C. M., Kresse, A., Aaronson, B., DesChamps, T. D., Webb, S. J., & Bernier, R. (2015) · Journal of Neurodevelopmental Disorders · doi:10.1186/s11689-015-9118-5 · Cited by 24
Self-citationMonogenic and chromosomal causes of isolated speech and language impairment
Barnett, C., & van Bon, B. W. M. (2015) · Journal of Medical Genetics · doi:10.1136/jmedgenet-2015-103161 · Cited by 23
Neurocognitive profiles of 22q11.2 and 16p11.2 deletions and duplications
Gur, R. C., Bearden, C. E., Jacquemont, S., Swillen, A., van Amelsvoort, T., van den Bree, M. B. M., Vorstman, J. A. S., Sebat, J. L., Ruparel, K., Gallagher, R. S., et al. (2024) · Molecular Psychiatry · doi:10.1038/s41380-024-02661-y · Cited by 21
Self-citationAlver, M., Mancini, V., Läll, K., Schneider, M., Romano, L., Milani, L. A., Nelis, M., Mägi, R., Esko, T., Metspalu, A., et al. (2022) · Molecular Psychiatry · doi:10.1038/s41380-022-01674-9 · Cited by 19
Self-citationPanzini, C. M., Ehlinger, D. G., Alchahin, A. M., Guo, Y., & Commons, K. G. (2017) · Journal of Neurochemistry · doi:10.1111/jnc.14227 · Cited by 21
Leone, R., Zuglian, C., Brambilla, R., & Morella, I. (2024) · Frontiers in Pharmacology · doi:10.3389/fphar.2024.1407865 · Cited by 22
Detecting monogenic obesity: a systematic exome-wide workup of over 500 individuals
Künzel, R., Faust, H., Bundalian, L., Blüher, M., Jasaszwili, M., Kirstein, A., Kobelt, A., Körner, A., Popp, D., Wenzel, E., et al. (2025) · International Journal of Obesity · doi:10.1038/s41366-025-01819-0 · Cited by 20
Kretz, P. F., Wagner, C., Mikhaleva, A., Montillot, C., Hugel, S., Morella, I., Kannan, M., Fischer, M., Milhau, M., Yalçın, İ., et al. (2023) · Genome biology · doi:10.1186/s13059-023-03092-8 · Cited by 23
Self-citationThe psychiatric phenotypes of 1q21 distal deletion and duplication
Linden, S. C., Watson, C. J., Smith, J., Chawner, S. J. R. A., Lancaster, T. M., Evans, F., Williams, N. M., Skuse, D., Raymond, F. L., Hall, J., et al. (2021) · Translational Psychiatry · doi:10.1038/s41398-021-01226-9 · Cited by 17
Self-citationThe pleiotropic spectrum of proximal 16p11.2 CNVs
Auwerx, C., Kutalik, Z., & Reymond, A. (2024) · The American Journal of Human Genetics · doi:10.1016/j.ajhg.2024.08.015 · Cited by 19
Self-citationBouwkamp, C. G., Kievit, A. J. A., Markx, S., Friedman, J. I., van Zutven, L. J. C. M., van Minkelen, R., Vrijenhoek, T., Xu, B., Sterrenburg-v.d.Nieuwegiessen, I. M., Veltman, J. A., et al. (2017) · American Journal of Psychiatry · doi:10.1176/appi.ajp.2017.16080946 · Cited by 20
Social behavior in 16p11.2 and 22q11.2 copy number variations: Insights from mice and humans
Benedetti, A., Molent, C., Barcik, W., & Papaleo, F. (2021) · Genes Brain & Behavior · doi:10.1111/gbb.12787 · Cited by 18
Sensorimotor Cortical Oscillations during Movement Preparation in 16p11.2 Deletion Carriers
Hinkley, L. B. N., Dale, C. L., Luks, T. L., Findlay, A. M., Bukshpun, P., Pojman, N., Thieu, T., Chung, W. K., Berman, J., Roberts, T. P. L., et al. (2019) · Journal of Neuroscience · doi:10.1523/jneurosci.3001-17.2019 · Cited by 19
Self-citationOrnoy, A., Gorobets, D., Weinstein‐Fudim, L., & Becker, M. (2023) · International Journal of Molecular Sciences · doi:10.3390/ijms24043287 · Cited by 17
Fetit, R., Barbato, M. I., Theil, T., Pratt, T., & Price, D. J. (2023) · Development · doi:10.1242/dev.201227 · Cited by 17
Haplotype-specific MAPK3 expression in 16p11.2 deletion contributes to variable neurodevelopment
Liu, F., Chen, L., Li, Z., Zhao, S., Yuan, H., Yao, R., Qin, Z., Shangguan, S., Zhang, S., Zou, L., et al. (2023) · Brain · doi:10.1093/brain/awad071 · Cited by 21
Szelest, M., Stefaniak, M., Ręka, G., Jaszczuk, I., & Lejman, M. (2021) · BMC Medical Genomics · doi:10.1186/s12920-021-00929-8 · Cited by 15
Gatti, M., Tolva, G., Bergamaschi, S., Giavoli, C., Esposito, S., Marchisio, P., & Milani, D. (2018) · Journal of Pediatric and Adolescent Gynecology · doi:10.1016/j.jpag.2018.04.003 · Cited by 15
Distal chromosome 16p11.2 duplications containing SH2B1 in patients with scoliosis
Sadler, B. E., Haller, G., Antunes, L., Bledsoe, X., Morcuende, J. A., Giampietro, P. F., Raggio, C., Miller, N. H., Kidane, Y. H., Wise, C. A., et al. (2019) · Journal of Medical Genetics · doi:10.1136/jmedgenet-2018-105877 · Cited by 15
Nicolle, R., Siquier-Pernet, K., Rio, M., Guimier, A., Ollivier, E., Nitschké, P., Bôle‐Feysot, C., Romana, S. P., Hastie, A. R., Cantagrel, V., et al. (2022) · European Journal of Human Genetics · doi:10.1038/s41431-022-01094-x · Cited by 16
Paroxysmal Kinesigenic Dyskinesia Caused by 16p11.2 Microdeletion
Termsarasab, P., Yang, A., Reiner, J., Mei, H., Scott, S. A., & Frucht, S. J. (2014) · Europe PMC (PubMed Central) · doi:10.7916/d82z149c · Cited by 15
Wassink, T. H., Hazlett, H. C., Davis, L. K., Reiss, A. L., & Piven, J. (2014) · Journal of Neurodevelopmental Disorders · doi:10.1186/1866-1955-6-6 · Cited by 15
Leitsalu, L., Alavere, H., Jacquemont, S., Kolk, A., Maillard, A. M., Reigo, A., Nõukas, M., Reymond, A., Männik, K., Ng, P. C., et al. (2016) · Personalized Medicine · doi:10.2217/pme-2016-0009 · Cited by 15
Self-citationBifocal germinoma in a patient with 16p11.2 microdeletion syndrome
Ventura, M., Gomes, L., Rosmaninho‐Salgado, J., Barros, L. M., Paiva, I., Melo, M., Oliveira, D., & Carrilho, F. (2019) · Endocrinology Diabetes and Metabolism Case Reports · doi:10.1530/edm-18-0149 · Cited by 14
Wang, W., Tan, T., Cao, Q., Zhang, F., Rein, B. A., Duan, W., & Yan, Z. (2022) · The International Journal of Neuropsychopharmacology · doi:10.1093/ijnp/pyac048 · Cited by 16
Rijlaarsdam, J., Cosín‐Tomás, M., Schellhas, L., Abrishamcar, S., Malmberg, A., Neumann, A., Felix, J. F., Sunyer, J., Gützkow, K. B., Gražulevičienė, R., et al. (2022) · Molecular Psychiatry · doi:10.1038/s41380-022-01871-6 · Cited by 16
Openshaw, R. L., Thomson, D. M., Bristow, G. C., Mitchell, E. J., Pratt, J. A., MORRIS, B. J., & Dawson, N. (2023) · Communications Biology · doi:10.1038/s42003-023-04891-2 · Cited by 20
Sequencing of the TBX6 Gene in Families With Familial Idiopathic Scoliosis
Baschal, E. E., Swindle, K., Justice, C. M., Baschal, R. M., Perera, A. G., Wethey, C. I., Poole, A. W., Pourquié, O., Tassy, O., & Miller, N. H. (2015) · Spine Deformity · doi:10.1016/j.jspd.2015.01.005 · Cited by 14
The transcription factor Maz is essential for normal eye development
Medina-Martínez, O., Haller, M., Rosenfeld, J. A., O'Neill, M. A., Lamb, D. J., & Jamrich, M. (2020) · Disease Models & Mechanisms · doi:10.1242/dmm.044412 · Cited by 14
Achkar, C. M. E., Rosen, A. R., Kessler, S. K., Steinman, K. J., Spence, S. J., Ramocki, M. B., Marco, E. J., Snyder, L. G., Spiro, J. E., Chung, W. K., et al. (2022) · Neurology Genetics · doi:10.1212/nxg.0000000000200018 · Cited by 16
Self-citationSyndromic and Monogenic Obesity: New Opportunities Due to Genetic-Based Pharmacological Treatment
Kalinderi, K., Goula, V., Sapountzi, E., Tsinopoulou, V. R., & Fidani, L. (2024) · Children · doi:10.3390/children11020153 · Cited by 15
Carvalho, L. M. L., Jorge, A. A. L., Bertola, D. R., Krepischi, A. C. V., & Rosenberg, C. (2024) · Current Obesity Reports · doi:10.1007/s13679-023-00543-y · Cited by 17
Molloy, C. J., Quigley, C., McNicholas, Á., Lisanti, L., & Gallagher, L. (2023) · Translational Psychiatry · doi:10.1038/s41398-023-02421-6 · Cited by 14
Giovanniello, J. R., Ahrens, S., Yu, K., & Li, B. (2021) · Biological Psychiatry Global Open Science · doi:10.1016/j.bpsgos.2021.01.001 · Cited by 13
Ackerman, S., Schoenbrun, S., Hudac, C., & Bernier, R. (2017) · Journal of Autism and Developmental Disorders · doi:10.1007/s10803-017-3246-6 · Cited by 12
Self-citationCopy Number Variation in Human Health, Disease and Evolution
Sismani, C., Koufaris, C., & Voskarides, K. (2015) · Springer eBooks · doi:10.1007/978-1-4939-3070-8_6 · Cited by 12
Magini, P., Scarano, E., Donati, I., Sensi, A., Mazzanti, L., Perri, A., Tamburrino, F., Mongelli, P., Percesepe, A., Visconti, P., et al. (2019) · Gene · doi:10.1016/j.gene.2019.05.007 · Cited by 11
Gürkan, H., Atlı, E. İ., Atlı, E., Bozatlı, L., Altay, M. A., Yalcintepe, S. A., Özen, Y., Eker, D., Mail, C., Demır, S., et al. (2020) · Nöro Psikiyatri Arşivi · doi:10.29399/npa.24890 · Cited by 11
Identification of Novel Congenital Heart Disease Candidate Genes Using Chromosome Microarray
Shanshen, E., Rosenberg, J. M., & Bergen, A. H. V. (2017) · Pediatric Cardiology · doi:10.1007/s00246-017-1741-3 · Cited by 11
Wilson, K. E., Fish, A. M., Mankiw, C., Xenophontos, A., Warling, A., Whitman, E. T., CLASEN, L. S., Torres, E. N., Blumenthal, J. D., & Raznahan, A. (2021) · Journal of Neurodevelopmental Disorders · doi:10.1186/s11689-021-09360-7 · Cited by 9
Prenatally diagnosed 16p11.2 copy number variations by SNP Array: A retrospective case series
Liu, N., Li, H., Li, M., Gao, Y., & Yan, H. (2022) · Clinica Chimica Acta · doi:10.1016/j.cca.2022.10.016 · Cited by 11
Autosomal Reciprocal Translocations
Gardner, R. J. M., & Amor, D. J. (2018) · Oxford University Press eBooks · doi:10.1093/med/9780199329007.003.0005 · Cited by 10
Touch and olfaction/taste differentiate children carrying a 16p11.2 deletion from children with ASD
Osório, J. M. A., Rodríguez‐Herreros, B., Romascano, D., Junod, V., Habegger, A., Pain, A., Richetin, S., Yu, P., Isidor, B., Maldergem, L. V., et al. (2021) · Molecular Autism · doi:10.1186/s13229-020-00410-w · Cited by 10
Self-citationLongitudinal report of child with de novo 16p11.2 triplication
Wallace, A. S., Hudac, C. M., Steinman, K. J., Peterson, J. L., DesChamps, T. D., Duyzend, M. H., Nuttle, X., Eichler, E. E., & Bernier, R. A. (2018) · Clinical Case Reports · doi:10.1002/ccr3.1236 · Cited by 9
Self-citationGimeno-Ferrer, F., Albuquerque, D., Luján, C. G., Benito, G. M., Banzas, C. T., Repáraz-Andrade, A., Cogollos, V. B., Pérez-Gramunt, M. A., Gómez, E. G., Quintela, I., et al. (2018) · Journal of Human Genetics · doi:10.1038/s10038-018-0545-5 · Cited by 9
Teles, N. O., de Stefano, M. C., Gallagher, L., Rakić, S., Jorge, P., Čuturilo, G., Markovska-Simoska, S., Borg, I., Wolstencroft, J., Tümer, Z., et al. (2020) · International Journal of Environmental Research and Public Health · doi:10.3390/ijerph17249253 · Cited by 11
Disentangling mechanisms behind the pleiotropic effects of proximal 16p11.2 BP4-5 CNVs
Auwerx, C., Moix, S., Kutalik, Z., & Reymond, A. (2024) · The American Journal of Human Genetics · doi:10.1016/j.ajhg.2024.08.014 · Cited by 10
Self-citationNoninvasive Electrophysiology: Emerging Prospects in Aquatic Neurotoxicity Testing
Tomasello, D. L., & Włodkowic, D. (2022) · Environmental Science & Technology · doi:10.1021/acs.est.1c08471 · Cited by 9
Genome-wide meta-analysis of copy number variations with alcohol dependence
Sulovari, A., Liu, Z., Zhu, Z., & Li, D. (2017) · The Pharmacogenomics Journal · doi:10.1038/tpj.2017.35 · Cited by 9
Health supervision for children and adolescents with 16p11.2 deletion syndromePreprint
Chung, W. K., & Herrera, F. F. (2023) · Molecular Case Studies · doi:10.1101/mcs.a006316 · Cited by 9
Self-citationRusu, A., Chevalier, C., de Chaumont, F., Nalesso, V., Brault, V., Hérault, Y., & Ey, E. (2023) · Frontiers in Behavioral Neuroscience · doi:10.3389/fnbeh.2023.1294558 · Cited by 14
Stagi, S., Bianconi, M., Sammarco, M. A., Artuso, R., Giglio, S., & de Martino, M. (2017) · InTech eBooks · doi:10.5772/66128 · Cited by 7
Paroxysmal Kinesigenic Dyskinesia Caused by 16p11.2 Microdeletion and Related Clinical Features
Chen, Y.-L., Chen, D.-F., Ke, H.-Z., Zhao, S.-Y., Li, H.-F., & Wu, Z.-Y. (2022) · Neurology Genetics · doi:10.1212/nxg.0000000000000659 · Cited by 8
Possible association of 16p11.2 copy number variation with altered lymphocyte and neutrophil counts
Giannuzzi, G., Chatron, N., Männik, K., Auwerx, C., Pradervand, S., Willemin, G., Hoekzema, K., Nuttle, X., Chrast, J., Sadler, M. C., et al. (2022) · npj Genomic Medicine · doi:10.1038/s41525-022-00308-x · Cited by 9
Self-citationCopy Number Variations and Cognitive Phenotypes in Unselected Populations
Männik, K., Mägi, R., Macé, A., Cole, B., Guyatt, A. L., Shihab, H. A., Maillard, A. M., Alavere, H., Kolk, A., Reigo, A., et al. (2015) · Obstetrical & Gynecological Survey · doi:10.1097/01.ogx.0000471594.65931.90 · Cited by 8
Self-citationChromosome Instability Syndromes
Gardner, R. J. M., & Amor, D. J. (2018) · Oxford University Press eBooks · doi:10.1093/med/9780199329007.003.0016 · Cited by 9
Ackerman, S., Schoenbrun, S., Hudac, C. M., & Bernier, R. (2017) · Journal of Autism and Developmental Disorders · doi:10.1007/s10803-017-3301-3 · Cited by 8
Self-citationElsayed, L. E. O., AlHarbi, N. A., Alqarni, A. M., Eltayeb, H. H. E., Mostafa, N. M. M., Abdulrahim, M. M., Zaid, H. I. B., Alanzi, L. M., Ababtain, S. A., Aldulaijan, K., et al. (2024) · Human Genomics · doi:10.1186/s40246-024-00662-0 · Cited by 8
Matsuzaki, J., Berman, J., Blaskey, L. G., Kuschner, E. S., Gaetz, L., Mukherjee, P., Buckner, R. L., Nagarajan, S. S., Chung, W. K., Sherr, E. H., et al. (2019) · Biological Psychiatry Cognitive Neuroscience and Neuroimaging · doi:10.1016/j.bpsc.2019.11.005 · Cited by 7
Self-citationMetabolic effects of the schizophrenia-associated 3q29 deletion
Pollak, R. M., Purcell, R. H., Rutkowski, T. P., Malone, T., Pachura, K. J., Bassell, G. J., Epstein, M. P., Dawson, P. A., Smith, M. R., Jones, D. P., et al. (2022) · Translational Psychiatry · doi:10.1038/s41398-022-01824-1 · Cited by 8
Lorenzo, S. M., Moreno, M. D. M. M., Atas-Özcan, H., Pellen, M., Nalesso, V., Raffelsberger, W., Prevost, G., Lindner, L., Birling, M., Ménoret, S., et al. (2023) · Frontiers in Neuroscience · doi:10.3389/fnins.2023.1148683 · Cited by 9
Chromosome Microarrays in Diagnostic Testing: Interpreting the Genomic Data
Peters, G. B., & Pertile, M. D. (2014) · Methods in molecular biology · doi:10.1007/978-1-4939-0847-9_8 · Cited by 7
Chromosome 5q33 deletions associated with congenital heart defects
Starkovich, M., Lalani, S. R., Mercer, C. L., & Scott, D. A. (2016) · American Journal of Medical Genetics Part A · doi:10.1002/ajmg.a.37957 · Cited by 6
Lengyel, A., Pinti, É., Pikó, H., Jávorszky, E., David, D., Tihanyi, M., Gönczi, É., Kiss, E., Tóth, Z., Tory, K., et al. (2020) · European Journal of Medical Genetics · doi:10.1016/j.ejmg.2020.104027 · Cited by 8
Lin, S., Shi, S., Lü, J., He, Z., Li, D., Huang, L., Huang, X., Zhou, Y. Y., & Luo, Y. (2024) · Molecular Cytogenetics · doi:10.1186/s13039-023-00664-y · Cited by 7
TAOK2 drives opposing cilia length deficits in 16p11.2 deletion and duplication carriers
Byeon, S., Ferreccio, A., Cornell, M., Osés-Prieto, J. A., Deshpande, A., Manvi, S., Blencowe, A., Weiss, L. A., Burlingame, A. L., & Yadav, S. (2025) · Stem Cell Reports · doi:10.1016/j.stemcr.2025.102608 · Cited by 7
Language and Communication Deficits in Chromosome 16p11.2 Deletion Syndrome
Jiménez-Romero, M. S., Fernández-Urquiza, M., & Benítez‐Burraco, A. (2022) · Journal of Speech Language and Hearing Research · doi:10.1044/2022_jslhr-22-00160 · Cited by 7
Effects of heterozygous deletion of autism-related gene Cullin-3 in mice
Xia, Q., Walker, A. K., Song, C., Wang, J., Singh, A., Mobley, J. A., Xuan, Z., Singer, J. D., & Powell, C. M. (2023) · PLoS ONE · doi:10.1371/journal.pone.0283299 · Cited by 6
Targeted Exome Sequencing of Genes Involved in Rare CNVs in Early-Onset Severe Obesity
Loid, P., Pekkinen, M., Mustila, T., Tossavainen, P. H., Viljakainen, H. T., Lindstrand, A., & Mäkitie, O. (2022) · Frontiers in Genetics · doi:10.3389/fgene.2022.839349 · Cited by 5
Han, J. Y., Cho, Y. G., Jo, D. S., & Park, J. (2023) · International Journal of Molecular Sciences · doi:10.3390/ijms25010253 · Cited by 5
Thom, R. P., Warren, T. L., Khan, S., Muhle, R., Wang, P. P., Brennand, K., Zürcher, N. R., Veenstra-VanderWeele, J. M., & Hoffman, E. J. (2025) · Journal of Child and Adolescent Psychopharmacology · doi:10.1089/cap.2025.0023 · Cited by 5
Dubois, A. E. E., Audet-Duchesne, E., Knoth, I. S., Martin, C.-O., Jizi, K., Tamer, P., Younis, N., Jacquemont, S., Dumas, G., & Lippé, S. (2025) · Translational Psychiatry · doi:10.1038/s41398-025-03324-4 · Cited by 5
Self-citationPediatric Obesity: Endocrinologic and Genetic Etiologies and Management
Gowda, S. H., Seibert, T. S., Uli, N. K., & Farrell, R. (2019) · Current Cardiovascular Risk Reports · doi:10.1007/s12170-019-0632-y · Cited by 6
Metadata
- Authors
- Zufferey, F., Sherr, E. H., Beckmann, N. D., Hanson, E., Maillard, A. M., Hippolyte, L., Macé, A., Ferrari, C., Kutalik, Z., Andrieux, J., Aylward, E., Barker, M., Bernier, R., Bouquillon, S., Conus, P., Delobel, B., Faucett, W. A., Goin-Kochel, R. P., Grant, E., Harewood, L., Hunter, J. V., Lebon, S., Ledbetter, D. H., Martin, C. L., Männik, K., Martinet, D., Mukherjee, P., Ramocki, M. B., Spence, S. J., Steinman, K. J., Tjernagel, J., Spiro, J. E., Reymond, A., Beckmann, J. S., Chung, W. K., Jacquemont, S., on behalf of the Simons VIP Consortium, & on behalf of the 16p11.2 European Consortium
- Affiliations
- Centre Hospitalier Universitaire Vaudois (CH)
- University of California, San Francisco (US)
- Boston Children's Hospital (US)
- SIB Swiss Institute of Bioinformatics (CH)
- Centre Hospitalier Universitaire de Lille (FR)
- Seattle Children's Research Institute (US)
- University of Washington (US)
- Groupe Hospitalier de l'Institut Catholique de Lille (FR)
- Geisinger Medical Center (US)
- Department of Pediatrics, Psychology Section, Baylor College of Medicine, Houston, Texas, USA
- Department of Radiology, Boston Children's Hospital, Harvard Medical School, Boston, Massachusetts, USA
- University of Lausanne (CH)
- Baylor College of Medicine (US)
- Emory University (US)
- Simons Foundation (US)
- Columbia University Irving Medical Center (US)
- Corresponding author
- Chung, Wendy K
- ORCID
- Sherr, Elliott H
- Beckmann, Noam D
- Hanson, Ellen
- Maillard, Anne M
- Macé, Aurélien
- Kutalik, Zoltán
- Aylward, Elizabeth
- Bernier, Raphael
- Conus, Philippe
- Faucett, W Andrew
- Harewood, Louise
- Hunter, Jill V
- Lebon, Sébastien
- Ledbetter, David H
- Mukherjee, Pratik
- Spence, Sarah J
- Steinman, Kyle J
- Spiro, John E
- Reymond, Alexandre
- Beckmann, Jacques S
- Chung, Wendy K
- Jacquemont, Sébastien
- Venue
- Journal of Medical Genetics
- Publisher
- BMJ
- Published
- 2012-10
- Volume
- 49
- Issue
- 10
- Pages
- 660-668
- ISSN
- 0022-2593 (ISSN-L)
- 1468-6244
- PMC
- PMC3494011
- OpenAlex
- W2117381227
- Cited by
- 326
- References
- 55
- Citations by year
- 2026: 7 · 2025: 12 · 2024: 28 · 2023: 18 · 2022: 22 · 2021: 21 · 2020: 24 · 2019: 25 · 2018: 53 · 2017: 25 · 2016: 20 · 2015: 26 · 2014: 29 · 2013: 15
- FWCI
- 13.27
- Type
- journal article
- Language
- en
- Update notices
- correction (2014-07-01)
- Open access
- hybrid
- doi.org
- Licence
- cc-by-nc
- Locations
- Journal of Medical Genetics (publishedVersion, cc-by-nc)
- Europe PMC (PubMed Central) (publishedVersion, cc-by-nc)
- PubMed Central (publishedVersion, cc-by-nc)
- PubMed (publishedVersion)
- SERVAL (Université de Lausanne) (publishedVersion, cc-by)
- IRIS (submittedVersion, cc-by)
- Minerva Access (University of Melbourne) (submittedVersion, cc-by-nc)
- Use Siena air (University of Siena) (submittedVersion, cc-by-nc)
- Digital Access to Scholarship at Harvard (DASH) (Harvard University) (submittedVersion, cc-by)
- Data Archiving and Networked Services (DANS) (submittedVersion)
- HAL (submittedVersion)
- BORIS (University Library Bern) (submittedVersion)
- eScholarship (California Digital Library) (submittedVersion)
- eScholarship (California Digital Library) (submittedVersion, cc-by-nc)
- Research Portal (Queen's University Belfast) (submittedVersion)
- SERVAL (Université de Lausanne) (submittedVersion)
- Funders
- National Science Foundation
- Simons Foundation
- Simons Foundation Autism Research Initiative
- European Commission
- Schweizerischer Nationalfonds zur Förderung der Wissenschaftlichen Forschung
- Fondation Leenaards
- Université de Lausanne
- European Regional Development Fund
- National Institute of Diabetes and Digestive and Kidney Diseases (R01DK052431)
- Topics
- Life Sciences › Biochemistry, Genetics and Molecular Biology › Genetics › Genomic variations and chromosomal abnormalities
- Life Sciences › Biochemistry, Genetics and Molecular Biology › Genetics › Genetics and Neurodevelopmental Disorders
- Life Sciences › Neuroscience › Cognitive Neuroscience › Autism Spectrum Disorder Research
- Keywords
- 16p11.2 deletion syndrome, autism spectrum disorder, neuropsychiatric disorders, intellectual disability, obesity, seizures, head circumference, energy imbalance, neurodevelopmental disorders, rare variants, phenotypic characterization
- MeSH terms
- Adolescent, Adult, Child, Developmental Disabilities, Child Development Disorders, Pervasive, Chromosome Deletion, Chromosomes, Human, Pair 16, Female, Heterozygote, Humans, Intelligence Tests, Male, Phenotype, Syndrome, Body Mass Index, Gene Order, Young Adult
About these checks
Registry, retraction, Cites and statistics results are computed, not judged, with one exception: a printed reference that no index lists is read once by a model before it counts as a citation error. Claims are extracted by a model and kept only when their quote appears verbatim in the text; each cited source is then checked, with a model’s help, for whether it says what the claim relies on. Those verdicts can be wrong — read the claim’s quote and the cited source before relying on one.
Statistics and arithmetic are recomputed, not judged.
Confidence bands are shown only for fields calibrated on our annotated test set. None is calibrated yet, so no band is shown.
What counts as a claim ›How we measure confidence ›How we check this ›
Are you an author, or do you see a problem with this page? Request a review
