

The DOI matches its Crossref record; 41 of the 41 references it cites were found in a registry or an index.
Quantifying echo chamber effects in information spreading over political communication networks
Open accessAbstract
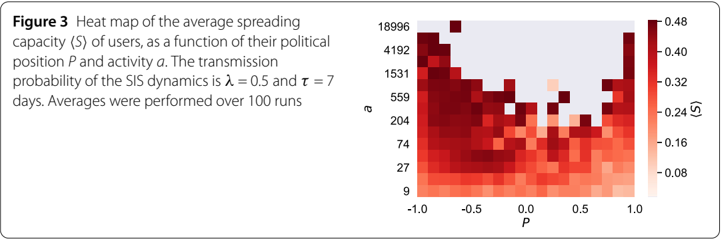
Echo chambers in online social networks, in which users prefer to interact only with ideologically-aligned peers, are believed to facilitate misinformation spreading and contribute to radicalize political discourse. In this paper, we gauge the effects of echo chambers in information spreading phenomena over political communication networks. Mining 12 million Twitter messages, we reconstruct a network in which users interchange opinions related to the impeachment of the former Brazilian President Dilma Rousseff. We define a continuous political leaning parameter, independent of the network’s structure, that allows to quantify the presence of echo chambers in the strongly connected component of the network. These are reflected in two well-separated communities of similar sizes with opposite views of the impeachment process. By means of simple spreading models, we show that the capability of users in propagating the content they produce, measured by the associated spreading capacity, strongly depends on their attitude. Users expressing pro-impeachment leanings are capable to transmit information, on average, to a larger audience than users expressing anti-impeachment leanings. Furthermore, the users’ spreading capacity is correlated to the diversity, in terms of political position, of the audience reached. Our method can be exploited to identify the presence of echo chambers and their effects across different contexts and shed light upon the mechanisms allowing to break echo chambers.
Overview
The claims and statistics of this paper haven’t been checked yet.
Run the check — free, no account needed. It reads the open-access text and checks the sources it cites.
Integrity signals
Registry
Cites
Statistics
Figures



Verification
Claims the paper makes
The claims and statistics of this paper haven’t been checked yet.
Run the check — free, no account needed. It reads the open-access text and checks the sources it cites.
Claims other papers make about this one
Each is checked against this paper’s own text: does it say what the citing paper says it does?
The cited source says what the claim attributes to it.
In the citing paper
“Furthermore, users show a tendency to favor information adhering to their beliefs and join groups formed around a shared narrative, that is, echo chambers (1, 14–18).”
From The echo chamber effect on social media (2021) · cites this paper as [18]
The cited source says what the claim attributes to it.
In the citing paper
“Simple models of information spreading can gauge the presence of echo chambers: Users are expected to be more likely to exchange information with peers sharing a similar leaning (18, 42, 43).”
From The echo chamber effect on social media (2021) · cites this paper as [18]
The cited source says what the claim attributes to it.
In the citing paper
“Echo chambers have been quantified in several controversial debates on different social media platforms [2, 16, 17] and may be related to the spread of misinformation [18].”
From Modeling echo chambers and polarization dynamics in social networks (2020) · cites this paper as [16]
The cited source says what the claim attributes to it.
In the citing paper
“In network terms, this translates into a node i with a given leaning xi more likely to be connected with nodes with a leaning close to xi (18).”
From The echo chamber effect on social media (2021) · cites this paper as [18]
The cited source says what the claim attributes to it.
In the citing paper
“On the other hand, when considering social networks and the impact of digital media on homophilic structures, the literature contains consistent reports of ideologically homogeneous social clusters147–151.”
From A systematic review of worldwide causal and correlational evidence on digital media and democracy (2022) · cites this paper as [149]
2 more claims about this paper
Create a free account to see every claim other papers make about this one.
Self-check
Percentages, sums and reported differences re-computed from the paper’s own numbers.
The self-check needs the paper’s full text.
Citations
Cites
Fast unfolding of communities in large networks
Blondel, V. D., Guillaume, J.-L., Lambiotte, R., & Lefebvre, E. (2008) · Journal of Statistical Mechanics: Theory and Experiment · doi:10.1088/1742-5468/2008/10/p10008 · Cited by 21,424
Social Network Analysis: Methods and Applications
Wasserman, S., & Faust, K. (1994) · doi:10.1017/cbo9780511815478 · Cited by 17,557
Fortunato, S. (2010) · Physics Reports · doi:10.1016/j.physrep.2009.11.002 · Cited by 11,293
Newman, M. (2010) · doi:10.1093/acprof:oso/9780199206650.001.0001 · Cited by 6,595
Lazer, D., Pentland, A., Adamic, L., Aral, S., Barabási, A.-L., Brewer, D., Christakis, N., Contractor, N., Fowler, J., Gutmann, M., et al. (2009) · Science · doi:10.1126/science.1167742 · Cited by 3,365
A simple model of global cascades on random networks
Watts, D. J. (2002) · Proceedings of the National Academy of Sciences · doi:10.1073/pnas.082090499 · Cited by 2,673
A 61-million-person experiment in social influence and political mobilization
Bond, R. M., Fariss, C. J., Jones, J. J., Kramer, A. D. I., Marlow, C., Settle, J. E., & Fowler, J. H. (2012) · Nature · doi:10.1038/nature11421 · Cited by 2,575
The spreading of misinformation online
Del Vicario, M., Bessi, A., Zollo, F., Petroni, F., Scala, A., Caldarelli, G., Stanley, H. E., & Quattrociocchi, W. (2016) · Proceedings of the National Academy of Sciences · doi:10.1073/pnas.1517441113 · Cited by 2,407
Ferrara, E., Varol, O., Davis, C., Menczer, F., & Flammini, A. (2016) · Communications of the ACM · doi:10.1145/2818717 · Cited by 1,973
Network structure and minimum degree
Seidman, S. B. (1983) · Social Networks · doi:10.1016/0378-8733(83)90028-x · Cited by 1,891
Research works printed but not linked: 8
- Masum H, Newmark C, Tovey M (2011) The reputation society: how online opinions are reshaping the offline world. Information society series. MIT Press, Cambridge
- Borge-Holthoefer J, Magdy W, Darwish K, Weber I (2015) Content and network dynamics behind Egyptian political polarization on Twitter. In: Proceedings of the 18th ACM conference on computer supported cooperative work & social computing, CSCW 2015, Vancouver, BC, Canada, March 14–18, 2015, pp 700–711
- Lambiotte R, Masuda N (2016) A guide to temporal networks. Series on complexity science, vol 4. World Scientific, Singapore
- Galuba W, Aberer K, Chakraborty D, Despotovic Z, Kellerer W (2010) Outtweeting the Twitterers—predicting information cascades in microblogs. In: Proceedings of the 3rd wonference on online social networks, WOSN’10. USENIX Association, Berkeley, pp 3–3
- Holme P, Saramäki J (eds) (2013) Temporal networks. Springer, Berlin
- Anderson RM, May RM (1992) Infectious diseases in humans. Oxford University Press, Oxford
- Conover M, Gonçalves B, Ratkiewicz J, Flammini A, Menczer F (2011) Predicting the political alignment of Twitter users. In: Proceedings of 3rd IEEE conference on social computing (SocialCom), pp 192–199
- Saito K, Nakano R, Kimura M (2008) Prediction of information diffusion probabilities for independent cascade model. In: Proceedings of the 12th international conference on knowledge-based intelligent information and engineering systems, part III, KES ’08. Springer, Berlin, pp 67–75
Cited by
The echo chamber effect on social media
Cinelli, M., De Francisci Morales, G., Galeazzi, A., Quattrociocchi, W., & Starnini, M. (2021) · Proceedings of the National Academy of Sciences · doi:10.1073/pnas.2023301118 · Cited by 2,092
“Simple models of information spreading can gauge the presence of echo chambers: Users are expected to be more likely to exchange information with peers sharing a similar leaning (18, 42, 43).”
BackgroundSelf-citationModeling echo chambers and polarization dynamics in social networks
Baumann, F., Lorenz-Spreen, P., Sokolov, I. M., & Starnini, M. (2020) · Physical Review Letters · doi:10.1103/physrevlett.124.048301 · Cited by 427
Self-citationA systematic review of worldwide causal and correlational evidence on digital media and democracy
Lorenz-Spreen, P., Oswald, L., Lewandowsky, S., & Hertwig, R. (2022) · Nature Human Behaviour · doi:10.1038/s41562-022-01460-1 · Cited by 348
How behavioural sciences can promote truth, autonomy and democratic discourse online
Lorenz-Spreen, P., Lewandowsky, S., Sunstein, C. R., & Hertwig, R. (2020) · Nature Human Behaviour · doi:10.1038/s41562-020-0889-7 · Cited by 223
Persistent interaction patterns across social media platforms and over time
Avalle, M., Marco, N. D., Etta, G., Sangiorgio, E., Alipour, S., Bonetti, A., Alvisi, L., Scala, A., Baronchelli, A., Cinelli, M., et al. (2024) · Nature · doi:10.1038/s41586-024-07229-y · Cited by 170
Metadata
- Authors
- Cota, W., Ferreira, S. C., Pastor-Satorras, R., & Starnini, M.
- Affiliations
- Universidade Federal de Viçosa (BR)
- Institute for Scientific Interchange (IT)
- Corresponding author
- Starnini, Michele
- Venue
- EPJ Data Science
- Published
- 2019-12
- Volume
- 8
- Issue
- 1
- ISSN
- 2193-1127 (ISSN-L)
- OpenAlex
- W2909429265
- Cited by
- 146
- References
- 40
- Citations by year
- 2026: 15 · 2025: 26 · 2024: 26 · 2023: 31 · 2022: 29 · 2021: 13 · 2020: 5 · 2019: 1
- FWCI
- 5.55
- Type
- journal article
- Language
- en
- Open access
- gold
- doi.org
- Licence
- cc-by
- creativecommons.org/licenses/by/4.0 (tdm)
- creativecommons.org/licenses/by/4.0 (vor, 8 d)
- Locations
- EPJ Data Science (publishedVersion, cc-by)
- Repositori digital de la UPF (Universitat Pompeu Fabra) (publishedVersion, cc-by)
- arXiv (Cornell University) (submittedVersion)
- DOAJ (DOAJ: Directory of Open Access Journals) (submittedVersion)
- UPCommons institutional repository (Universitat Politècnica de Catalunya) (submittedVersion, cc-by-nc-nd)
- arXiv (Cornell University)
- Funders
- James S. McDonnell Foundation
- Coordenação de Aperfeiçoamento de Pessoal de Nível Superior (88881, 2013‐01, (Code 001), 88881.030375/2013-01)
- Generalitat de Catalunya
- Conselho Nacional de Desenvolvimento Científico e Tecnológico (88881)
- Institució Catalana de Recerca i Estudis Avançats
- Fundação de Amparo à Pesquisa do Estado de Minas Gerais (Code 001, 88881.030375/2013-01)
- Ciência sem Fronteiras
- Topics
- Physical Sciences › Physics and Astronomy › Statistical and Nonlinear Physics › Complex Network Analysis Techniques
- Social Sciences › Communication › Social Media and Politics
- Social Sciences › Sociology and Political Science › Misinformation and Its Impacts
- Keywords
- echo chambers, information dissemination, Twitter, misinformation, ideological polarization, political orientation, Dilma Rousseff impeachment, social network reconstruction, spreading models
About these checks
Registry, retraction, Cites and statistics results are computed, not judged, with one exception: a printed reference that no index lists is read once by a model before it counts as a citation error. Claims are extracted by a model and kept only when their quote appears verbatim in the text; each cited source is then checked, with a model’s help, for whether it says what the claim relies on. Those verdicts can be wrong — read the claim’s quote and the cited source before relying on one.
Statistics and arithmetic are recomputed, not judged.
Confidence bands are shown only for fields calibrated on our annotated test set. None is calibrated yet, so no band is shown.
What counts as a claim ›How we measure confidence ›How we check this ›
Are you an author, or do you see a problem with this page? Request a review
How to cite
Cite CoChat for the checks on this page, and the paper for its own findings.
- This page
- CoChat. (2026). Citation check: Quantifying echo chamber effects in information spreading over political communication networks. https://app.cochat.ai/papers/10.1140/epjds/s13688-019-0213-9
- The paper
- Cota, W., Ferreira, S. C., Pastor-Satorras, R., & Starnini, M. (2019). Quantifying echo chamber effects in information spreading over political communication networks. EPJ Data Science. https://doi.org/10.1140/epjds/s13688-019-0213-9
Data sources
Bibliographic data: Semantic Scholar, OpenAlex, Crossref.
Contains information from the Semantic Scholar Academic Graph Datasets, made available under the ODC Attribution License (ODC-BY 1.0).
Semantic Scholar’s data is described in: Kinney, R., et al. (2023). The Semantic Scholar Open Data Platform. arXiv:2301.10140.
