

Understanding and Visualizing Data Iteration in Machine Learning
Open accessThe DOI matches its Crossref record; 50 of the 50 references it cites were found in a registry or an index.
Abstract
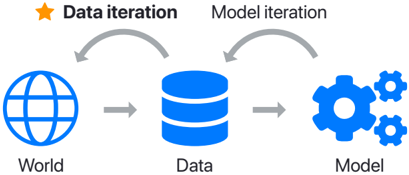
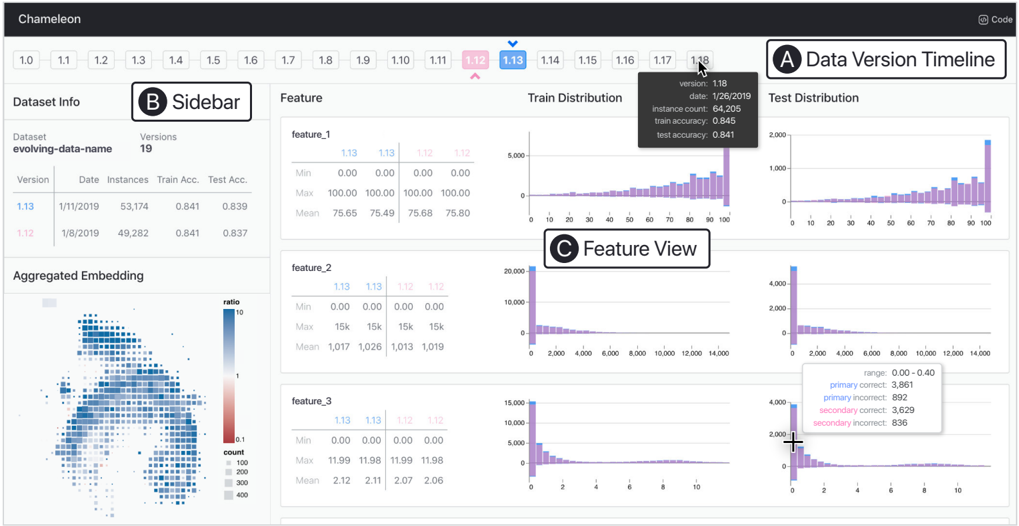
Successful machine learning (ML) applications require iterations on both modeling and the underlying data. While prior visualization tools for ML primarily focus on modeling, our interviews with 23 ML practitioners reveal that they improve model performance frequently by iterating on their data (e.g., collecting new data, adding labels) rather than their models. We also identify common types of data iterations and associated analysis tasks and challenges. To help attribute data iterations to model performance, we design a collection of interactive visualizations and integrate them into a prototype, Chameleon, that lets users compare data features, training/testing splits, and performance across data versions. We present two case studies where developers apply \system to their own evolving datasets on production ML projects. Our interface helps them verify data collection efforts, find failure cases stretching across data versions, capture data processing changes that impacted performance, and identify opportunities for future data iterations.
Overview
The claims and statistics of this paper haven’t been checked yet.
Free: it reads the open-access text and checks the first 5 claims that cite a source we can check. Create a free account to check every claim.
Integrity signals
Registry
Cites
Statistics
Figures

Verification
Claims the paper makes
The claims and statistics of this paper haven’t been checked yet.
Free: it reads the open-access text and checks the first 5 claims that cite a source we can check. Create a free account to check every claim.
Self-check
Percentages, sums and reported differences re-computed from the paper’s own numbers.
The self-check needs the paper’s full text.
Citations
Cites
(2008) · Journal of Machine Learning Research · Cited by 33,051
David, F. N., & Tukey, J. W. (1977) · Biometrics · doi:10.2307/2529486 · Cited by 12,708 · cited 1×
“During exploratory data analysis [43, 14], users may be unfamiliar with their resources (e.g., data), uncertain of their goals, and unsure how to reach them.”
BackgroundTensorFlow: Large-Scale Machine Learning on Heterogeneous Distributed Systems
Abadi, M., Agarwal, A., Barham, P., Brevdo, E., Chen, Z., Citro, C., Corrado, G. S., Davis, A., Dean, J., Devin, M., et al. (2016) · arXiv · doi:10.48550/arxiv.1603.04467 · Cited by 9,408
UMAP: Uniform Manifold Approximation and Projection for Dimension Reduction
McInnes, L., Healy, J., & Melville, J. (2018) · arXiv · doi:10.48550/arxiv.1802.03426 · Cited by 7,101 · cited 2×
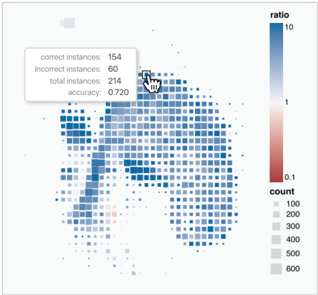
“For reduction and visualization, the Aggregated Embedding uses UMAP [26]: a non-linear dimensionality reduction that better preserves global data structure compared to other techniques like t-SNE [25].”
MethodLarge Scale Distributed Deep Networks
Dean, J. B., Corrado, G. S., Monga, R., Chen, K., Devin, M., Mao, M., Ranzato, M., Senior, A., Tucker, P. A., Yang, K., et al. (2012) · neural information processing systems · Cited by 4,489
Software Engineering for Machine Learning: A Case Study
Amershi, S., Begel, A., Bird, C., DeLine, R., Gall, H., Kamar, E., Nagappan, N., Nushi, B., & Zimmermann, T. (2019) · 2019 IEEE/ACM 41st International Conference on Software Engineering: Software Engineering in Practice (ICSE-SEIP) · doi:10.1109/icse-seip.2019.00042 · Cited by 1,135 · cited 1×
“A recent study of ML industry professionals found that “discovering, managing, and versioning the data needed for machine learning applications is much more complex and difficult than other types of software engi-neering” [3].”
BackgroundPower to the People: The Role of Humans in Interactive Machine Learning
Amershi, S., Cakmak, M., Knox, W. B., & Kulesza, T. (2014) · AI Magazine · doi:10.1609/aimag.v35i4.2513 · Cited by 1,084 · cited 3×
“Successful machine learning (ML) applications require an iterative process to create models that deliver desired performance and user experience [4, 38].”
BackgroundA Survey on Data Collection for Machine Learning: A Big Data - AI Integration Perspective
Roh, Y., Heo, G., & Whang, S. E. (2021) · IEEE Transactions on Knowledge and Data Engineering · doi:10.1109/tkde.2019.2946162 · Cited by 968 · cited 4×
“This is corroborated in prior data collection work [35].”
BackgroundResultInfluentialFaceted metadata for image search and browsing
Yee, K.-P., Swearingen, K., Li, K., & Hearst, M. (2003) · Proceedings of the SIGCHI Conference on Human Factors in Computing Systems · doi:10.1145/642611.642681 · Cited by 898 · cited 1×
“Faceted browsing [47] lets users use metadata to filter subsets of data that share desired properties.”
BackgroundVega-Lite: A Grammar of Interactive Graphics
Satyanarayan, A., Moritz, D., Wongsuphasawat, K., & Heer, J. (2017) · IEEE Transactions on Visualization and Computer Graphics · doi:10.1109/tvcg.2016.2599030 · Cited by 883 · cited 1×
“Visual-izations were constructed and rendered using Vega-Lite [37].”
MethodSelf-citationSnorkel: rapid training data creation with weak supervision
Ratner, A., Bach, S. H., Ehrenberg, H., Fries, J., Wu, S., & Ré, C. (2017) · Proceedings of the VLDB Endowment · doi:10.14778/3157794.3157797 · Cited by 777 · cited 1×
“…Probabilistic Labels from Data Programming As data programming, weakly-supervised probabilistic label generation for large sets of unlabeled data [32, 33], becomes more popular and is used as an alternative to expensive data labeling tasks, it is important to know when and how label updates are…”
BackgroundDuke, D., & Scopigno, R. (2003) · Computer Graphics Forum · doi:10.1111/j.1467-8659.2003.00715.x · Cited by 769
Fails, J. A., & Olsen, D. R. (2003) · Proceedings of the 8th international conference on Intelligent user interfaces · doi:10.1145/604045.604056 · Cited by 633 · cited 1×
“Within the human-computer interaction and visualization communities, interactive machine learning and human-in-the-loop research often contributes new systems and interaction techniques to help model developers compare, evaluate, and understand models [4, 11, 40, 46].”
BackgroundVisual Analytics in Deep Learning: An Interrogative Survey for the Next Frontiers
Hohman, F., Kahng, M., Pienta, R., & Chau, D. H. (2019) · IEEE Transactions on Visualization and Computer Graphics · doi:10.1109/tvcg.2018.2843369 · Cited by 582
Self-citationDemystifying Parallel and Distributed Deep Learning: An In-depth Concurrency Analysis
Ben-Nun, T., & Hoefler, T. (2020) · ACM Computing Surveys · doi:10.1145/3320060 · Cited by 577 · cited 1×
“ML systems research supports more efficient and distributed training of multiples models simultaneously [2, 8, 10], and automated machine learning (AutoML) systems spawn hundreds of models at once and apply end-to-end model selection and training so that users need only input their data [12, 31].”
BackgroundSnorkel: rapid training data creation with weak supervision
Ratner, A., Bach, S. H., Ehrenberg, H., Fries, J., Wu, S., & Ré, C. (2020) · The VLDB Journal · doi:10.1007/s00778-019-00552-1 · Cited by 510
Voyager: Exploratory Analysis via Faceted Browsing of Visualization Recommendations
Wongsuphasawat, K., Moritz, D., Anand, A., Mackinlay, J., Howe, B., & Heer, J. (2016) · IEEE Transactions on Visualization and Computer Graphics · doi:10.1109/tvcg.2015.2467191 · Cited by 507 · cited 1×
“Voyager [44, 45]”
Self-citationA Survey on Metric Learning for Feature Vectors and Structured Data
Bellet, A., Habrard, A., & Sebban, M. (2013) · arXiv (Cornell University) · doi:10.48550/arxiv.1306.6709 · Cited by 494 · cited 2×
“AML5 also said they have implemented automatic methods to detect data drift [6, 7], which act as “good sanity checks” during development.”
MethodInteractive dynamics for visual analysis
Heer, J., & Shneiderman, B. (2012) · Communications of the ACM · doi:10.1145/2133806.2133821 · Cited by 474 · cited 1×
“During exploratory data analysis [43, 14], users may be unfamiliar with their resources (e.g., data), uncertain of their goals, and unsure how to reach them.”
BackgroundThematic Coding and Categorizing
(2007) · Analyzing Qualitative Data · doi:10.4135/9781849208574.n4 · Cited by 464 · cited 1×
“From the interview data, we used a thematic analysis method to group common purposes, practices, and challenges of data iteration into categories [13].”
MethodData Programming: Creating Large Training Sets, Quickly
Ratner, A., De, C., Wu, S., Selsam, D., & Ré, C. (2016) · arXiv (Cornell University) · doi:10.48550/arxiv.1605.07723 · Cited by 350 · cited 1×
“…Labels from Data Programming As data programming, weakly-supervised probabilistic label generation for large sets of unlabeled data [32, 33], becomes more popular and is used as an alternative to expensive data labeling tasks, it is important to know when and how label updates are made…”
BackgroundActiVis: Visual Exploration of Industry-Scale Deep Neural Network Models
Kahng, M., Andrews, P. Y., Kalro, A., & Chau, D. H. (2018) · IEEE Transactions on Visualization and Computer Graphics · doi:10.1109/tvcg.2017.2744718 · Cited by 337
Visualizing Dataflow Graphs of Deep Learning Models in TensorFlow
Wongsuphasawat, K., Smilkov, D., Wexler, J., Wilson, J., Mane, D., Fritz, D., Krishnan, D., Viegas, F. B., & Wattenberg, M. (2018) · IEEE Transactions on Visualization and Computer Graphics · doi:10.1109/tvcg.2017.2744878 · Cited by 331 · cited 1×
“Within the human-computer interaction and visualization communities, interactive machine learning and human-in-the-loop research often contributes new systems and interaction techniques to help model developers compare, evaluate, and understand models [4, 11, 40, 46].”
BackgroundSelf-citationVoyager 2: Augmenting Visual Analysis with Partial View Specifications
Wongsuphasawat, K., Qu, Z., Moritz, D., Chang, R., Ouk, F., Anand, A., Mackinlay, J., Howe, B., & Heer, J. (2017) · Proceedings of the 2017 CHI Conference on Human Factors in Computing Systems · doi:10.1145/3025453.3025768 · Cited by 295
Self-citationHeer, J., & Shneiderman, B. (2012) · Queue · doi:10.1145/2133416.2146416 · Cited by 269
ModelTracker: Redesigning Performance Analysis Tools for Machine Learning
Amershi, S., Chickering, M., Drucker, S. M., Lee, B., Simard, P., & Suh, J. (2015) · Proceedings of the 33rd Annual ACM Conference on Human Factors in Computing Systems · doi:10.1145/2702123.2702509 · Cited by 262 · cited 2×
“As seen in prior work [5, 34], there are many ways to facet each feature.”
BackgroundMethodAutomated Machine Learning: From Principles to Practices
Shen, Z., Zhang, Y., Wei, L., Zhao, H., & Yao, Q. (2018) · arXiv (Cornell University) · doi:10.48550/arxiv.1810.13306 · Cited by 241
Profiler: integrated statistical analysis and visualization for data quality assessment
Kandel, S., Parikh, R., Paepcke, A., Hellerstein, J. M., & Heer, J. (2012) · Proceedings of the International Working Conference on Advanced Visual Interfaces · doi:10.1145/2254556.2254659 · Cited by 220 · cited 1×
“Profiler [18] uses data mining methods to automatically flag problematic data to help people assess data quality.”
MethodManifold: A Model-Agnostic Framework for Interpretation and Diagnosis of Machine Learning Models
Zhang, J., Wang, Y., Molino, P., Li, L., & Ebert, D. S. (2019) · IEEE Transactions on Visualization and Computer Graphics · doi:10.1109/tvcg.2018.2864499 · Cited by 220 · cited 1×
“Visual analytics has since succeeded in supporting machine learning model developers with a variety of modeling tasks [15, 23, 24, 36], such as model comparison [48] and diagnosis [19].”
Machine Learning: The High Interest Credit Card of Technical Debt
Sculley, D., Holt, G. D., Golovin, D., Davydov, E. V., Phillips, T., Ebner, D., Chaudhary, V., & Young, M. (2014) · Cited by 218
Data Management Challenges in Production Machine Learning
Polyzotis, N., Roy, S., Whang, S. E., & Zinkevich, M. (2017) · Proceedings of the 2017 ACM International Conference on Management of Data · doi:10.1145/3035918.3054782 · Cited by 208 · cited 1×
“Other work from the database community agrees that ML pipelines struggle with data understanding, validation, cleaning, and enrichment [30].”
BackgroundSquares: Supporting Interactive Performance Analysis for Multiclass Classifiers
Ren, D., Amershi, S., Lee, B., Suh, J., & Williams, J. D. (2017) · IEEE Transactions on Visualization and Computer Graphics · doi:10.1109/tvcg.2016.2598828 · Cited by 200 · cited 2×
“As seen in prior work [5, 34], there are many ways to facet each feature.”
BackgroundA Rank-by-Feature Framework for Interactive Exploration of Multidimensional Data
Seo, J., & Shneiderman, B. (2005) · Information Visualization · doi:10.1057/palgrave.ivs.9500091 · Cited by 199 · cited 1×
“The rank-by-feature framework [39] allows users to examine low dimensional projections of high-dimensional data based on their statistics.”
BackgroundInteracting meaningfully with machine learning systems: Three experiments
Stumpf, S., Rajaram, V., Li, L., Wong, W.-K., Burnett, M., Dietterich, T., Sullivan, E., & Herlocker, J. (2009) · International Journal of Human-Computer Studies · doi:10.1016/j.ijhcs.2009.03.004 · Cited by 184 · cited 1×
“Previous work demonstrates that interaction between people and machine learning systems enables collaboratively sharing intelligence [41].”
BackgroundINFUSE: Interactive Feature Selection for Predictive Modeling of High Dimensional Data
Krause, J., Perer, A., & Bertini, E. (2014) · IEEE Transactions on Visualization and Computer Graphics · doi:10.1109/tvcg.2014.2346482 · Cited by 169 · cited 2×
“Closer to our work are FeatureInsight and INFUSE, two systems that focus on improving feature ideation and selection using visual summaries [9, 20].”
BackgroundMethodWhat you see is what you can change: Human-centered machine learning by interactive visualization
Sacha, D., Sedlmair, M., Zhang, L., Lee, J. A., Peltonen, J., Weiskopf, D., North, S. C., & Keim, D. A. (2017) · Neurocomputing · doi:10.1016/j.neucom.2017.01.105 · Cited by 164
A survey on feature drift adaptation: Definition, benchmark, challenges and future directions
Barddal, J. P., Gomes, H. M., Enembreck, F., & Pfahringer, B. (2016) · Journal of Systems and Software · doi:10.1016/j.jss.2016.07.005 · Cited by 151
Interactive optimization for steering machine classification
Kapoor, A., Lee, B., Tan, D., & Horvitz, E. (2010) · Proceedings of the SIGCHI Conference on Human Factors in Computing Systems · doi:10.1145/1753326.1753529 · Cited by 133 · cited 1×
“Visual analytics has since succeeded in supporting machine learning model developers with a variety of modeling tasks [15, 23, 24, 36], such as model comparison [48] and diagnosis [19].”
Investigating statistical machine learning as a tool for software development
Patel, K., Fogarty, J., Landay, J. A., & Harrison, B. (2008) · Proceedings of the SIGCHI Conference on Human Factors in Computing Systems · doi:10.1145/1357054.1357160 · Cited by 129 · cited 2×
“These unique challenges also impact software development for machine learning [29].”
BackgroundSelf-citationThe State‐of‐the‐Art in Predictive Visual Analytics
Lu, Y., Garcia, R., Hansen, B., Gleicher, M., & Maciejewski, R. (2017) · Computer Graphics Forum · doi:10.1111/cgf.13210 · Cited by 97
FeatureInsight: Visual support for error-driven feature ideation in text classification
Brooks, M., Amershi, S., Lee, B., Drucker, S. M., Kapoor, A., & Simard, P. (2015) · 2015 IEEE Conference on Visual Analytics Science and Technology (VAST) · doi:10.1109/vast.2015.7347637 · Cited by 80 · cited 2×
“Closer to our work are FeatureInsight and INFUSE, two systems that focus on improving feature ideation and selection using visual summaries [9, 20].”
BackgroundMethodVisual exploration of machine learning results using data cube analysis
Kahng, M., Fang, D., & Chau, D. H. (. (2016) · Proceedings of the Workshop on Human-In-the-Loop Data Analytics · doi:10.1145/2939502.2939503 · Cited by 77 · cited 1×
“With respect to instance-level analysis, MLCube Explorer and Activis both enable interactive selection of instance subsets for model inspection and comparison [16, 17].”
MethodMachine Teaching: A New Paradigm for Building Machine Learning Systems
Simard, P. Y., Amershi, S., Chickering, D. M., Pelton, A. E., Ghorashi, S., Meek, C., Ramos, G., Suh, J., Verwey, J., Wang, M., et al. (2017) · arXiv (Cornell University) · doi:10.48550/arxiv.1707.06742 · Cited by 74 · cited 1×
“Within the human-computer interaction and visualization communities, interactive machine learning and human-in-the-loop research often contributes new systems and interaction techniques to help model developers compare, evaluate, and understand models [4, 11, 40, 46].”
BackgroundRecent progress and trends in predictive visual analytics
Lu, J., Chen, W., Ma, Y., Ke, J., Li, Z., Zhang, F., & Maciejewski, R. (2016) · Frontiers of Computer Science · doi:10.1007/s11704-016-6028-y · Cited by 70 · cited 1×
“Visual analytics has since succeeded in supporting machine learning model developers with a variety of modeling tasks [15, 23, 24, 36], such as model comparison [48] and diagnosis [19].”
An Interactive Method to Improve Crowdsourced Annotations
Liu, S., Chen, C., Lu, Y., Ouyang, F., & Wang, B. (2018) · IEEE Transactions on Visualization and Computer Graphics · doi:10.1109/tvcg.2018.2864843 · Cited by 69 · cited 1×
“Visualization has also supported other data-centered tasks in ML, such as ensuring data and annotation quality [21, 22].”
ResultSteering data quality with visual analytics: The complexity challenge
Liu, S., Andrienko, G., Wu, Y., Cao, N., Jiang, L., Shi, C., Wang, Y.-S., & Hong, S.-H. (2018) · Visual Informatics · doi:10.1016/j.visinf.2018.12.001 · Cited by 69 · cited 1×
“Visualization has also supported other data-centered tasks in ML, such as ensuring data and annotation quality [21, 22].”
ResultData Diff: Interpretable, Executable Summaries of Changes in Distributions for Data Wrangling
Sutton, C., Hobson, T., Geddes, J., & Caruana, R. (2018) · Proceedings of the 24th ACM SIGKDD International Conference on Knowledge Discovery & Data Mining · doi:10.1145/3219819.3220057 · Cited by 42 · cited 1×
“Many methods are developed to detect data drift [6, 7], while other work aims to compute a “data diff” to provide a concise, interpretable summary of the differences between two datasets [42].”
MethodUsing Multiple Models to Understand Data
Patel, K., Drucker, S. M., Fogarty, J. A., Kapoor, A., & Tan, D. S. (2012) · Cited by 31
Self-citationConolly, J., & Lake, M. (2006) · Cambridge University Press eBooks · doi:10.1017/cbo9780511807459.007 · Cited by 20
Lowering the barrier to applying machine learning
Patel, K. (2010) · Adjunct proceedings of the 23nd annual ACM symposium on User interface software and technology · doi:10.1145/1866218.1866222 · Cited by 18 · cited 3×
“During these iterations, model developers must be careful that only one component of the modeling process changes to ensure fair comparison between trained models [27].”
BackgroundInfluentialSelf-citation
Research works printed but not linked: 1
- 12. Matthias Feurer, Aaron Klein, Katharina Eggensperger, Jost Springenberg, Manuel Blum, and Frank Hutter. 2015. Efficient and robust automated machine learning. In Advances in Neural Information Processing Systems. 2962-2970.
Cited by
On the Opportunities and Risks of Foundation Models
Bommasani, R., Hudson, D. A., Adeli, E., Altman, R., Arora, S., von Arx, S., Bernstein, M. S., Bohg, J., Bosselut, A., Brunskill, E., et al. (2021) · arXiv · doi:10.48550/arxiv.2108.07258 · Cited by 2,676
“Everyone wants to do the model work, not the data work”: Data Cascades in High-Stakes AI
Sambasivan, N., Kapania, S., Highfill, H., Akrong, D., Paritosh, P., & Aroyo, L. M. (2021) · Proceedings of the 2021 CHI Conference on Human Factors in Computing Systems · doi:10.1145/3411764.3445518 · Cited by 781
“identified common types of data iterations and created a tool to visualise them [52].”
BackgroundMethodTrustworthy Artificial Intelligence: A Review
Kaur, D., Uslu, S., Rittichier, K. J., & Durresi, A. (2023) · ACM Computing Surveys · doi:10.1145/3491209 · Cited by 709
“Some researchers [89, 179, 182] proposed visualization techniques to better understand the data before using it.”
BackgroundTransfer Learning for Sentiment Analysis Using BERT Based Supervised Fine-Tuning
Prottasha, N. J., Sami, A. A., Kowsher, M., Murad, S. A., Bairagi, A. K., Masud, M., & Baz, M. (2022) · Sensors · doi:10.3390/s22114157 · Cited by 248
“Data preparation is essential in machine learning-based classification, as the model’s accuracy is heavily dependent on the quality of the input data [33].”
BackgroundTechnology readiness levels for machine learning systems
Lavin, A., Gilligan-Lee, C. M., Visnjic, A., Ganju, S., Newman, D., Ganguly, S., Lange, D., Baydin, A. G., Sharma, A., Gibson, A., et al. (2022) · Nature Communications · doi:10.1038/s41467-022-33128-9 · Cited by 209
“For instance, a more iterative process for Bayesian ML [60] and even more specifically for probabilistic programming [39], a data mining process defined in 2000 that remains widely used [61], others for describing data iterations [62], and human-computer interaction cycles [63].”
Metadata
- Authors
- Hohman, F., Wongsuphasawat, K., Kery, M. B., & Patel, K.
- Affiliations
- Georgia Institute of Technology (US)
- Apple (United States) (US)
- Carnegie Mellon University (US)
- Venue
- Proceedings of the 2020 CHI Conference on Human Factors in Computing Systems
- Publisher
- ACM
- Published
- 2020-04-21
- Pages
- 1-13
- OpenAlex
- W3032086959
- Semantic Scholar
- d6b9a5a2af3c2f9044c505855b27310132b7f3d4
- Cited by
- 110
- References
- 48
- Citations by year
- 2026: 5 · 2025: 16 · 2024: 24 · 2023: 19 · 2022: 19 · 2021: 22 · 2020: 5
- FWCI
- 5.01
- Type
- conference paper
- Language
- en
- Open access
- hybrid
- doi.org
- Licence
- Locations
- CHI Conference on Human Factors in Computing Systems (publishedVersion, cc-by)
- Topics
- Physical Sciences › Computer Science › Computer Graphics and Computer-Aided Design › Data Visualization and Analytics
- Physical Sciences › Computer Science › Information Systems › Software Engineering Research
- Social Sciences › Decision Sciences › Information Systems and Management › Scientific Computing and Data Management
- Keywords
- interactive visualization, data versioning, training-test split, data collection, data annotation, failure case analysis, machine learning in production
About these checks
Registry, retraction, Cites and statistics results are computed, not judged, with one exception: a printed reference that no index lists is read once by a model before it counts as a citation error. Claims are extracted by a model and kept only when their quote appears verbatim in the text; each cited source is then checked, with a model’s help, for whether it says what the claim relies on. Those verdicts can be wrong — read the claim’s quote and the cited source before relying on one.
Statistics and arithmetic are recomputed, not judged.
Confidence bands are shown only for fields calibrated on our annotated test set. None is calibrated yet, so no band is shown.
What counts as a claim ›How we measure confidence ›How we check this ›
Are you an author, or do you see a problem with this page? Request a review
Data sources
Bibliographic data: Semantic Scholar, OpenAlex, Crossref.
Contains information from the Semantic Scholar Academic Graph Datasets, made available under the ODC Attribution License (ODC-BY 1.0).
Semantic Scholar’s data is described in: Kinney, R., et al. (2023). The Semantic Scholar Open Data Platform. arXiv:2301.10140.
