Cited by 3Cancer, Hypoxia, and MetabolismCancer, Lipids, and MetabolismMetabolism, Diabetes, and Cancer

The DOI matches its Crossref record; 10 of the 10 references it cites were found in a registry or an index.

A Citrate Synthase Splice Variant Rewires the TCA Cycle to Promote Colorectal Cancer Progression

Open access

Published version of a preprint

Abstract

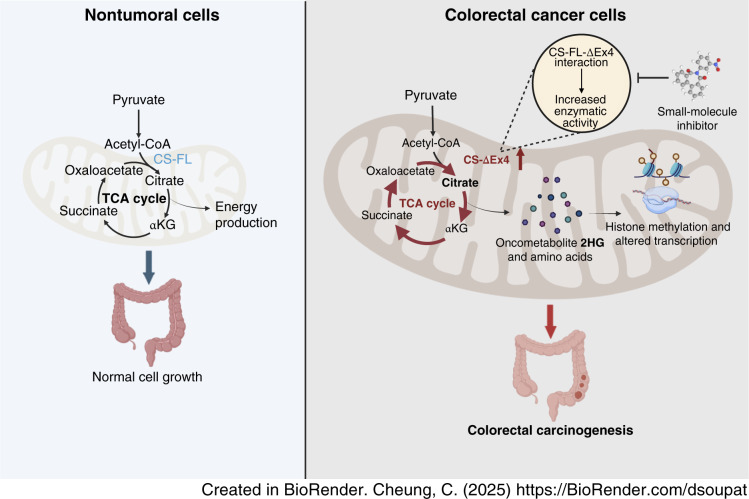
Metabolic reprogramming, notably alterations in the tricarboxylic acid (TCA) cycle, has emerged as a hallmark of cancer that supports tumor growth and metastasis. Despite the TCA cycle being a classical central metabolic pathway, further exploration is needed to fully elucidate the intricate manifestations and contributory mechanisms of TCA cycle rewiring in colorectal carcinogenesis. In this study, we identified a splicing isoform of citrate synthase (CS), CS-ΔEx4, and unveiled its role in TCA cycle dysregulation in colorectal cancer. CS-ΔEx4 was distinctly upregulated in colorectal cancer tumors compared with the canonical CS full-length (CS-FL) isoform. Clinical analyses established a strong correlation between elevated CS-ΔEx4 expression and cancer recurrence as well as inferior survival outcomes in patients with colorectal cancer. Functional experiments revealed the active contribution of CS-ΔEx4 to the aggressive phenotype of colorectal cancer cells both in vitro and in vivo. Mechanistically, CS-ΔEx4 formed a heterocomplex with CS-FL within the mitochondria that influenced the enzymatic function of canonical CS and accelerated TCA cycle flux, thereby promoting the accumulation of the oncometabolite 2-hydroxyglutarate. The CS-ΔEx4–mediated metabolic alterations engendered epigenomic modulations that drove the upregulation of oncogenic gene signatures. In silico screening identified a small molecule with potent antiproliferative effects in colorectal cancer cell line and organoid models that selectively antagonized the CS-ΔEx4 and CS-FL heterocomplex activity while sparing the CS-FL homodimers. Together, this study discovered the presence of a spliced CS isoform that promotes colorectal cancer progression and identified a molecule that holds potential for targeting the CS-ΔEx4 and CS-FL heterocomplex. Significance: The citrate synthase variant CS-ΔEx4 augments TCA metabolic flux to facilitate epigenetic reprogramming and colorectal carcinogenesis and can be targeted with a small molecule, providing a promising treatment strategy for colorectal cancer. See related commentary by Schatton and Frezza, p. 4293

Overview

The claims and statistics of this paper haven’t been checked yet.

Run the check — free, no account needed. It reads the open-access text and checks the sources it cites.

A few free checks a day · papers already verified open instantly · results are public

Integrity signals

Registry

Crossref · 10.1158/0008-5472.can-24-2355

Cites

10 of 10 references verified0 citation errors · 0 not checkable

Statistics

Figures

Graphical abstract
Graphical abstract CC BY-NC-ND · PubMed Central
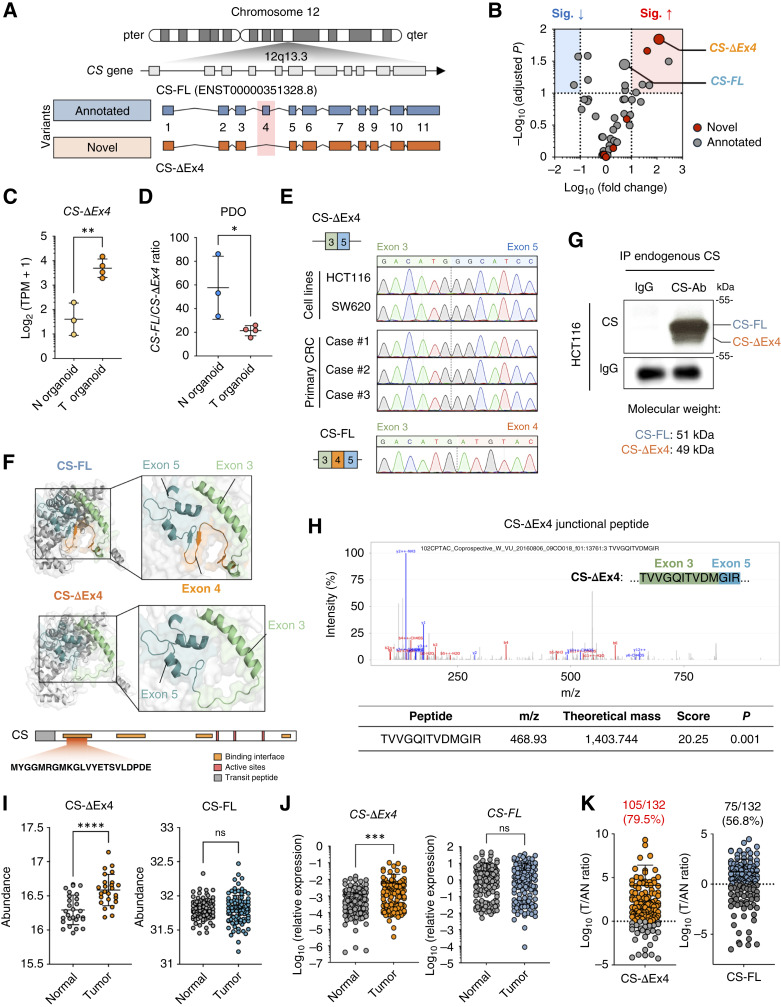
Figure 1. Identification of CS-ΔEx4, a novel CS exon 4 skipping isoform. A, Schematic of two CS isoforms. Gray, pre-mRNA of the CS gene transcribed from locus 12q13.3; blue, annotated CS isoform (CS-FL); orange, novel isoform with exon 4 skipping (CS-ΔEx4). B, Volcano plot displaying 56 transcripts from 31 TCA cycle–related genes in patient-derived organoids. C, Expression levels of CS-ΔEx4 between normal colonic organoids (N = 3) and colorectal cancer organoids (N = 4) using in-house hybrid sequencing. D, Calculation of the FL/ΔEx4 ratio based on TPM values from the in-house hybrid sequencing data. Statistical significance was assessed using Student t tests. N organoids, normal colonic organoids; T organoids, colorectal cancer organoids; PDO, patient-derived organoids. E, Chromatograms from Sanger sequencing of qRT-PCR amplicons of CS-ΔEx4 in colorectal cancer (CRC) cases (N = 3) and colorectal cancer cell lines (HCT116 and SW620), as well as CS-FL in a colorectal cancer case (N = 1). F, Top, protein structures of CS-FL and CS-ΔEx4 predicted using AlphaFold 2. Green, exon 3; orange, exon 4; blue, exon 5. Bottom, protein domains of the CS protein with 22 amino acids in exon 4 located inside the first binding interface are denoted. G, Endogenous CS-FL and CS-ΔEx4 protein levels were determined via IP–Western blots in the colorectal cancer cell line HCT116. H, Top, MS/MS spectrum of the CS-ΔEx4 tryptic peptide in the CPTAC colorectal cancer proteomic database. Bottom, descriptive information of the CS-ΔEx4 tryptic peptide in the corresponding MS/MS spectrum. I, Abundance of CS in colon dataset (PDC000116). Statistical significance was determined by comparing normal and tumor groups using nonpaired Student t tests. J, mRNA levels of CS-FL (left) and CS-ΔEx4 (right) in a cohort of PWH patients with colorectal cancer (N = 132) were determined using qRT-PCR. ACTB was used for expression normalization. Data were analyzed using a paired Student t test. K, Tumor-to-adjacent normal (T/AN) ratio of CS-ΔEx4 in a cohort of PWH patients with colorectal cancer (N = 132). ns, not significant; ∗, P < 0.05; ∗∗, P < 0.01; ∗∗∗, P < 0.001; ∗∗∗∗, P < 0.0001.
Figure 1. Identification of CS-ΔEx4, a novel CS exon 4 skipping isoform. A, Schematic of two CS isoforms. Gray, pre-mRNA of the CS gene transcribed from locus 12q13.3; blue, annotated CS isoform (CS-FL); orange, novel isoform with exon 4 skipping (CS-ΔEx4). B, Volcano plot displaying 56 transcripts from 31 TCA cycle–related genes in patient-derived organoids. C, Expression levels of CS-ΔEx4 between normal colonic organoids (N = 3) and colorectal cancer organoids (N = 4) using in-house hybrid sequencing. D, Calculation of the FL/ΔEx4 ratio based on TPM values from the in-house hybrid sequencing data. Statistical significance was assessed using Student t tests. N organoids, normal colonic organoids; T organoids, colorectal cancer organoids; PDO, patient-derived organoids. E, Chromatograms from Sanger sequencing of qRT-PCR amplicons of CS-ΔEx4 in colorectal cancer (CRC) cases (N = 3) and colorectal cancer cell lines (HCT116 and SW620), as well as CS-FL in a colorectal cancer case (N = 1). F, Top, protein structures of CS-FL and CS-ΔEx4 predicted using AlphaFold 2. Green, exon 3; orange, exon 4; blue, exon 5. Bottom, protein domains of the CS protein with 22 amino acids in exon 4 located inside the first binding interface are denoted. G, Endogenous CS-FL and CS-ΔEx4 protein levels were determined via IP–Western blots in the colorectal cancer cell line HCT116. H, Top, MS/MS spectrum of the CS-ΔEx4 tryptic peptide in the CPTAC colorectal cancer proteomic database. Bottom, descriptive information of the CS-ΔEx4 tryptic peptide in the corresponding MS/MS spectrum. I, Abundance of CS in colon dataset (PDC000116). Statistical significance was determined by comparing normal and tumor groups using nonpaired Student t tests. J, mRNA levels of CS-FL (left) and CS-ΔEx4 (right) in a cohort of PWH patients with colorectal cancer (N = 132) were determined using qRT-PCR. ACTB was used for expression normalization. Data were analyzed using a paired Student t test. K, Tumor-to-adjacent normal (T/AN) ratio of CS-ΔEx4 in a cohort of PWH patients with colorectal cancer (N = 132). ns, not significant; ∗, P < 0.05; ∗∗, P < 0.01; ∗∗∗, P < 0.001; ∗∗∗∗, P < 0.0001.CC BY-NC-ND · PubMed Central
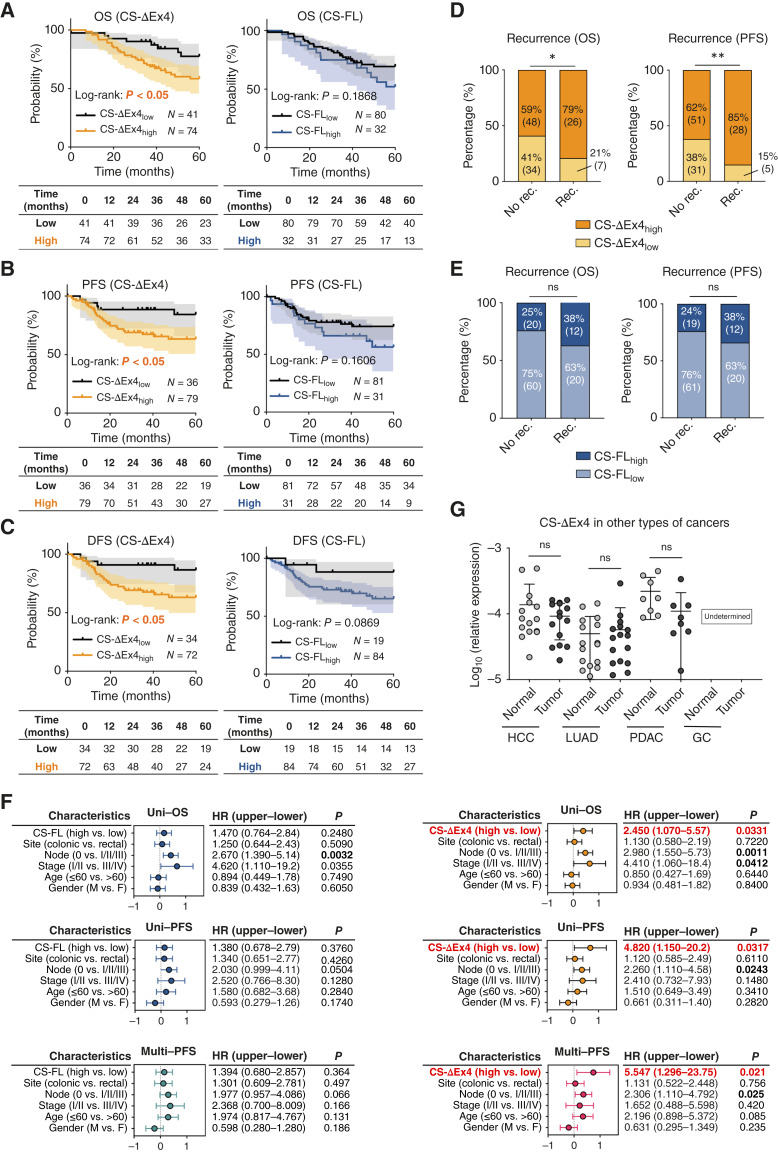
Figure 2. CS-ΔEx4 as a prognostic indicator in colorectal cancer. A–C, Kaplan–Meier survival analyses with risk tables of CS-ΔEx4 (left) and CS-FL (right) high and low expression groups using best cutoffs of OS (A), PFS (B), and disease-free survival (DFS; C). D, χ2 analyses of recurrence and CS-ΔEx4 expressions using OS cutoff (left) and PFS cutoff (right). E, χ2 analyses of recurrence and CS-FL expressions using OS cutoff (left) and PFS cutoff (right). F, HR and CIs were determined through uni- and multivariate Cox regression models to analyze the independent association of OS and PFS with CS isoforms among selected clinicopathologic parameters. G,CS-ΔEx4 expressions were determined in multiple cancer types, including hepatocellular carcinoma (HCC), lung adenocarcinoma (LUAD), pancreatic ductal adenocarcinoma (PDAC), and gastric carcinoma (GC). Data were analyzed using the Student t test. ns, not significant; ∗, P < 0.05; ∗∗, P < 0.01.
Figure 2. CS-ΔEx4 as a prognostic indicator in colorectal cancer. A–C, Kaplan–Meier survival analyses with risk tables of CS-ΔEx4 (left) and CS-FL (right) high and low expression groups using best cutoffs of OS (A), PFS (B), and disease-free survival (DFS; C). D, χ2 analyses of recurrence and CS-ΔEx4 expressions using OS cutoff (left) and PFS cutoff (right). E, χ2 analyses of recurrence and CS-FL expressions using OS cutoff (left) and PFS cutoff (right). F, HR and CIs were determined through uni- and multivariate Cox regression models to analyze the independent association of OS and PFS with CS isoforms among selected clinicopathologic parameters. G,CS-ΔEx4 expressions were determined in multiple cancer types, including hepatocellular carcinoma (HCC), lung adenocarcinoma (LUAD), pancreatic ductal adenocarcinoma (PDAC), and gastric carcinoma (GC). Data were analyzed using the Student t test. ns, not significant; ∗, P < 0.05; ∗∗, P < 0.01.CC BY-NC-ND · PubMed Central
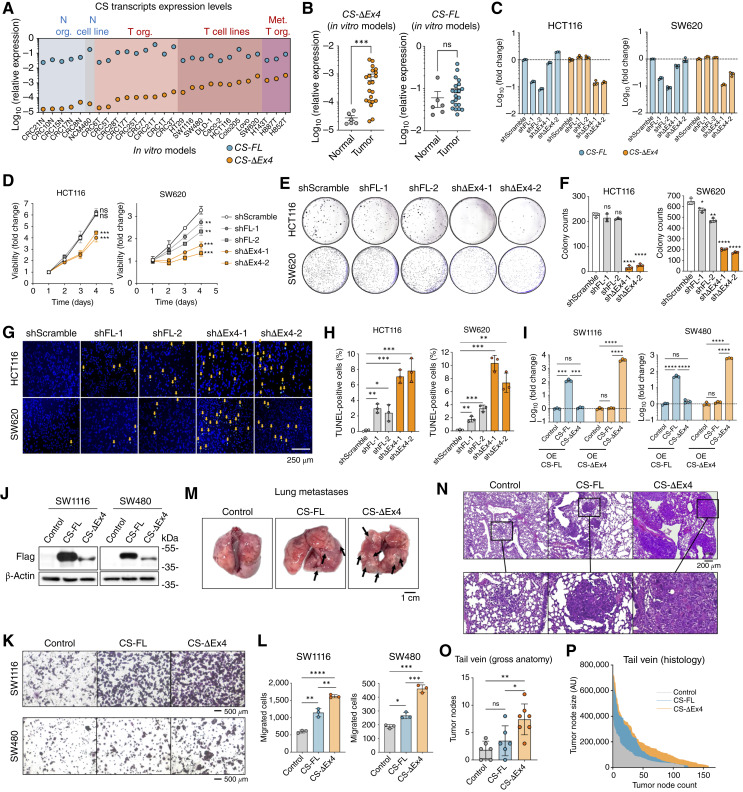
Figure 3. CS-ΔEx4 promotes colorectal cancer oncogenicity in vitro and in vivo. A, Expression of CS-ΔEx4 and CS-FL in normal colonic and colorectal cancer in vitro models. B, Expression levels of CS-ΔEx4 (left) and CS-FL (right) in normal and tumor in vitro models. Statistical significance was determined using Mann–Whitney tests. C, qRT-PCR of short hairpin RNA knockdown of CS-FL and CS-ΔEx4 in HCT116 (left) and SW620 (right) cells. D, Cell viability assay of HCT116 (left) and SW620 (right) cells upon lentiviral knockdown of CS isoforms by the indicated shRNAs. Data were analyzed using Student t tests using the readings on the final day in each group, comparing the shScramble group. E, Representative images of the clonogenic assay of HCT116 (top) and SW620 (bottom) cells upon lentiviral knockdown of CS isoforms by the indicated shRNAs. F, Quantification of the clonogenic assays in E. Data were analyzed using Student t tests comparing the shScramble group. G, Representative images of the TUNEL assay of HCT116 (top) and SW620 (bottom) cells upon lentiviral knockdown of CS isoforms by the indicated shRNAs. H, Quantification of the TUNEL assays in G. Data were analyzed using Student t tests comparing the shScramble group. I, qRT-PCR of lentiviral overexpression (OE) of CS-FL and CS-ΔEx4 in SW1116 (left) and SW480 (right) cells. J, Western blot demonstrating successful overexpression of Flag-tagged CS-FL or CS-ΔEx4 in SW1116 (left) and SW480 (right) cells. K, Representative images of the Transwell migration assay upon lentiviral overexpression of CS isoforms. L, Quantification of the Transwell migration assays in K. Data were analyzed using Student t tests for each paired comparison. M, Representative lung images of tail vein metastatic models after injection of SW1116 cells overexpressing CS isoforms. Arrows indicate the metastatic tumor nodules located on the surface of the lung. N, Representative hematoxylin and eosin staining images of harvested lungs of tail vein metastatic models after injection of SW1116 cells overexpressing CS isoforms. O, Quantification of tumor nodes observed in the gross anatomy upon harvesting the lungs in tail vein metastatic models (n ≥ 6). Data were analyzed using Student t tests for each paired comparison. P, Quantification of histologic tumor node size against tumor node count in tail vein metastatic models. ns, not significant; ∗, P < 0.05; ∗∗, P < 0.01; ∗∗∗, P < 0.001; ∗∗∗∗, P < 0.0001.
Figure 3. CS-ΔEx4 promotes colorectal cancer oncogenicity in vitro and in vivo. A, Expression of CS-ΔEx4 and CS-FL in normal colonic and colorectal cancer in vitro models. B, Expression levels of CS-ΔEx4 (left) and CS-FL (right) in normal and tumor in vitro models. Statistical significance was determined using Mann–Whitney tests. C, qRT-PCR of short hairpin RNA knockdown of CS-FL and CS-ΔEx4 in HCT116 (left) and SW620 (right) cells. D, Cell viability assay of HCT116 (left) and SW620 (right) cells upon lentiviral knockdown of CS isoforms by the indicated shRNAs. Data were analyzed using Student t tests using the readings on the final day in each group, comparing the shScramble group. E, Representative images of the clonogenic assay of HCT116 (top) and SW620 (bottom) cells upon lentiviral knockdown of CS isoforms by the indicated shRNAs. F, Quantification of the clonogenic assays in E. Data were analyzed using Student t tests comparing the shScramble group. G, Representative images of the TUNEL assay of HCT116 (top) and SW620 (bottom) cells upon lentiviral knockdown of CS isoforms by the indicated shRNAs. H, Quantification of the TUNEL assays in G. Data were analyzed using Student t tests comparing the shScramble group. I, qRT-PCR of lentiviral overexpression (OE) of CS-FL and CS-ΔEx4 in SW1116 (left) and SW480 (right) cells. J, Western blot demonstrating successful overexpression of Flag-tagged CS-FL or CS-ΔEx4 in SW1116 (left) and SW480 (right) cells. K, Representative images of the Transwell migration assay upon lentiviral overexpression of CS isoforms. L, Quantification of the Transwell migration assays in K. Data were analyzed using Student t tests for each paired comparison. M, Representative lung images of tail vein metastatic models after injection of SW1116 cells overexpressing CS isoforms. Arrows indicate the metastatic tumor nodules located on the surface of the lung. N, Representative hematoxylin and eosin staining images of harvested lungs of tail vein metastatic models after injection of SW1116 cells overexpressing CS isoforms. O, Quantification of tumor nodes observed in the gross anatomy upon harvesting the lungs in tail vein metastatic models (n ≥ 6). Data were analyzed using Student t tests for each paired comparison. P, Quantification of histologic tumor node size against tumor node count in tail vein metastatic models. ns, not significant; ∗, P < 0.05; ∗∗, P < 0.01; ∗∗∗, P < 0.001; ∗∗∗∗, P < 0.0001.CC BY-NC-ND · PubMed Central
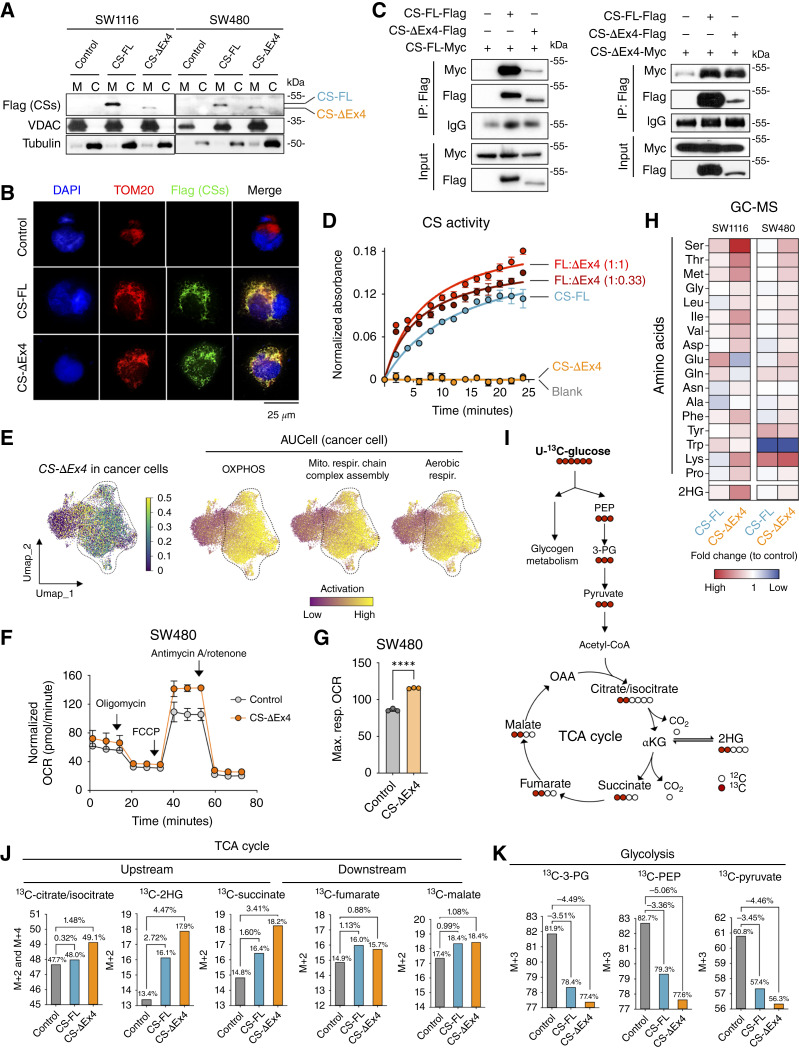
Figure 4. CS-ΔEx4 increases TCA cycle activity in colorectal cancer cells through interaction with CS-FL. A, Detection of CS-FL and CS-ΔEx4 through mitochondria–cytosol fractionation and Western blotting in (left) SW1116 and (right) SW480 cells. M, mitochondrial; C, cytosolic. B, Immunofluorescence staining of Flag-tagged CS-FL and CS-ΔEx4 with the mitochondrial control TOM20 in 293FT cells. C, Coimmunoprecipitation immunoblots demonstrating the interaction of CS-ΔEx4 with CS-FL and CS-ΔEx4. D, CS activity assay using blank control, CS-FL, CS-ΔEx4, FL-ΔEx4 (1:0.33), and FL-ΔEx4 (1:1) groups, demonstrating the time- and dose-dependent increase by CS-ΔEx4 on CS-FL enzymatic activity. E, Left, UMAP representation of cancer cells in the reanalyzed colorectal cancer tumor scRNA-seq dataset, showing CS-ΔEx4 expression levels. Right, AUCell-driven GSEA depicting the activation of oxidative phosphorylation (OXPHOS), aerobic respiration, and mitochondrial respiratory chain complex assembly pathways in cancer cells. F, Measurement of oxygen consumption rate (OCR) by Seahorse analysis in SW480 cells overexpressing CS-ΔEx4. Statistical significance was determined using unpaired Student t tests in G. H, Heatmap of amino acids and 2HG determined by GC-MS using CS isoform–overexpressing SW1116 and SW480 cells. Fold change values (normalized with lentiviral control) were used to construct the heatmap. I, Tracing schematics of U-13C6-glucose in glycolysis and the TCA cycle. J, U-13C6-glucose tracing to determine the fractional enrichment (%) of upstream (left) and downstream (right) TCA cycle intermediates. K, U-13C6-glucose tracing to determine the fractional enrichment (%) of glycolytic intermediates.
Figure 4. CS-ΔEx4 increases TCA cycle activity in colorectal cancer cells through interaction with CS-FL. A, Detection of CS-FL and CS-ΔEx4 through mitochondria–cytosol fractionation and Western blotting in (left) SW1116 and (right) SW480 cells. M, mitochondrial; C, cytosolic. B, Immunofluorescence staining of Flag-tagged CS-FL and CS-ΔEx4 with the mitochondrial control TOM20 in 293FT cells. C, Coimmunoprecipitation immunoblots demonstrating the interaction of CS-ΔEx4 with CS-FL and CS-ΔEx4. D, CS activity assay using blank control, CS-FL, CS-ΔEx4, FL-ΔEx4 (1:0.33), and FL-ΔEx4 (1:1) groups, demonstrating the time- and dose-dependent increase by CS-ΔEx4 on CS-FL enzymatic activity. E, Left, UMAP representation of cancer cells in the reanalyzed colorectal cancer tumor scRNA-seq dataset, showing CS-ΔEx4 expression levels. Right, AUCell-driven GSEA depicting the activation of oxidative phosphorylation (OXPHOS), aerobic respiration, and mitochondrial respiratory chain complex assembly pathways in cancer cells. F, Measurement of oxygen consumption rate (OCR) by Seahorse analysis in SW480 cells overexpressing CS-ΔEx4. Statistical significance was determined using unpaired Student t tests in G. H, Heatmap of amino acids and 2HG determined by GC-MS using CS isoform–overexpressing SW1116 and SW480 cells. Fold change values (normalized with lentiviral control) were used to construct the heatmap. I, Tracing schematics of U-13C6-glucose in glycolysis and the TCA cycle. J, U-13C6-glucose tracing to determine the fractional enrichment (%) of upstream (left) and downstream (right) TCA cycle intermediates. K, U-13C6-glucose tracing to determine the fractional enrichment (%) of glycolytic intermediates.CC BY-NC-ND · PubMed Central
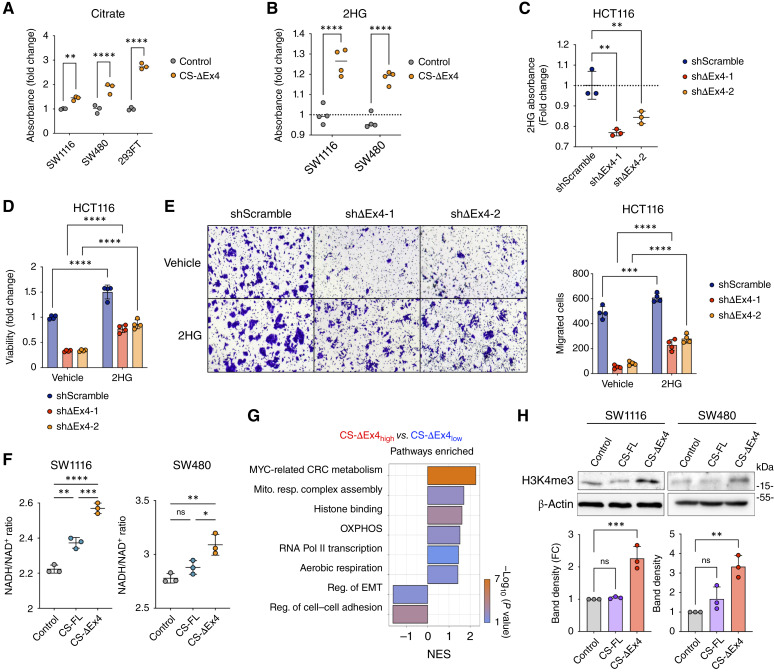
Figure 5. Relationship between CS-ΔEx4 and 2HG in biological phenotypes. A, Overexpression of CS-ΔEx4 in SW1116, SW480, and 293FT promoted citrate substrate production, as determined by the citrate assay. Data were analyzed using Student t tests comparing the control group and CS-ΔEx4. B, Overexpression of CS-ΔEx4 in SW1116 and SW480 promoted 2HG production, as determined by the 2HG assay. Data were analyzed using Student t tests comparing the control group and CS-ΔEx4. C, Knockdown of CS-ΔEx4 in HCT116 decreased 2HG production, as determined by the 2HG assay. D, Cell viability rescued by 2HG in HCT116 cells with CS-ΔEx4 knockdown. E, Migratory behavior rescued by 2HG in HCT116 cells with CS-ΔEx4 knockdown. F, Measurement of NADH/NAD+ ratios in SW1116 and SW480 cells overexpressing CS isoforms. G, GO analysis of the colorectal cancer (CRC) transcriptomic dataset PRJNA387172, stratified by high and low CS-ΔEx4 expression, highlights the involvement of metabolic-related, histone-modifying, and EMT-related pathways. NES, normalized enrichment score; OXPHOS, oxidative phosphorylation; Pol II, polymerase II. H, Histone mark H3K4me3 in CS isoform–overexpressing SW1116 (left) and SW480 (right) cells was evaluated by Western blotting. β-Actin was used as an endogenous control. Pixel density was then quantified. ns, not significant; ∗, P < 0.05; ∗∗, P < 0.01; ∗∗∗, P < 0.001; ∗∗∗∗, P < 0.0001. FC, fold change.
Figure 5. Relationship between CS-ΔEx4 and 2HG in biological phenotypes. A, Overexpression of CS-ΔEx4 in SW1116, SW480, and 293FT promoted citrate substrate production, as determined by the citrate assay. Data were analyzed using Student t tests comparing the control group and CS-ΔEx4. B, Overexpression of CS-ΔEx4 in SW1116 and SW480 promoted 2HG production, as determined by the 2HG assay. Data were analyzed using Student t tests comparing the control group and CS-ΔEx4. C, Knockdown of CS-ΔEx4 in HCT116 decreased 2HG production, as determined by the 2HG assay. D, Cell viability rescued by 2HG in HCT116 cells with CS-ΔEx4 knockdown. E, Migratory behavior rescued by 2HG in HCT116 cells with CS-ΔEx4 knockdown. F, Measurement of NADH/NAD+ ratios in SW1116 and SW480 cells overexpressing CS isoforms. G, GO analysis of the colorectal cancer (CRC) transcriptomic dataset PRJNA387172, stratified by high and low CS-ΔEx4 expression, highlights the involvement of metabolic-related, histone-modifying, and EMT-related pathways. NES, normalized enrichment score; OXPHOS, oxidative phosphorylation; Pol II, polymerase II. H, Histone mark H3K4me3 in CS isoform–overexpressing SW1116 (left) and SW480 (right) cells was evaluated by Western blotting. β-Actin was used as an endogenous control. Pixel density was then quantified. ns, not significant; ∗, P < 0.05; ∗∗, P < 0.01; ∗∗∗, P < 0.001; ∗∗∗∗, P < 0.0001. FC, fold change.CC BY-NC-ND · PubMed Central
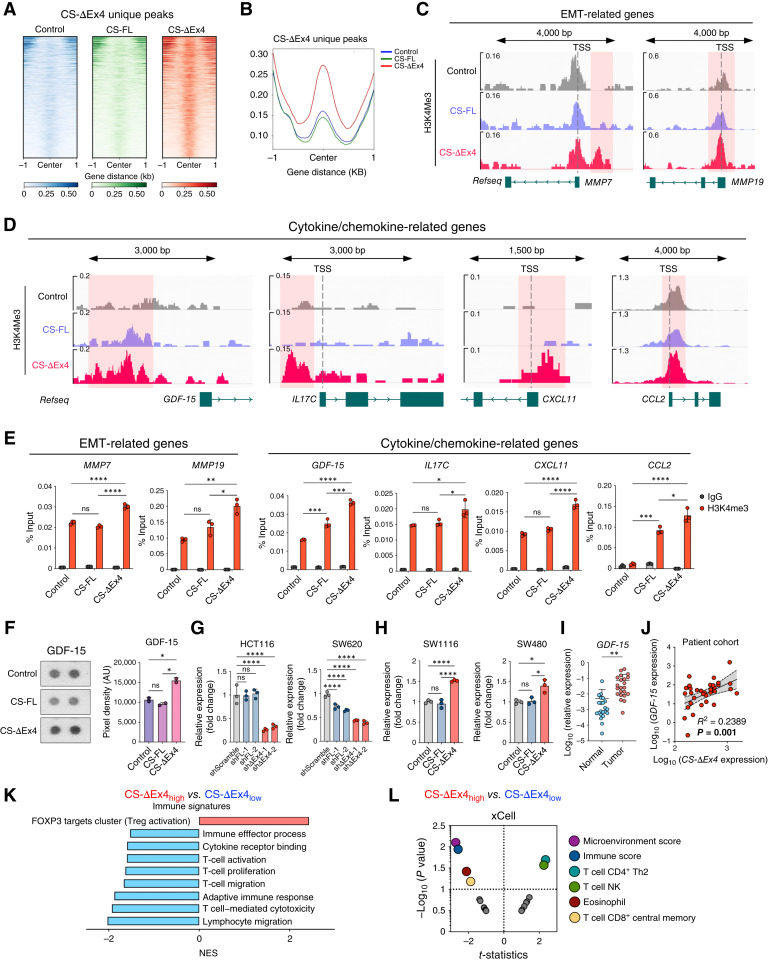
Figure 6. CS-ΔEx4 promotes metabolic rewiring and instigates histone remodeling to alter immune signatures. A and B, ChIP-seq heatmaps and profiles generated by identifying CS-ΔEx4 unique peaks in CS isoform–overexpressing SW1116 cells. C and D, Genome browser view of EMT-related genes MMP7 and MMP19 and cytokine/chemokine-related genes GDF-15, IL17C, CXCL11, and CCL2 from ChIP-seq. Distinctive peaks were observed, covering the regions before transcription start site (TSS), and were chosen for ChIP-qPCR validation. E, ChIP-qPCR validation results for MMP7, MMP19, GDF-15, IL17C, CXCL11, and CCL2. F, Proteome profiling cytokine array revealed that the prometastatic cytokine GDF-15 increased in the SW1116 cells with CS-ΔEx4 overexpression. Quantification of blotting results is on the right in terms of pixel density. G, Relative expression of GDF-15 was determined in HCT116 and SW620 cells with the CS isoform knockdown. H, Relative expression of GDF-15 was determined in CS isoform–overexpressing SW1116 and SW480 cells. I,GDF-15 expression levels were determined in the PWH colorectal cancer cohort. J, Correlation plot showing that CS-ΔEx4 is positively correlated with GDF-15 expression in the cohort of PWH patients with colorectal cancer. K, GO analysis of dataset PRJNA387172, stratified by high and low CS-ΔEx4 expression, highlights the involvement of immune-related pathways. L, xCell-based immune infiltration analysis, with samples stratified by high and low CS-ΔEx4 expression, of colorectal cancer dataset PRJNA387172. ns, not significant; ∗, P < 0.05; ∗∗, P < 0.01; ∗∗∗, P < 0.001; ∗∗∗∗, P < 0.0001.
Figure 6. CS-ΔEx4 promotes metabolic rewiring and instigates histone remodeling to alter immune signatures. A and B, ChIP-seq heatmaps and profiles generated by identifying CS-ΔEx4 unique peaks in CS isoform–overexpressing SW1116 cells. C and D, Genome browser view of EMT-related genes MMP7 and MMP19 and cytokine/chemokine-related genes GDF-15, IL17C, CXCL11, and CCL2 from ChIP-seq. Distinctive peaks were observed, covering the regions before transcription start site (TSS), and were chosen for ChIP-qPCR validation. E, ChIP-qPCR validation results for MMP7, MMP19, GDF-15, IL17C, CXCL11, and CCL2. F, Proteome profiling cytokine array revealed that the prometastatic cytokine GDF-15 increased in the SW1116 cells with CS-ΔEx4 overexpression. Quantification of blotting results is on the right in terms of pixel density. G, Relative expression of GDF-15 was determined in HCT116 and SW620 cells with the CS isoform knockdown. H, Relative expression of GDF-15 was determined in CS isoform–overexpressing SW1116 and SW480 cells. I,GDF-15 expression levels were determined in the PWH colorectal cancer cohort. J, Correlation plot showing that CS-ΔEx4 is positively correlated with GDF-15 expression in the cohort of PWH patients with colorectal cancer. K, GO analysis of dataset PRJNA387172, stratified by high and low CS-ΔEx4 expression, highlights the involvement of immune-related pathways. L, xCell-based immune infiltration analysis, with samples stratified by high and low CS-ΔEx4 expression, of colorectal cancer dataset PRJNA387172. ns, not significant; ∗, P < 0.05; ∗∗, P < 0.01; ∗∗∗, P < 0.001; ∗∗∗∗, P < 0.0001.CC BY-NC-ND · PubMed Central
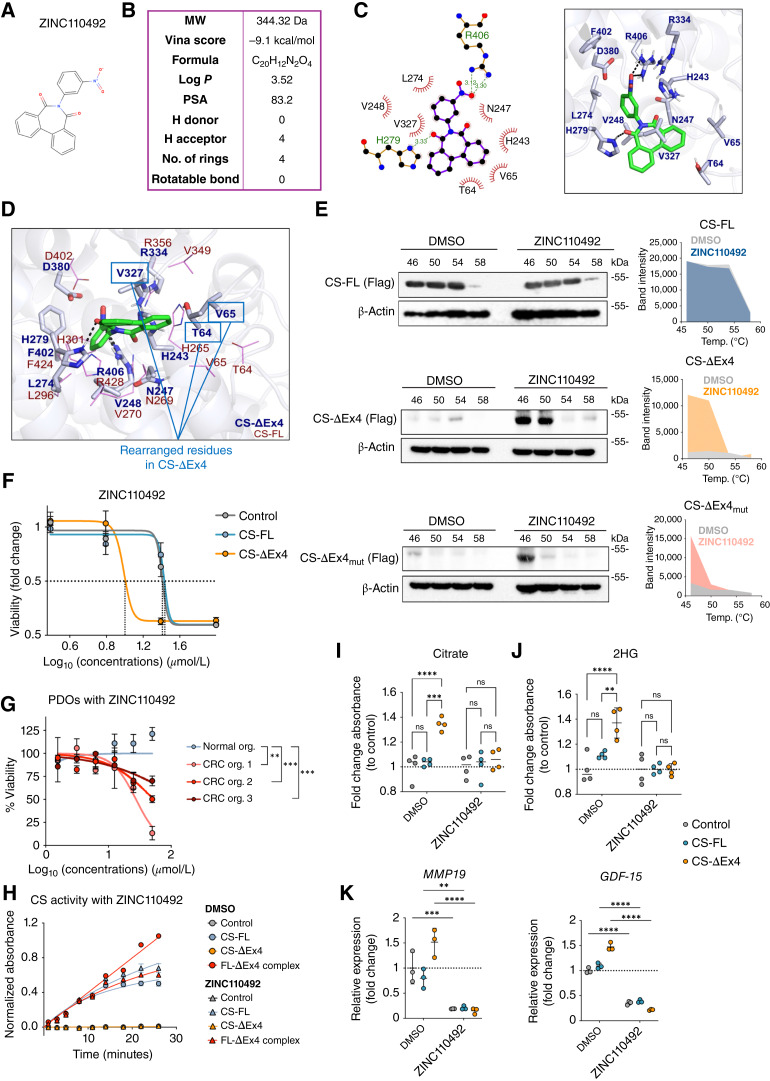
Figure 7. Synthetic small molecule antagonizes CS-FL-ΔEx4 heterocomplex to elicit antitumor activity. A, Two-dimensional chemical structure of ZINC110492 (MolView: https://molview.org). B, Summarized chemical profile of ZINC110492. MW, molecular weight. C, Two-dimensional (left) and 3D (right) in silico docking diagram of ZINC110492 with CS-ΔEx4. D,In silico docking diagram showing rearranged T64, V65, and V327 of CS-ΔEx4 as participating residues. E, CETSA immunoblots analyzing DMSO and 20 μmol/L ZINC110492 treatment with band intensity quantification of CS-FL (top), CS-ΔEx4 (middle), and CS-ΔEx4mut (T64A, V65A, and V327A; bottom). F, Potent and specific inhibition of SW1116 cell growth with CS-ΔEx4 overexpression by ZINC110492 compared with control and CS-FL groups. G, Dose–response relationship with CS-ΔEx4 and ZINC110492 denoted by cell viability in patient-derived colorectal cancer organoids (N = 3) and normal colonic organoid (N = 1). H, The CS activity assay showed significant inhibition in enzymatic activity in the FL-ΔEx4 group upon the addition of ZINC110492, whereas limited influence was exerted on CS-FL. DMSO was used as a vehicle control. I, Citrate levels in CS isoform–overexpressing SW1116 cells treated with DMSO or ZINC110492. J, 2HG levels in CS isoform–overexpressing SW1116 cells treated with DMSO or ZINC110492. K,MMP19 and GDF-15 expressions in CS isoform–overexpressing SW1116 cells treated with DMSO or ZINC110492. ns, not significant; ∗∗, P < 0.01; ∗∗∗, P < 0.001; ∗∗∗∗, P < 0.0001.
Figure 7. Synthetic small molecule antagonizes CS-FL-ΔEx4 heterocomplex to elicit antitumor activity. A, Two-dimensional chemical structure of ZINC110492 (MolView: https://molview.org). B, Summarized chemical profile of ZINC110492. MW, molecular weight. C, Two-dimensional (left) and 3D (right) in silico docking diagram of ZINC110492 with CS-ΔEx4. D,In silico docking diagram showing rearranged T64, V65, and V327 of CS-ΔEx4 as participating residues. E, CETSA immunoblots analyzing DMSO and 20 μmol/L ZINC110492 treatment with band intensity quantification of CS-FL (top), CS-ΔEx4 (middle), and CS-ΔEx4mut (T64A, V65A, and V327A; bottom). F, Potent and specific inhibition of SW1116 cell growth with CS-ΔEx4 overexpression by ZINC110492 compared with control and CS-FL groups. G, Dose–response relationship with CS-ΔEx4 and ZINC110492 denoted by cell viability in patient-derived colorectal cancer organoids (N = 3) and normal colonic organoid (N = 1). H, The CS activity assay showed significant inhibition in enzymatic activity in the FL-ΔEx4 group upon the addition of ZINC110492, whereas limited influence was exerted on CS-FL. DMSO was used as a vehicle control. I, Citrate levels in CS isoform–overexpressing SW1116 cells treated with DMSO or ZINC110492. J, 2HG levels in CS isoform–overexpressing SW1116 cells treated with DMSO or ZINC110492. K,MMP19 and GDF-15 expressions in CS isoform–overexpressing SW1116 cells treated with DMSO or ZINC110492. ns, not significant; ∗∗, P < 0.01; ∗∗∗, P < 0.001; ∗∗∗∗, P < 0.0001.CC BY-NC-ND · PubMed Central

Verification

Claims the paper makes

The claims and statistics of this paper haven’t been checked yet.

Run the check — free, no account needed. It reads the open-access text and checks the sources it cites.

A few free checks a day · papers already verified open instantly · results are public

Self-check

Percentages, sums and reported differences re-computed from the paper’s own numbers.

The self-check needs the paper’s full text.

Citations

Cites

Research works printed but not linked: 60

  1. Jiang, 2011, p53 regulates biosynthesis through direct inactivation of glucose-6-phosphate dehydrogenase, Nat Cell Biol, 13, 310, 10.1038/ncb2172 · DOI
  2. Morris, 2019, α-Ketoglutarate links p53 to cell fate during tumour suppression, Nature, 573, 595, 10.1038/s41586-019-1577-5 · DOI · Paper page
  3. Satoh, 2017, Global metabolic reprogramming of colorectal cancer occurs at adenoma stage and is induced by MYC, Proc Natl Acad Sci U S A, 114, E7697, 10.1073/pnas.1710366114 · DOI
  4. Tannahill, 2013, Succinate is an inflammatory signal that induces IL-1β through HIF-1α, Nature, 496, 238, 10.1038/nature11986 · DOI · Paper page
  5. Moussaieff, 2015, Glycolysis-mediated changes in acetyl-CoA and histone acetylation control the early differentiation of embryonic stem cells, Cell Metab, 21, 392, 10.1016/j.cmet.2015.02.002 · DOI · Paper page
  6. Wong, 2017, The role of fatty acid beta-oxidation in lymphangiogenesis, Nature, 542, 49, 10.1038/nature21028 · DOI
  7. Shen, 2021, DLST-Dependence dictates metabolic heterogeneity in TCA-Cycle usage among triple-negative breast cancer, Commun Biol, 4, 1289, 10.1038/s42003-021-02805-8 · DOI
  8. Arnold, 2022, A non-canonical tricarboxylic acid cycle underlies cellular identity, Nature, 603, 477, 10.1038/s41586-022-04475-w · DOI · Paper page
  9. Wang, 2018, Sirtuin5 contributes to colorectal carcinogenesis by enhancing glutaminolysis in a deglutarylation-dependent manner, Nat Commun, 9, 545, 10.1038/s41467-018-02951-4 · DOI
  10. Martínez-Reyes, 2020, Mitochondrial TCA cycle metabolites control physiology and disease, Nat Commun, 11, 102, 10.1038/s41467-019-13668-3 · DOI · Paper page
  11. Vellinga, 2015, SIRT1/PGC1α-Dependent increase in oxidative phosphorylation supports chemotherapy resistance of Colon cancer, Clin Cancer Res, 21, 2870, 10.1158/1078-0432.CCR-14-2290 · DOI
  12. Wang, 2024, The OGT-c-Myc-PDK2 axis rewires the TCA cycle and promotes colorectal tumor growth, Cell Death Differ, 31, 1157, 10.1038/s41418-024-01315-4 · DOI
  13. Sung, 2021, Global cancer statistics 2020: GLOBOCAN estimates of incidence and mortality worldwide for 36 cancers in 185 countries, CA Cancer J Clin, 71, 209
  14. Sedlak, 2023, Metabolism and colorectal cancer, Annu Rev Pathol, 18, 467, 10.1146/annurev-pathmechdis-031521-041113 · DOI
  15. Wen, 2023, PepQuery2 democratizes public MS proteomics data for rapid peptide searching, Nat Commun, 14, 2213, 10.1038/s41467-023-37462-4 · DOI
  16. Vasaikar, 2019, Proteogenomic analysis of human colon cancer reveals new therapeutic opportunities, Cell, 177, 1035, 10.1016/j.cell.2019.03.030 · DOI · Paper page
  17. Kong, 2017, MSFragger: ultrafast and comprehensive peptide identification in mass spectrometry-based proteomics, Nat Methods, 14, 513, 10.1038/nmeth.4256 · DOI
  18. Nesvizhskii, 2003, A statistical model for identifying proteins by tandem mass spectrometry, Anal Chem, 75, 4646, 10.1021/ac0341261 · DOI
  19. Case, 2005, The Amber biomolecular simulation programs, J Computat Chem, 26, 1668, 10.1002/jcc.20290 · DOI · Paper page
  20. Jurrus, 2018, Improvements to the APBS biomolecular solvation software suite, Protein Sci, 27, 112, 10.1002/pro.3280 · DOI
  21. Miyamoto, 1992, Settle: an analytical version of the SHAKE and RATTLE algorithm for rigid water models, J Comput Chem, 13, 952, 10.1002/jcc.540130805 · DOI
  22. Roe, 2013, PTRAJ and CPPTRAJ: software for processing and analysis of molecular dynamics trajectory data, J Chem Theor Comput, 9, 3084, 10.1021/ct400341p · DOI
  23. Pettersen, 2004, UCSF Chimera—A visualization system for exploratory research and analysis, J Comput Chem, 25, 1605, 10.1002/jcc.20084 · DOI
  24. Morris, 2009, AutoDock4 and AutoDockTools4: automated docking with selective receptor flexibility, J Comput Chem, 30, 2785, 10.1002/jcc.21256 · DOI
  25. Sterling, 2015, ZINC 15–ligand discovery for everyone, J Chem Inf Model, 55, 2324, 10.1021/acs.jcim.5b00559 · DOI · Paper page
  26. Taylor, 1995, Simulation analysis of experimental design strategies for screening random compounds as potential new drugs and agrochemicals, J Chem Inf Comput Sci, 35, 59, 10.1021/ci00023a009 · DOI
  27. Butina, 1999, Unsupervised data base clustering based on daylight’s fingerprint and tanimoto similarity: a fast and automated way to cluster small and large data sets, J Chem Inf Comput Sci, 39, 747, 10.1021/ci9803381 · DOI
  28. Bento, 2020, An open source chemical structure curation pipeline using RDKit, J Cheminformatics, 12, 1, 10.1186/s13321-020-00456-1 · DOI
  29. O’Boyle, 2011, Open babel: an open chemical toolbox, J Cheminformatics, 3, 1
  30. Laskowski, 2011, LigPlot+: multiple ligand–protein interaction diagrams for drug discovery
  31. Maier, 2015, ff14SB: improving the accuracy of protein side chain and backbone parameters from ff99SB, J Chem Theor Comput, 11, 3696, 10.1021/acs.jctc.5b00255 · DOI
  32. Wang, 2004, Development and testing of a general amber force field, J Comput Chem, 25, 1157, 10.1002/jcc.20035 · DOI
  33. Miller, 2012, MMPBSA.py: an efficient program for end-state free energy calculations, J Chem Theor Comput, 8, 3314, 10.1021/ct300418h · DOI
  34. Raza, 2019, Visualizing protein-ligand binding with chemical energy-wise decomposition (CHEWD): application to ligand binding in the kallikrein-8 S1 site, J Comput Aided Mol Des, 33, 461, 10.1007/s10822-019-00200-4 · DOI
  35. Udo, 2020, Urinary charged metabolite profiling of colorectal cancer using capillary electrophoresis-mass spectrometry, Sci Rep, 10, 21057, 10.1038/s41598-020-78038-2 · DOI
  36. Zhang, 2021, Gene expression profiling of tricarboxylic acid cycle and one carbon metabolism related genes for prognostic risk signature of Colon carcinoma, Front Genet, 12, 647152, 10.3389/fgene.2021.647152 · DOI
  37. Yang, 2016, Serine and one-carbon metabolism in cancer, Nat Rev Cancer, 16, 650, 10.1038/nrc.2016.81 · DOI · Paper page
  38. Fan, 2015, Human phosphoglycerate dehydrogenase produces the oncometabolite D-2-hydroxyglutarate, ACS Chem Biol, 10, 510, 10.1021/cb500683c · DOI
  39. Shu, 2022, Non-canonical phosphoglycerate dehydrogenase activity promotes liver cancer growth via mitochondrial translation and respiratory metabolism, EMBO J, 41, e111550, 10.15252/embj.2022111550 · DOI
  40. Lauterbach, 2019, Toll-like receptor signaling rewires macrophage metabolism and promotes histone acetylation via ATP-citrate lyase, Immunity, 51, 997, 10.1016/j.immuni.2019.11.009 · DOI
  41. Wallin, 2011, Growth differentiation factor 15: a prognostic marker for recurrence in colorectal cancer, Br J Cancer, 104, 1619, 10.1038/bjc.2011.112 · DOI
  42. Mielcarska, 2021, GDF-15 level correlates with CMKLR1 and VEGF-A in tumor-free margin in colorectal cancer, Curr Med Sci, 41, 522, 10.1007/s11596-021-2335-0 · DOI
  43. Zheng, 2021, HIF1α promotes tumor chemoresistance via recruiting GDF15-producing TAMs in colorectal cancer, Exp Cell Res, 398, 112394, 10.1016/j.yexcr.2020.112394 · DOI
  44. Lin, 2024, GDF15 induces chemoresistance to oxaliplatin by forming a reciprocal feedback loop with Nrf2 to maintain redox homeostasis in colorectal cancer, Cell Oncol (Dordr), 47, 1149, 10.1007/s13402-024-00918-w · DOI
  45. Haake, 2023, Tumor-derived GDF-15 blocks LFA-1 dependent T cell recruitment and suppresses responses to anti-PD-1 treatment, Nat Commun, 14, 4253, 10.1038/s41467-023-39817-3 · DOI
  46. Suriben, 2020, Antibody-mediated inhibition of GDF15-GFRAL activity reverses cancer cachexia in mice, Nat Med, 26, 1264, 10.1038/s41591-020-0945-x · DOI
  47. Zhang, 2022, GDF-15 in tumor-derived exosomes promotes muscle atrophy via Bcl-2/caspase-3 pathway, Cell Death Discov, 8, 162, 10.1038/s41420-022-00972-z · DOI
  48. Jafari, 2014, The cellular thermal shift assay for evaluating drug target interactions in cells, Nat Protoc, 9, 2100, 10.1038/nprot.2014.138 · DOI
  49. Weinberg, 2010, Mitochondrial metabolism and ROS generation are essential for Kras-mediated tumorigenicity, Proc Natl Acad Sci U S A, 107, 8788, 10.1073/pnas.1003428107 · DOI · Paper page
  50. Birsoy, 2015, An essential role of the mitochondrial electron transport chain in cell proliferation is to enable aspartate synthesis, Cell, 162, 540, 10.1016/j.cell.2015.07.016 · DOI · Paper page
  51. Hu, 2020, OXPHOS-Dependent metabolic reprogramming prompts metastatic potential of breast cancer cells under osteogenic differentiation, Br J Cancer, 123, 1644, 10.1038/s41416-020-01040-y · DOI
  52. Tabata, 2023, L-2hydroxyglutaric acid rewires amino acid metabolism in colorectal cancer via the mTOR-ATF4 axis, Oncogene, 42, 1294, 10.1038/s41388-023-02632-7 · DOI
  53. Colvin, 2016, Oncometabolite D-2-Hydroxyglurate directly induces epithelial-mesenchymal transition and is associated with distant metastasis in colorectal cancer, Sci Rep, 6, 36289, 10.1038/srep36289 · DOI
  54. Nota, 2013, Deficiency in SLC25A1, encoding the mitochondrial citrate carrier, causes combined D-2- and L-2-hydroxyglutaric aciduria, Am J Hum Genet, 92, 627, 10.1016/j.ajhg.2013.03.009 · DOI · Paper page
  55. Intlekofer, 2015, Hypoxia induces production of L-2-Hydroxyglutarate, Cell Metab, 22, 304, 10.1016/j.cmet.2015.06.023 · DOI · Paper page
  56. Tyrakis, 2016, S-2-hydroxyglutarate regulates CD8(+) T-lymphocyte fate, Nature, 540, 236, 10.1038/nature20165 · DOI · Paper page
  57. Cole, 1970, N-substituted 2,2'-diphenamic acids and diphenimides, J Med Chem, 13, 565, 10.1021/jm00297a061 · DOI
  58. Hall, 1986, Hypolipidemic activity of 6-substituted 6,7-dihydro-5H-dibenz[c,e]azepine and the effects of 6,7-dihydro-5H-dibenz[c,e]azepine on lipid metabolism of rodents, J Pharm Sci, 75, 622, 10.1002/jps.2600750622 · DOI
  59. Hall, 1990, The anti-inflammatory activity of 5H-dibenz[c,e]azepine-5,7(6H)dione, 6,7-dihydro-5H-dibenz[c,e]azepine, N-benzoylbenzamide and 1H-benz[d,e]isoquinoline-1,3(2H)dione derivatives in rodents, Acta Pharm Nord, 2, 387
  60. Verma, 2018, Synthesis and antihyperlipidemic activity of Dibenz[c,e]azepine-5,7-dione derivatives in triton WR-1339-induced hyperlipidemic rats, J Drug Deliv Ther, 8, 129

Metadata

Authors
Cheung, J. C. T., Ng, L. W., Zhu, Z., Chen, B., Li, S., Xu, M., Ding, X., Pu, D., Hu, Y., Ren, Y., Kang, W., Li, M., Wong, J. W. H., Wang, X., Cheng, Y. K., Aik, W. S., Wong, K. L., Ng, S. S. M., Wong, N., & Dong, Y.
Affiliations
  • Chinese University of Hong Kong (HK)
  • Hong Kong Baptist University (HK)
  • Chinese Academy of Sciences (CN)
  • University of Hong Kong (HK)
  • University of Macau (MO)
  • Nanchang University (CN)
  • Hong Kong Polytechnic University (HK)
Corresponding author
  • Wong, Nathalie
  • Dong, Yujuan
Venue
Cancer Research
Published
2025-09-03
Volume
85
Issue
22
Pages
4450-4468
ISSN
  • 0008-5472 (ISSN-L)
  • 1538-7445
OpenAlex
W4413952524
Cited by
3
References
10
Citations by year
2026: 3
FWCI
1.35
Type
journal article
Language
en
Open access
Locations
  • Cancer Research (publishedVersion, cc-by-nc-nd)
  • Europe PMC (PubMed Central) (publishedVersion, cc-by-nc-nd)
  • PubMed (publishedVersion)
Funders
  • Research Grants Council, University Grants Committee (AoE/M-, 401/20, 14115123, C4024-22GF)
  • Innovation and Technology Fund (RAI/24/1/077A)
Topics
  • Life Sciences › Biochemistry, Genetics and Molecular Biology › Cancer Research › Cancer, Hypoxia, and Metabolism
  • Life Sciences › Biochemistry, Genetics and Molecular Biology › Cancer Research › Cancer, Lipids, and Metabolism
  • Life Sciences › Biochemistry, Genetics and Molecular Biology › Molecular Biology › Metabolism, Diabetes, and Cancer
Keywords
citrate synthase, splice variants, colorectal cancer, 2-hydroxyglutarate, epigenetic reprogramming, tumor metabolic reprogramming, small molecule inhibitors, colorectal cancer progression, tumor recurrence
MeSH terms
Animals, Citrate (si)-Synthase, Citric Acid Cycle, Female, Humans, Mitochondria, Colorectal Neoplasms, Gene Expression Regulation, Neoplastic, Alternative Splicing, Disease Progression, Cell Line, Tumor, Cell Proliferation, Mice

About these checks

Registry, retraction, Cites and statistics results are computed, not judged, with one exception: a printed reference that no index lists is read once by a model before it counts as a citation error. Claims are extracted by a model and kept only when their quote appears verbatim in the text; each cited source is then checked, with a model’s help, for whether it says what the claim relies on. Those verdicts can be wrong — read the claim’s quote and the cited source before relying on one.

Statistics and arithmetic are recomputed, not judged.

Confidence bands are shown only for fields calibrated on our annotated test set. None is calibrated yet, so no band is shown.

What counts as a claim ›How we measure confidence ›How we check this ›

Are you an author, or do you see a problem with this page? Request a review