Cited by 109Atherosclerosis and Cardiovascular DiseasesCell Adhesion Molecules ResearchNeuroinflammation and Neurodegeneration Mechanisms

The DOI matches its Crossref record; 37 of the 37 references it cites were found in a registry or an index.

Endothelial Protective Monocyte Patrolling in Large Arteries Intensified by Western Diet and Atherosclerosis

Open access

Abstract

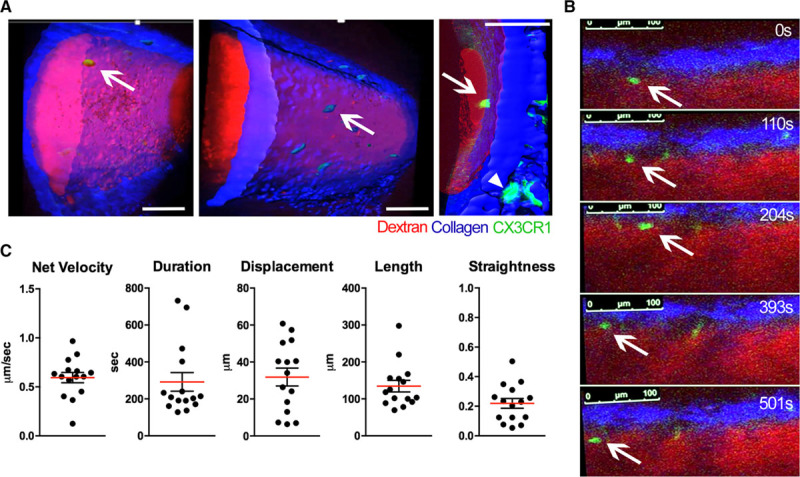
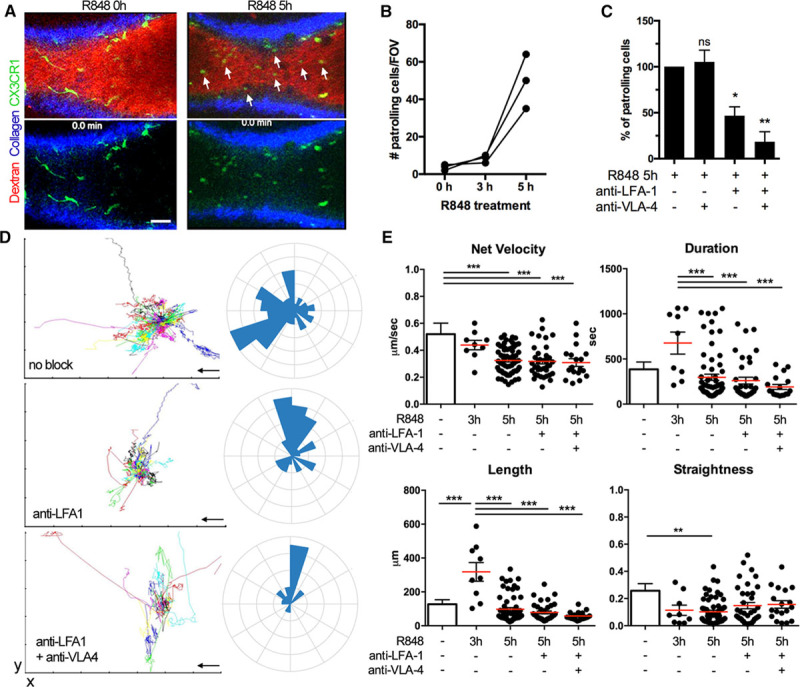
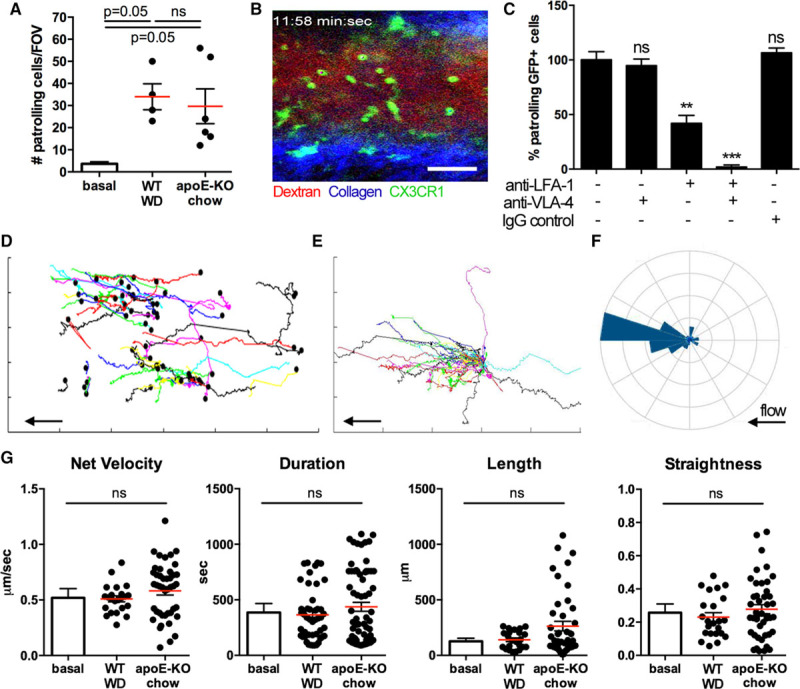
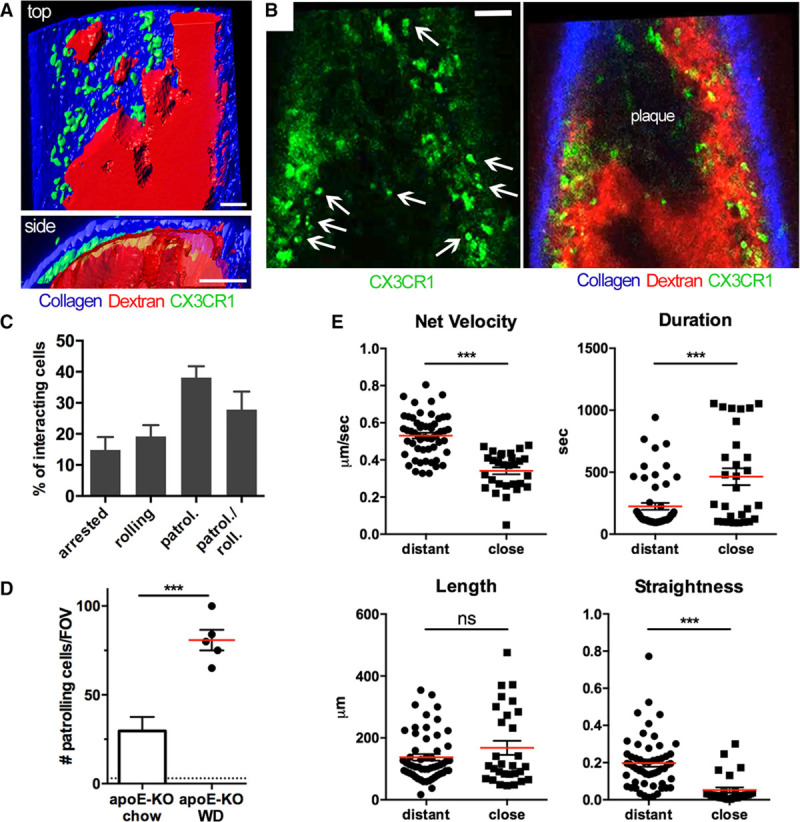
Rationale: Nonclassical mouse monocyte (CX3CR1 high , Ly-6C low ) patrolling along the vessels of the microcirculation is critical for endothelial homeostasis and inflammation. Because of technical challenges, it is currently not established how patrolling occurs in large arteries. Objective: This study was undertaken to elucidate the molecular, migratory, and functional phenotypes of patrolling monocytes in the high shear and pulsatile environment of large arteries in healthy, hyperlipidemic, and atherosclerotic conditions. Methods and Results: Applying a new method for stable, long-term 2-photon intravital microscopy of unrestrained large arteries in live CX3CR1-GFP (green fluorescent protein) mice, we show that nonclassical monocytes patrol inside healthy carotid arteries at a velocity of 36 μm/min, 3× faster than in microvessels. The tracks are less straight but lead preferentially downstream. The number of patrolling monocytes is increased 9-fold by feeding wild-type mice a Western diet or by applying topical TLR7/8 (Toll-like receptor) agonists. A similar increase is seen in CX3CR1 +/GFP /apoE −/− mice on chow diet, with a further 2- to 3-fold increase on Western diet (22-fold over healthy). In plaque conditions, monocytes are readily captured onto the endothelium from free flow. Stable patrolling is unaffected in CX3CR1-deficient mice and involves the contribution of LFA-1 (lymphocyte-associated antigen 1) and α 4 integrins. The endothelial damage in atherosclerotic carotid arteries was assessed by electron microscopy and correlates with the number of intraluminal patrollers. Abolishing patrolling monocytes in Nr4a1 −/− apoE −/− mice leads to pronounced endothelial apoptosis. Conclusions: Arterial patrolling is a prominent new feature of nonclassical monocytes with unique molecular and kinetic properties. It is highly upregulated in hyperlipidemia and atherosclerosis in a CX3CR1-independent fashion and plays a potential role in endothelial protection.

Overview

The claims and statistics of this paper haven’t been checked yet.

Run the check — free, no account needed. It reads the open-access text and checks the sources it cites.

A few free checks a day · papers already verified open instantly · results are public

Integrity signals

Registry

Crossref · 10.1161/circresaha.117.310739

Cites

37 of 37 references verified0 citation errors · 0 not checkable

Statistics

Figures

Figure 1. Nonclassical monocytes patrol healthy arteries. A, Three-dimensional (3D) reconstruction showing a CX3CR1-GFPhigh (green fluorescent protein) monocyte (arrow) patrolling in the lumen of the external carotid artery of a 3-mo-old CX3CR1+/GFP reporter mouse. The image was acquired in a nonbeating artery in situ shortly after an intravital recording. Few tissue-resident CX3CR1-GFPhigh macrophages are visible in the media/adventitia (right, triangle). Scale bar=50 μm. B, Time-lapse images of a patrolling monocyte (arrow) moving along the endothelium of the carotid artery in a live CX3CR1+/GFP mouse at a heart rate of 380 bpm. Blood flow from right to left. Scale bar=50 μm. C, Kinetic features of monocytes patrolling healthy arteries. Each dot represents 1 cell. Mean and SEM shown for 15 patrollers in 5 animals.
Figure 1. Nonclassical monocytes patrol healthy arteries. A, Three-dimensional (3D) reconstruction showing a CX3CR1-GFPhigh (green fluorescent protein) monocyte (arrow) patrolling in the lumen of the external carotid artery of a 3-mo-old CX3CR1+/GFP reporter mouse. The image was acquired in a nonbeating artery in situ shortly after an intravital recording. Few tissue-resident CX3CR1-GFPhigh macrophages are visible in the media/adventitia (right, triangle). Scale bar=50 μm. B, Time-lapse images of a patrolling monocyte (arrow) moving along the endothelium of the carotid artery in a live CX3CR1+/GFP mouse at a heart rate of 380 bpm. Blood flow from right to left. Scale bar=50 μm. C, Kinetic features of monocytes patrolling healthy arteries. Each dot represents 1 cell. Mean and SEM shown for 15 patrollers in 5 animals.CC BY-NC-ND · PubMed Central
Figure 2. Arterial patrolling induced by the TLR7/8 (Toll-like receptor) agonist R848. A, Patrollers in the carotid artery imaged before and after topical application of the TLR7/8 agonist R848. The red channel is omitted in the bottom row. Scale bar=50 μm. Arrows indicate patrolling CX3CR1-GFPhigh (green fluorescent protein) cells. B, Quantification of patrolling CX3CR1-GFPhigh cells in the carotid artery after R848 stimulation assessed by intravital microscopy. The time course in 3 animals is shown. C, Impact of function blocking anti-LFA-1 (lymphocyte-associated antigen 1) and anti-VLA-4 (very-late antigen 4) antibodies on patrolling. After 5-h R848 treatment, antibodies were injected intravenously, and the reduction of numbers was expressed relative to untreated. One-way ANOVA with Tukey multiple comparison. *P<0.05, **P<0.01, n=3 animals. Mean±SEM shown. D, Tracks are shown as spider plots after aligning the starting positions for untreated, LFA-1, and LFA-1+VLA-4 inhibited patrollers. Rose plots visualize the overall directionality. Tracks are randomly colored. The arrow indicates the blood flow. E, Patrolling characteristics in R848- and antibody-treated conditions compared with baseline data shown in Figure 1. Every dot represents 1 cell. Data shown as mean±SEM of 3 independent experiments. One-way ANOVA corrected for multiple comparisons (Tukey). *P<0.05, ** P<0.01, *** P<0.001.
Figure 2. Arterial patrolling induced by the TLR7/8 (Toll-like receptor) agonist R848. A, Patrollers in the carotid artery imaged before and after topical application of the TLR7/8 agonist R848. The red channel is omitted in the bottom row. Scale bar=50 μm. Arrows indicate patrolling CX3CR1-GFPhigh (green fluorescent protein) cells. B, Quantification of patrolling CX3CR1-GFPhigh cells in the carotid artery after R848 stimulation assessed by intravital microscopy. The time course in 3 animals is shown. C, Impact of function blocking anti-LFA-1 (lymphocyte-associated antigen 1) and anti-VLA-4 (very-late antigen 4) antibodies on patrolling. After 5-h R848 treatment, antibodies were injected intravenously, and the reduction of numbers was expressed relative to untreated. One-way ANOVA with Tukey multiple comparison. *P<0.05, **P<0.01, n=3 animals. Mean±SEM shown. D, Tracks are shown as spider plots after aligning the starting positions for untreated, LFA-1, and LFA-1+VLA-4 inhibited patrollers. Rose plots visualize the overall directionality. Tracks are randomly colored. The arrow indicates the blood flow. E, Patrolling characteristics in R848- and antibody-treated conditions compared with baseline data shown in Figure 1. Every dot represents 1 cell. Data shown as mean±SEM of 3 independent experiments. One-way ANOVA corrected for multiple comparisons (Tukey). *P<0.05, ** P<0.01, *** P<0.001.CC BY-NC-ND · PubMed Central
Figure 3. Hyperlipidemia intensifies monocyte patrolling in arteries. A, The number of patrollers in the carotid artery was determined by intravital microscopy in CX3CR1+/GFP apoE−/− mice on chow diet (6 mo old) and CX3CR1+/GFP mice on 4 wk Western diet (WD, 3 mo old) compared with baseline as shown in Figure 1. Every dot represents 1 animal. Data as mean±SEM. One-way ANOVA with Tukey correction for multiple comparison. B, Representative image of an intravital recording. Scale bar=50 μm. C, Blocking effect of anti-LFA-1 (lymphocyte-associated antigen 1) and anti-VLA-4 (very-late antigen 4) antibodies on patrolling. One-way ANOVA with Tukey multiple comparison. n=3 animals. **P<0.01, *** P<0.001. D–F, Analysis of all patrollers in a CX3CR1+/GFP apoE−/− mouse on chow diet in a 45-min recording shown in B. Patrolling tracks are graphed with absolute (D) or relative coordinates (E). The arrow indicates the direction of the blood flow. The black dot marks the starting position. A rose plot (F) shows the directionality of patrolling (start vs end position). G, Kinetic features compared with baseline condition as shown in Figure 1. Data as mean±SEM from 4 (WD) and 6 (apoE−/−) animals. Every dot represents 1 patroller. One-way ANOVA with Tukey multiple comparison.
Figure 3. Hyperlipidemia intensifies monocyte patrolling in arteries. A, The number of patrollers in the carotid artery was determined by intravital microscopy in CX3CR1+/GFP apoE−/− mice on chow diet (6 mo old) and CX3CR1+/GFP mice on 4 wk Western diet (WD, 3 mo old) compared with baseline as shown in Figure 1. Every dot represents 1 animal. Data as mean±SEM. One-way ANOVA with Tukey correction for multiple comparison. B, Representative image of an intravital recording. Scale bar=50 μm. C, Blocking effect of anti-LFA-1 (lymphocyte-associated antigen 1) and anti-VLA-4 (very-late antigen 4) antibodies on patrolling. One-way ANOVA with Tukey multiple comparison. n=3 animals. **P<0.01, *** P<0.001. D–F, Analysis of all patrollers in a CX3CR1+/GFP apoE−/− mouse on chow diet in a 45-min recording shown in B. Patrolling tracks are graphed with absolute (D) or relative coordinates (E). The arrow indicates the direction of the blood flow. The black dot marks the starting position. A rose plot (F) shows the directionality of patrolling (start vs end position). G, Kinetic features compared with baseline condition as shown in Figure 1. Data as mean±SEM from 4 (WD) and 6 (apoE−/−) animals. Every dot represents 1 patroller. One-way ANOVA with Tukey multiple comparison.CC BY-NC-ND · PubMed Central
Figure 4. Massive patrolling in arteries with atherosclerotic plaque. A, Three-dimensional (3D) reconstruction in top down (top) and axial (bottom) view and (B) representative frames from an intravital 2D time-lapse sequence of the carotid artery of a CX3CR1+/GFP apoE−/− mouse fed Western diet (WD) for 6 wk. The plasma tracer (red) marks nonplaque regions. Intravascular CX3CR1-GFPhigh (green fluorescent protein) patrollers are marked by arrows. CX3CR1-GFPhigh macrophages are located in the vessel wall. The 3D image was recorded in a nonbeating artery. All scale bars=50 μm. C, Relative fraction of migration phenotypes of intravascular cells in CX3CR1+/GFP apoE−/− mice fed WD for 6 wk. Patrolling/rolling indicates alternating patterns during video acquisition. n=6 animals. Data as mean±SEM. One-way ANOVA corrected for multiple comparisons (Tukey). *P<0.05, **P<0.01. D, Numbers of patrollers observed in intravital microscopy. Every symbol represents 1 animal. The bar shows data from Figure 3 as reference, and a dotted line indicates baseline (as shown in Figure 1). Unpaired t test. ***P<0.001. E, Kinetic features of patrollers distant and close to plaque areas. Data shown as mean±SEM. n=6 (chow) and 5 (WD) animals per condition. Every symbol represents 1 cell. Unpaired t test. ***P<0.001.
Figure 4. Massive patrolling in arteries with atherosclerotic plaque. A, Three-dimensional (3D) reconstruction in top down (top) and axial (bottom) view and (B) representative frames from an intravital 2D time-lapse sequence of the carotid artery of a CX3CR1+/GFP apoE−/− mouse fed Western diet (WD) for 6 wk. The plasma tracer (red) marks nonplaque regions. Intravascular CX3CR1-GFPhigh (green fluorescent protein) patrollers are marked by arrows. CX3CR1-GFPhigh macrophages are located in the vessel wall. The 3D image was recorded in a nonbeating artery. All scale bars=50 μm. C, Relative fraction of migration phenotypes of intravascular cells in CX3CR1+/GFP apoE−/− mice fed WD for 6 wk. Patrolling/rolling indicates alternating patterns during video acquisition. n=6 animals. Data as mean±SEM. One-way ANOVA corrected for multiple comparisons (Tukey). *P<0.05, **P<0.01. D, Numbers of patrollers observed in intravital microscopy. Every symbol represents 1 animal. The bar shows data from Figure 3 as reference, and a dotted line indicates baseline (as shown in Figure 1). Unpaired t test. ***P<0.001. E, Kinetic features of patrollers distant and close to plaque areas. Data shown as mean±SEM. n=6 (chow) and 5 (WD) animals per condition. Every symbol represents 1 cell. Unpaired t test. ***P<0.001.CC BY-NC-ND · PubMed Central
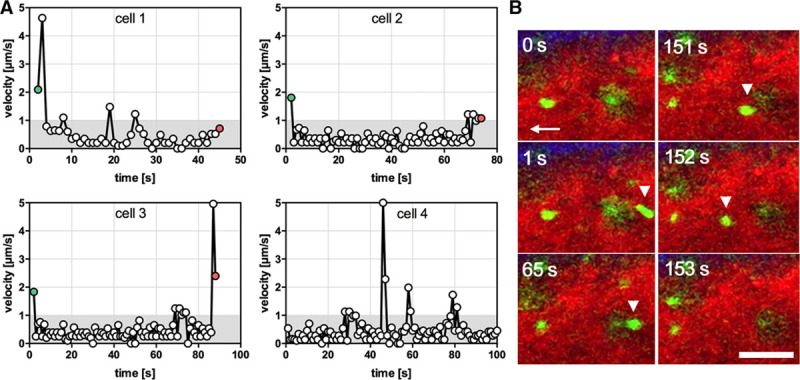
Figure 5. Microkinetics and primary monocyte capture in atherosclerotic arteries. A, Velocity profiles of 4 individual cells patrolling in atherosclerotic vessels over time (time resolution 1 frame/s). Cells 1 to 3 are captured from free flow and show short-term patrolling (< 90 s), whereas cell 4 continues patrolling with an intermittent jump. Green dots indicate capture of a blood-borne cell and red dots detachment. Grayed areas indicate that velocities <1 μm/s cannot be highly resolved. B, Imaging data of a CX3CR1-GFPhigh (green fluorescent protein) patroller captured from free flow, followed by arrest, patrolling, and a short rolling phase before detachment. Scale bar=50 μm. See also Online Movies III and IV.
Figure 5. Microkinetics and primary monocyte capture in atherosclerotic arteries. A, Velocity profiles of 4 individual cells patrolling in atherosclerotic vessels over time (time resolution 1 frame/s). Cells 1 to 3 are captured from free flow and show short-term patrolling (< 90 s), whereas cell 4 continues patrolling with an intermittent jump. Green dots indicate capture of a blood-borne cell and red dots detachment. Grayed areas indicate that velocities <1 μm/s cannot be highly resolved. B, Imaging data of a CX3CR1-GFPhigh (green fluorescent protein) patroller captured from free flow, followed by arrest, patrolling, and a short rolling phase before detachment. Scale bar=50 μm. See also Online Movies III and IV.CC BY-NC-ND · PubMed Central
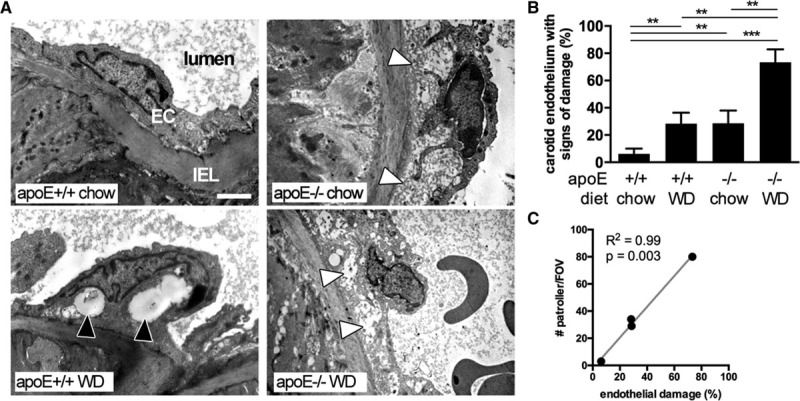
Figure 6. Correlation of monocyte patrolling and endothelial damage during atherogenesis. A and B, Morphological signs of endothelial cell damage were assessed in control and apoE−/− mice with chow or Western diet (WD, 6 wk) using transmission electron microscopy of carotid arteries. White and black arrows indicate cytoplasmatic edema and vacuolization, respectively. More images shown in the Online Figure V. B, Quantification of the extent of the endothelial damage, n=2/3/2/5 animals (for each condition indicated) with 12 to 15 sections each. One-way ANOVA with Tukey multiple comparison. **P<0.01, ***P<0.001. C, Linear regression of endothelial cell damage as shown in (B) and active patrolling monocytes (per field of view) observed in situ by intravital microscopy. Pearson correlation, R2, and P value indicated. EC indicates endothelial cell layer; and IEL, internal elastic lamina.
Figure 6. Correlation of monocyte patrolling and endothelial damage during atherogenesis. A and B, Morphological signs of endothelial cell damage were assessed in control and apoE−/− mice with chow or Western diet (WD, 6 wk) using transmission electron microscopy of carotid arteries. White and black arrows indicate cytoplasmatic edema and vacuolization, respectively. More images shown in the Online Figure V. B, Quantification of the extent of the endothelial damage, n=2/3/2/5 animals (for each condition indicated) with 12 to 15 sections each. One-way ANOVA with Tukey multiple comparison. **P<0.01, ***P<0.001. C, Linear regression of endothelial cell damage as shown in (B) and active patrolling monocytes (per field of view) observed in situ by intravital microscopy. Pearson correlation, R2, and P value indicated. EC indicates endothelial cell layer; and IEL, internal elastic lamina.CC BY-NC-ND · PubMed Central
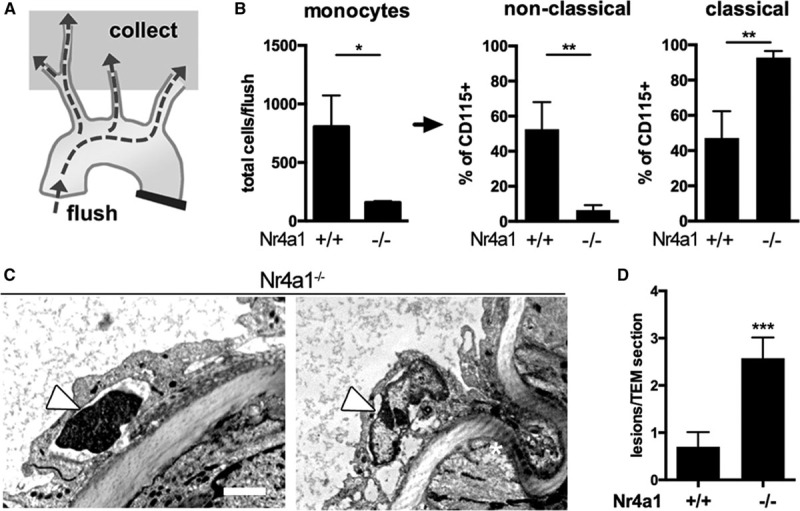
Figure 7. Enhanced endothelial damage in atherosclerotic arteries of patroller-deficient Nr4a1−/− mice. A and B, Explanted aortas of apoE−/− Nr4a1 knockout or control mice fed 6 wk Western diet were flushed, and the flow through was analyzed by flow cytometry. n=3 per group. Unpaired t test. *P<0.05, **P<0.01. C, Transmission electron micrographs of apoE−/− Nr4a1−/− carotid arteries. Nuclear condensation (left) and chromatin fragmentation (right) are depicted as signs of severe cell damage. More images shown in the Online Figure V. D, Quantification of the severity of endothelial cell death (number of lesions per section as defined in the Method). n=3 animals with 12 to 15 sections each. Data shown as mean±SEM. Unpaired t test. ***P<0.001.
Figure 7. Enhanced endothelial damage in atherosclerotic arteries of patroller-deficient Nr4a1−/− mice. A and B, Explanted aortas of apoE−/− Nr4a1 knockout or control mice fed 6 wk Western diet were flushed, and the flow through was analyzed by flow cytometry. n=3 per group. Unpaired t test. *P<0.05, **P<0.01. C, Transmission electron micrographs of apoE−/− Nr4a1−/− carotid arteries. Nuclear condensation (left) and chromatin fragmentation (right) are depicted as signs of severe cell damage. More images shown in the Online Figure V. D, Quantification of the severity of endothelial cell death (number of lesions per section as defined in the Method). n=3 animals with 12 to 15 sections each. Data shown as mean±SEM. Unpaired t test. ***P<0.001.CC BY-NC-ND · PubMed Central

Verification

Claims the paper makes

The claims and statistics of this paper haven’t been checked yet.

Run the check — free, no account needed. It reads the open-access text and checks the sources it cites.

A few free checks a day · papers already verified open instantly · results are public

Claims other papers make about this one

Each is checked against this paper’s own text: does it say what the citing paper says it does?

Self-check

Percentages, sums and reported differences re-computed from the paper’s own numbers.

The self-check needs the paper’s full text.

Citations

Cites

Show all 37 references

Cited by

Sorted by citations

Items 101–108 of 108

Metadata

Authors
Quintar, A., McArdle, S., Wolf, D., Marki, A., Ehinger, E., Vassallo, M., Miller, J., Mikulski, Z., Ley, K., & Buscher, K.
Affiliations
  • La Jolla Institute for Immunology (US)
  • From the La Jolla Institute for Allergy and Immunology, Division of Inflammation Biology, La Jolla, CA (A.Q., S.M., D.W., A.M., E.E., M.V., J.M., Z.M., K.L., K.B.); and Centro de Microscopia Electronica, INICSA-CONICET, Facultad de Ciencias Medicas, Universidad Nacional de Cordoba, Cordoba, Argentina (A.Q.).
Corresponding author
  • Ley, Klaus
  • Buscher, Konrad
Venue
Circulation Research
Published
2017-05-26
Volume
120
Issue
11
Pages
1789-1799
ISSN
  • 0009-7330 (ISSN-L)
  • 1524-4571
OpenAlex
W2597243982
Cited by
109
References
37
Citations by year
2026: 7 · 2025: 8 · 2024: 14 · 2023: 4 · 2022: 9 · 2021: 17 · 2020: 13 · 2019: 7 · 2018: 22 · 2017: 8
FWCI
6.18
Type
journal article
Language
en
Open access
Licence
cc-by-nc-nd
Locations
  • Circulation Research (publishedVersion, cc-by-nc-nd)
  • Europe PMC (PubMed Central) (publishedVersion, other-oa)
  • PubMed Central (publishedVersion, cc-by-nc-nd)
  • PubMed (publishedVersion)
  • Americanae (AECID Library) (submittedVersion, cc-by-nc-nd)
  • LA Referencia (Red Federada de Repositorios Institucionales de Publicaciones Científicas) (submittedVersion, cc-by-nc-nd)
Funders
National Heart, Lung, and Blood Institute (R01HL115232, T32HL105373)
Topics
  • Life Sciences › Immunology and Microbiology › Immunology › Atherosclerosis and Cardiovascular Diseases
  • Health Sciences › Medicine › Immunology and Allergy › Cell Adhesion Molecules Research
  • Life Sciences › Neuroscience › Neurology › Neuroinflammation and Neurodegeneration Mechanisms
Keywords
non-classical monocytes, CX3CR1, endothelial homeostasis, atherosclerosis, Western diet, hyperlipidemia, large arteries, carotid artery, endothelial injury, endothelial cell apoptosis, Nur77, LFA-1, CD49d, TLR agonists, monocyte migration, intravital microscopy
MeSH terms
CX3C Chemokine Receptor 1, Animals, Arteries, Endothelium, Vascular, Mice, Inbred C57BL, Monocytes, Mice, Knockout, Receptors, Chemokine, Atherosclerosis, Mice, Diet, Western

About these checks

Registry, retraction, Cites and statistics results are computed, not judged, with one exception: a printed reference that no index lists is read once by a model before it counts as a citation error. Claims are extracted by a model and kept only when their quote appears verbatim in the text; each cited source is then checked, with a model’s help, for whether it says what the claim relies on. Those verdicts can be wrong — read the claim’s quote and the cited source before relying on one.

Statistics and arithmetic are recomputed, not judged.

Confidence bands are shown only for fields calibrated on our annotated test set. None is calibrated yet, so no band is shown.

What counts as a claim ›How we measure confidence ›How we check this ›

Are you an author, or do you see a problem with this page? Request a review