

The DOI matches its Crossref record; 23 of the 23 references it cites were found in a registry or an index; none of the 20 sources its claims cite is checked for support yet.
Dysbiosis of gut microbiota with reduced trimethylamine-N-oxide level in patients with large-artery atherosclerotic stroke or transient ischemic attack
Open accessAbstract
Background: Gut microbiota has been suggested to play a role in almost all major diseases including cardio‐ and cerebrovascular diseases. A possible mechanism is the transformation of dietary choline and l ‐carnitine into trimethylamine by gut bacteria. This metabolite is further oxidized into trimethylamine‐N‐oxide ( TMAO ) in liver and promotes atherogenesis. Nevertheless, little is known about gut microbial diversity and blood TMAO levels in stroke patients. Methods and Results: We performed a case‐control study of patients with large‐artery atherosclerotic ischemic stroke and transient ischemic attack. TMAO was determined with liquid chromatography tandem mass spectrometry. Gut microbiome was profiled using Illumina sequencing of the 16S rRNA V4 tag. Within the asymptomatic control group, participants with and without carotid atherosclerotic plaques showed similar levels of TMAO without a significant difference in gut microbiota; however, the gut microbiome of stroke and transient ischemic attack patients was clearly different from that of the asymptomatic group. Stroke and transient ischemic attack patients had more opportunistic pathogens, such as Enterobacter , Megasphaera , Oscillibacter , and Desulfovibrio , and fewer commensal or beneficial genera including Bacteroides , Prevotella , and Faecalibacterium . This dysbiosis was correlated with the severity of the disease. The TMAO level in the stroke and transient ischemic attack patients was significantly lower, rather than higher, than that of the asymptomatic group. Conclusions: Participants with asymptomatic atherosclerosis did not exhibit an obvious change in gut microbiota and blood TMAO levels; however, stroke and transient ischemic attack patients showed significant dysbiosis of the gut microbiota, and their blood TMAO levels were decreased.
Overview
AI snapshot
Written from the paper’s full text.
TL;DR
In a Chinese case-control study, large-artery atherosclerotic stroke/TIA patients showed gut microbiota dysbiosis and significantly lower blood TMAO than asymptomatic controls. Asymptomatic participants with carotid atherosclerosis did not show clear gut microbiota or TMAO differences from those without.
Key findings
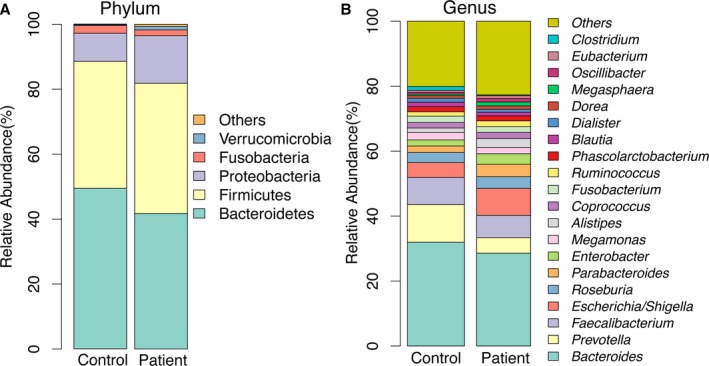
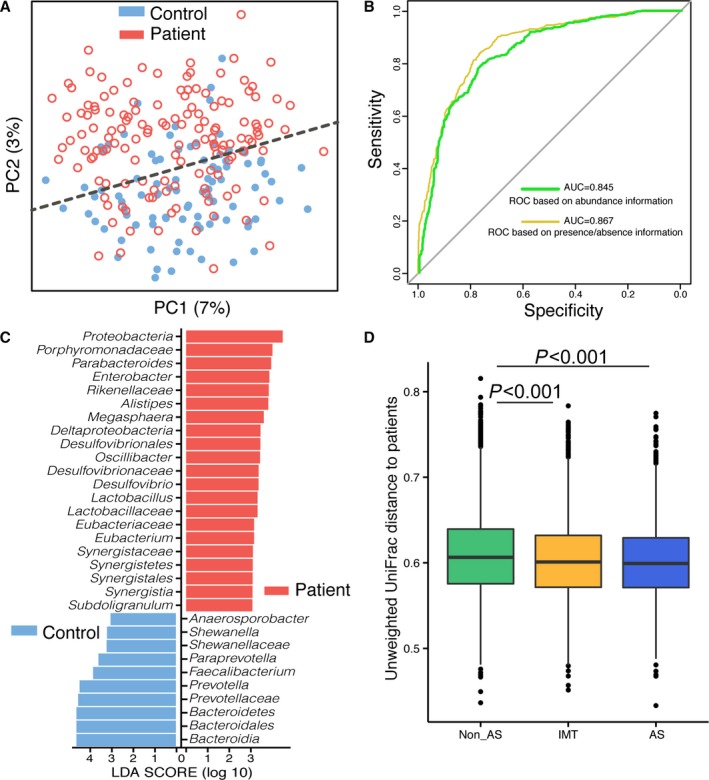
- Stroke/TIA patients had a distinct gut microbiome from asymptomatic controls, with more opportunistic pathogens such as *Enterobacter*, *Megasphaera*, *Oscillibacter*, and *Desulfovibrio*, and fewer commensal/beneficial genera including *Bacteroides*, *Prevotella*, and *Faecalibacterium*. LEfSe also showed increased Proteobacteria and reduced *Bacteroides*, *Prevotella*, and *Faecalibacterium* in patients.
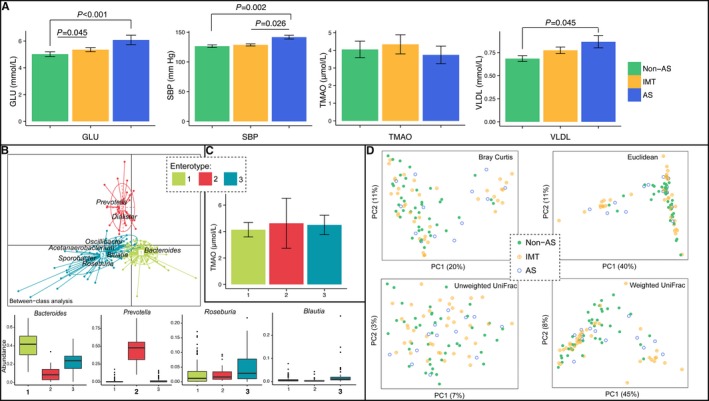
- Within asymptomatic controls, the non-AS, IMT, and AS subgroups showed no significant TMAO difference (median TMAO 2.68, 2.63, and 2.92 μmol/L, respectively; P=0.999) and no obvious gut microbiota grouping by PCoA.
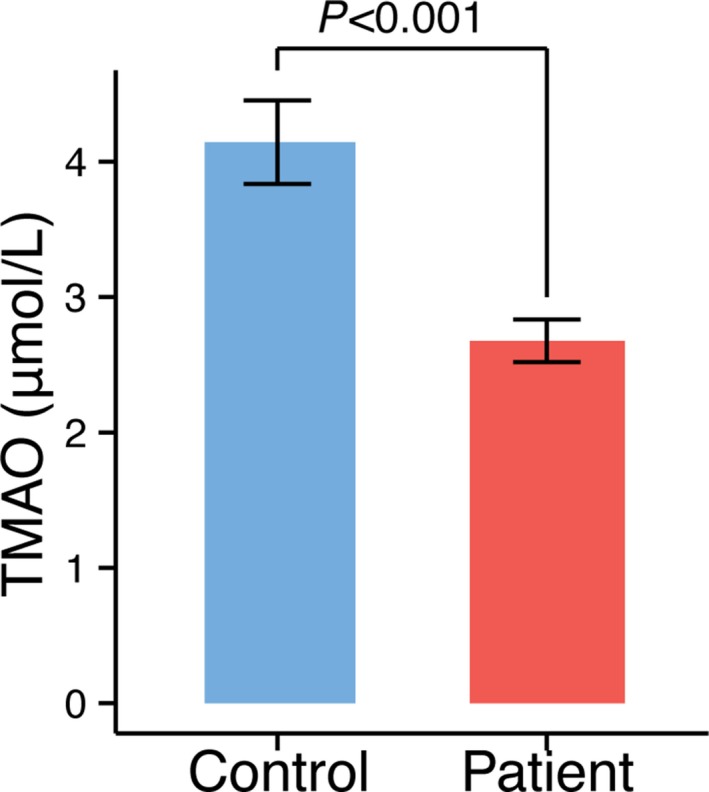
- TMAO was significantly lower in stroke/TIA patients than in asymptomatic controls (P<0.001); the text reports patient average and median TMAO levels of 2.68 and 1.91 μmol/L, respectively.
- Dysbiosis correlated with stroke severity: severe stroke (NIHSS >4) differed from mild stroke (NIHSS ≤4) in phylogenetic diversity (P=0.014) and overall microbiota by Adonis (P=0.034), with Proteobacteria more abundant and *Bacteroides* depleted in severe stroke.
Methods
- Case-control study conducted February 2014–February 2015 at Nanfang Hospital, southern China. It recruited 322 large-artery atherosclerotic ischemic stroke/TIA patients and 231 asymptomatic controls for blood samples; fecal samples were available from 141 patients and 97 controls by the text (Table 1 lists 94 controls).
- Plasma TMAO was measured by stable isotope dilution liquid chromatography tandem mass spectrometry. Gut microbiome was profiled by Illumina MiSeq sequencing of the 16S rRNA V4 region, with QIIME, PCoA, random forest classification, and LEfSe analyses.
- Statistical comparisons used Wilcoxon rank sum, Kruskal–Wallis with Nemenyi pairwise tests, chi-square, and Adonis; P<0.05 was considered significant.
Limitations
- The paper states that patients and controls were not well balanced for age and sex; although 47 age- and sex-matched pairs still separated by microbiota, the original imbalance remains. It also states that only 9 TIA patients were enrolled, so the negative stroke-vs-TIA comparison needs larger studies.
- The paper states that all samples came from stroke inpatients, so it cannot determine whether gut microbiota changes or lower TMAO occurred before stroke/TIA or were caused by the event/treatment; earliest samples were about 14 hours after the event, with too few early samples for analysis.
- Evident from the text: Table 1’s TMAO row appears inconsistent with the abstract/text direction of lower TMAO in patients, and the control fecal sample count differs between the text (97) and Table 1 (94).
Model-written summary. Check it against the paper before relying on it.
Integrity signals
Registry
Cites
Statistics
Figures
Verification
Claims the paper makes
32 Own result · 11 Not checked yet · 7 Own method · 6 Own interpretation
A result the paper reports from its own data — it cites no other source for it, so there is none to check. The quote shows it is in the paper.
In the paper
“Within the asymptomatic control group, participants with and without carotid atherosclerotic plaques showed similar levels of TMAO without a significant difference in gut microbiota”
- Also stated in: § Results · plain
“No significant difference was observed for the TMAO levels among the 3 groups (Figure 1A)”
- Also stated in: § Results · plain
“TMAO, μmol/L | 2.68 (3.50) | 2.63 (3.63) | 2.92 (3.35) | 0.999”
§ Dysbiosis of Gut Microbiota With Reduced Trimethylamine‐N‐Oxide Level in Patients With Large‐Artery Atherosclerotic Stroke or Transient Ischemic Attack > Abstract > Methods and Results
plainn = 48- Asserted: passes — The authors put it forward as true.
- Checkable: passes — It can be checked against evidence.
- Load-bearing: unclear — It is unclear whether the paper’s conclusions depend on it.
- Based: passes — The paper gives a reason why it holds.
- Rests on an assumption: The observed differences in gut microbiota and TMAO between stroke/TIA patients and controls are not due to differences in age, sex, or comorbidities (e.g., diabetes, hypertension) between the groups.
- Also stated in: § Results · plain
A result the paper reports from its own data — it cites no other source for it, so there is none to check. The quote shows it is in the paper.
In the paper
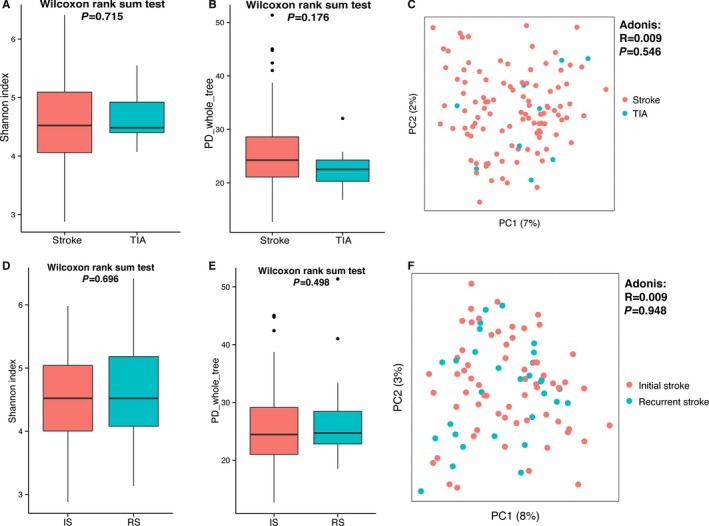
“We also tested whether the gut microbiota of initial stroke patients differed from that of recurrent stroke patients, and the results showed that this effect was very limited, according to α‐ and β‐diversity analyses (Figure 7D through 7F).”
§ Dysbiosis of Gut Microbiota With Reduced Trimethylamine‐N‐Oxide Level in Patients With Large‐Artery Atherosclerotic Stroke or Transient Ischemic Attack > Results
plain- Asserted: passes — The authors put it forward as true.
- Checkable: passes — It can be checked against evidence.
- Load-bearing: unclear — It is unclear whether the paper’s conclusions depend on it.
- Based: passes — The paper gives a reason why it holds.
A result the paper reports from its own data — it cites no other source for it, so there is none to check. The quote shows it is in the paper.
In the paper
“the gut microbiome of stroke and transient ischemic attack patients was clearly different from that of the asymptomatic group”
- Also stated in: § Results · boosted
“the stroke and TIA patients showed clearly different gut microbiota than that of asymptomatic controls”
- Also stated in: § Results · hedged
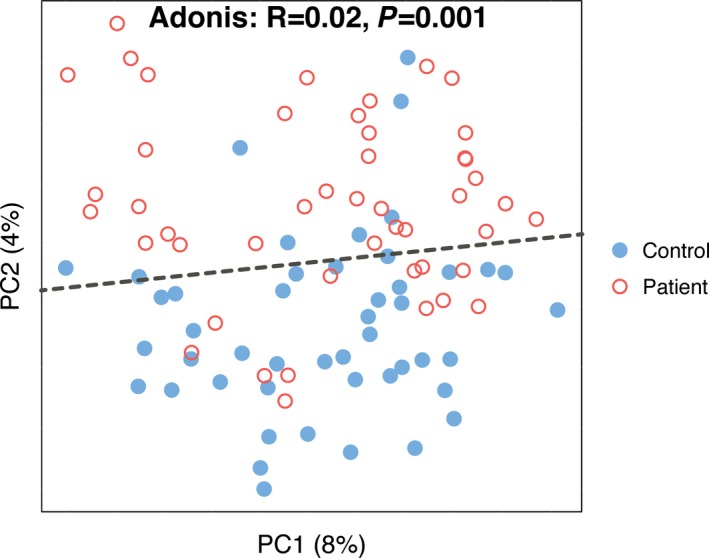
“The difference of the microbiome communities between the 2 groups could be observed using both traditional PCoA (Figure 4A) and machine learning with the random forest method (Figure 4B).”
§ Dysbiosis of Gut Microbiota With Reduced Trimethylamine‐N‐Oxide Level in Patients With Large‐Artery Atherosclerotic Stroke or Transient Ischemic Attack > Abstract > Methods and Results
boostedcorrelational- Asserted: passes — The authors put it forward as true.
- Checkable: passes — It can be checked against evidence.
- Load-bearing: passes — The paper’s conclusions depend on it.
- Based: passes — The paper gives a reason why it holds.
- Rests on an assumption: The observed differences in gut microbiota and TMAO between stroke/TIA patients and controls are not due to differences in age, sex, or comorbidities (e.g., diabetes, hypertension) between the groups.
- Rests on an assumption: The gut microbiota composition from a single fecal sample is representative of the participant's gut microbiota at the time relevant to stroke/TIA.
- Also stated in: § Results · boosted
A result the paper reports from its own data — it cites no other source for it, so there is none to check. The quote shows it is in the paper.
In the paper
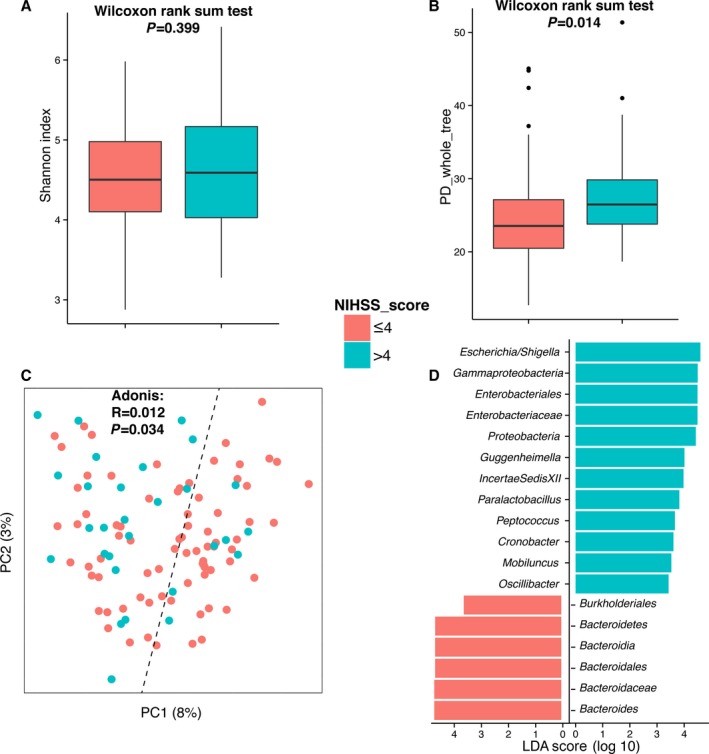
“The α‐diversity of severe stroke patients (NIHSS score >4) was higher than that of mild stroke patients (NIHSS score ≤4) based on phylogenetic diversity whole tree (23.54 versus 26.47, P=0.014) (Figure 8A and 8B).”
§ Dysbiosis of Gut Microbiota With Reduced Trimethylamine‐N‐Oxide Level in Patients With Large‐Artery Atherosclerotic Stroke or Transient Ischemic Attack > Results
plaincorrelational- Asserted: passes — The authors put it forward as true.
- Checkable: passes — It can be checked against evidence.
- Load-bearing: unclear — It is unclear whether the paper’s conclusions depend on it.
- Based: passes — The paper gives a reason why it holds.
A result the paper reports from its own data — it cites no other source for it, so there is none to check. The quote shows it is in the paper.
In the paper
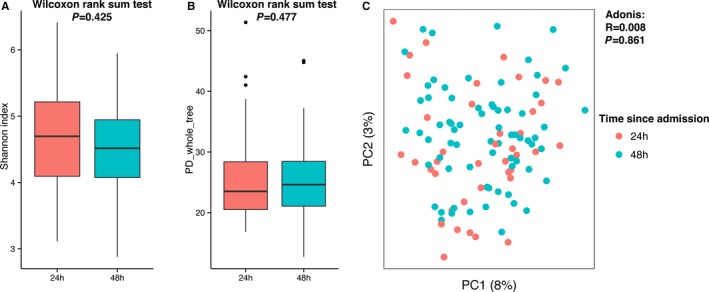
“According to the α‐ and β‐diversity analyses, there was no difference between the 2 groups (Figure 5), indicating that those changes happened earlier than our first sampling time.”
§ Dysbiosis of Gut Microbiota With Reduced Trimethylamine‐N‐Oxide Level in Patients With Large‐Artery Atherosclerotic Stroke or Transient Ischemic Attack > Results
plain- Asserted: passes — The authors put it forward as true.
- Checkable: passes — It can be checked against evidence.
- Load-bearing: passes — The paper’s conclusions depend on it.
- Based: passes — The paper gives a reason why it holds.
A result the paper reports from its own data — it cites no other source for it, so there is none to check. The quote shows it is in the paper.
In the paper
“This dysbiosis was correlated with the severity of the disease.”
§ Dysbiosis of Gut Microbiota With Reduced Trimethylamine‐N‐Oxide Level in Patients With Large‐Artery Atherosclerotic Stroke or Transient Ischemic Attack > Abstract > Methods and Results
plaincorrelational- Asserted: passes — The authors put it forward as true.
- Checkable: passes — It can be checked against evidence.
- Load-bearing: passes — The paper’s conclusions depend on it.
- Based: passes — The paper gives a reason why it holds.
- Rests on an assumption: The observed differences in gut microbiota and TMAO between stroke/TIA patients and controls are not due to differences in age, sex, or comorbidities (e.g., diabetes, hypertension) between the groups.
- Rests on an assumption: The gut microbiota composition from a single fecal sample is representative of the participant's gut microbiota at the time relevant to stroke/TIA.
A result the paper reports from its own data — it cites no other source for it, so there is none to check. The quote shows it is in the paper.
In the paper
“This was confirmed by the Adonis test (P=0.034).”
§ Dysbiosis of Gut Microbiota With Reduced Trimethylamine‐N‐Oxide Level in Patients With Large‐Artery Atherosclerotic Stroke or Transient Ischemic Attack > Results
plaincorrelational- Asserted: passes — The authors put it forward as true.
- Checkable: passes — It can be checked against evidence.
- Load-bearing: unclear — It is unclear whether the paper’s conclusions depend on it.
- Based: passes — The paper gives a reason why it holds.
A result the paper reports from its own data — it cites no other source for it, so there is none to check. The quote shows it is in the paper.
In the paper
“without a significant difference in gut microbiota”
- Also stated in: § Results · plain
“the PCoA (a dimensionality reduction method illustrating the relationship between samples based on distance matrix) using any distances did not show obvious grouping of the non‐AS, IMT, and AS participants among the asymptomatic controls by gut microbiota (Figure 1D).”
§ Dysbiosis of Gut Microbiota With Reduced Trimethylamine‐N‐Oxide Level in Patients With Large‐Artery Atherosclerotic Stroke or Transient Ischemic Attack > Abstract > Methods and Results
plain- Asserted: passes — The authors put it forward as true.
- Checkable: passes — It can be checked against evidence.
- Load-bearing: passes — The paper’s conclusions depend on it.
- Based: passes — The paper gives a reason why it holds.
- Rests on an assumption: The observed differences in gut microbiota and TMAO between stroke/TIA patients and controls are not due to differences in age, sex, or comorbidities (e.g., diabetes, hypertension) between the groups.
- Also stated in: § Results · plain
A result the paper reports from its own data — it cites no other source for it, so there is none to check. The quote shows it is in the paper.
In the paper
“the high values for area under the receiver operating characteristic curve using both weighted and unweighted taxonomy information suggested that the gut microbiome of stroke and TIA patients could be differentiated from that of controls with high specificity and sensitivity.”
§ Dysbiosis of Gut Microbiota With Reduced Trimethylamine‐N‐Oxide Level in Patients With Large‐Artery Atherosclerotic Stroke or Transient Ischemic Attack > Results
hedgedcorrelational- Asserted: passes — The authors put it forward as true.
- Checkable: passes — It can be checked against evidence.
- Load-bearing: passes — The paper’s conclusions depend on it.
- Based: passes — The paper gives a reason why it holds.
- Rests on an assumption: The observed differences in gut microbiota and TMAO between stroke/TIA patients and controls are not due to differences in age, sex, or comorbidities (e.g., diabetes, hypertension) between the groups.
- Rests on an assumption: The gut microbiota composition from a single fecal sample is representative of the participant's gut microbiota at the time relevant to stroke/TIA.
A result the paper reports from its own data — it cites no other source for it, so there is none to check. The quote shows it is in the paper.
In the paper
“we observed that the severity of stroke, which is classified by National Institutes of Health Stroke Scale (NIHSS) score, correlated with gut microbiota.”
§ Dysbiosis of Gut Microbiota With Reduced Trimethylamine‐N‐Oxide Level in Patients With Large‐Artery Atherosclerotic Stroke or Transient Ischemic Attack > Results
plaincorrelational- Asserted: passes — The authors put it forward as true.
- Checkable: passes — It can be checked against evidence.
- Load-bearing: unclear — It is unclear whether the paper’s conclusions depend on it.
- Based: passes — The paper gives a reason why it holds.
- Probably not a substantial claim. 12
- It may state two separate claims as one. 12
- The quote only partly states this claim. 3
A result the paper reports from its own data — it cites no other source for it, so there is none to check. The quote shows it is in the paper.
In the paper
“The gut microbiome samples could be classified into 3 enterotypes, which were dominated by Bacteroides, Prevotella, and others (mainly Roseburia and Blautia in the present study) (Figure 1B).”
§ Dysbiosis of Gut Microbiota With Reduced Trimethylamine‐N‐Oxide Level in Patients With Large‐Artery Atherosclerotic Stroke or Transient Ischemic Attack > Results
hedged- Asserted: passes — The authors put it forward as true.
- Checkable: passes — It can be checked against evidence.
- Load-bearing: fails — The paper’s conclusions may not depend on it.
- Based: passes — The paper gives a reason why it holds.
Probably not a substantial claim. The paper’s conclusions may not depend on it.
- Rests on an assumption: The gut microbiota composition from a single fecal sample is representative of the participant's gut microbiota at the time relevant to stroke/TIA.
A result the paper reports from its own data — it cites no other source for it, so there is none to check. The quote shows it is in the paper.
In the paper
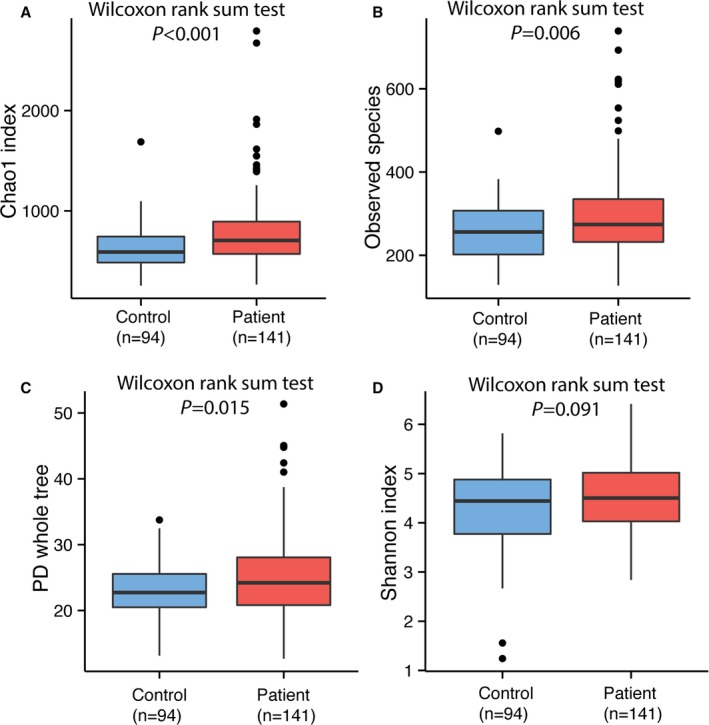
“Chao1, observed species, and phylogenetic diversity whole tree reached statistical significance using the Wilcoxon rank sum test”
§ Dysbiosis of Gut Microbiota With Reduced Trimethylamine‐N‐Oxide Level in Patients With Large‐Artery Atherosclerotic Stroke or Transient Ischemic Attack > Results
plaincorrelational- Asserted: passes — The authors put it forward as true.
- Checkable: passes — It can be checked against evidence.
- Load-bearing: passes — The paper’s conclusions depend on it.
- Based: passes — The paper gives a reason why it holds.
It may state two separate claims as one. The quote only partly states this claim.
- Rests on an assumption: The observed differences in gut microbiota and TMAO between stroke/TIA patients and controls are not due to differences in age, sex, or comorbidities (e.g., diabetes, hypertension) between the groups.
- Rests on an assumption: The gut microbiota composition from a single fecal sample is representative of the participant's gut microbiota at the time relevant to stroke/TIA.
A result the paper reports from its own data — it cites no other source for it, so there is none to check. The quote shows it is in the paper.
In the paper
“the average level of the 3 groups was ≈4.14 μmol/L, with a median value of 2.71 μmol/L”
§ Dysbiosis of Gut Microbiota With Reduced Trimethylamine‐N‐Oxide Level in Patients With Large‐Artery Atherosclerotic Stroke or Transient Ischemic Attack > Results
plain- Asserted: fails — The authors may not put it forward as true.
- Checkable: passes — It can be checked against evidence.
- Load-bearing: fails — The paper’s conclusions may not depend on it.
- Based: fails — The paper may give no reason why it holds.
Probably not a substantial claim. The authors may not put it forward as true. The paper’s conclusions may not depend on it. The paper may give no reason why it holds. It may state two separate claims as one. The quote only partly states this claim.
A result the paper reports from its own data — it cites no other source for it, so there is none to check. The quote shows it is in the paper.
In the paper
“we observed that samples of severe stroke patients tended to be located in the left region of PCoA, whereas those of mild stroke patients tended to be located in the right region (Figure 8C).”
§ Dysbiosis of Gut Microbiota With Reduced Trimethylamine‐N‐Oxide Level in Patients With Large‐Artery Atherosclerotic Stroke or Transient Ischemic Attack > Results
hedgedcorrelational- Asserted: passes — The authors put it forward as true.
- Checkable: passes — It can be checked against evidence.
- Load-bearing: unclear — It is unclear whether the paper’s conclusions depend on it.
- Based: passes — The paper gives a reason why it holds.
It may state two separate claims as one.
A result the paper reports from its own data — it cites no other source for it, so there is none to check. The quote shows it is in the paper.
In the paper
“The average and median TMAO levels of stroke/TIA patients were only 2.68 μmol/L and 1.91 μmol/L, respectively, which were comparable to quartile 1 in a US cohort.5”
§ Dysbiosis of Gut Microbiota With Reduced Trimethylamine‐N‐Oxide Level in Patients With Large‐Artery Atherosclerotic Stroke or Transient Ischemic Attack > Results
plainn = 322- Asserted: passes — The authors put it forward as true.
- Checkable: passes — It can be checked against evidence.
- Load-bearing: passes — The paper’s conclusions depend on it.
- Based: passes — The paper gives a reason why it holds.
It may state two separate claims as one.
In the paper
“It has been reported, using pyrosequencing of 16S rRNA tags, that atherosclerotic patients in the United States had similar gut microbiota to that of controls,22 and our present results from a Chinese population are consistent with that report.”
§ Dysbiosis of Gut Microbiota With Reduced Trimethylamine‐N‐Oxide Level in Patients With Large‐Artery Atherosclerotic Stroke or Transient Ischemic Attack > Discussion
What the sources say
- Not checked yetcites [22] Koren O, Spor A, Felin J, Fåk F, Stombaugh J, Tremaroli V, Behre CJ, Knight R, Fagerberg B, Ley RE, Bäckhed F. Human oral, gut, and plaque microbiota in patients with atherosclerosis. Proc Natl Acad Sci USA. 2011; 108(suppl 1): 4592– 4598. 20937873 PMC3063583 source
plain- Asserted: passes — The authors put it forward as true.
- Checkable: passes — It can be checked against evidence.
- Load-bearing: unclear — It is unclear whether the paper’s conclusions depend on it.
- Based: passes — The paper gives a reason why it holds.
It may state two separate claims as one.
What the paper did — it cites no source for this, so there is none to check. The quote shows it is in the paper.
In the paper
“Male, n (%) | 220 (68.3) | 130 (56.3) | 0.004”
- Also stated in: § Results · plain
“Age, y | 61 (19) | 56 (11) | <0.001”
- Also stated in: § Results · plain
“History of diabetes, n (%) | 125 (38.8) | 20 (8.66) | <0.001”
§ Dysbiosis of Gut Microbiota With Reduced Trimethylamine‐N‐Oxide Level in Patients With Large‐Artery Atherosclerotic Stroke or Transient Ischemic Attack > Results
plaincorrelationaln = 322 ·- Asserted: passes — The authors put it forward as true.
- Checkable: passes — It can be checked against evidence.
- Load-bearing: unclear — It is unclear whether the paper’s conclusions depend on it.
- Based: passes — The paper gives a reason why it holds.
It may state two separate claims as one. The quote only partly states this claim.
- Also stated in: § Results · plain
What the paper did — it cites no source for this, so there is none to check. The quote shows it is in the paper.
In the paper
“None of the tested indices in the present study passed the Shapiro–Wilk normality test and the Bartlett test of homogeneity of variances at the same time; therefore, we used the Wilcoxon rank sum test or Kruskal–Wallis rank sum test (Nemenyi test for multiple pairwise comparisons) to compare ≥2 groups, respectively, in case of false‐positive statistical significance.”
§ Dysbiosis of Gut Microbiota With Reduced Trimethylamine‐N‐Oxide Level in Patients With Large‐Artery Atherosclerotic Stroke or Transient Ischemic Attack > Methods > Statistical Analyses
plain- Asserted: passes — The authors put it forward as true.
- Checkable: passes — It can be checked against evidence.
- Load-bearing: fails — The paper’s conclusions may not depend on it.
- Based: passes — The paper gives a reason why it holds.
Probably not a substantial claim. The paper’s conclusions may not depend on it. It may state two separate claims as one.
In the paper
“a metagenomic study suggested that symptomatic atherosclerosis was associated with an altered gut microbiome.8”
§ Dysbiosis of Gut Microbiota With Reduced Trimethylamine‐N‐Oxide Level in Patients With Large‐Artery Atherosclerotic Stroke or Transient Ischemic Attack > Introduction
What the sources say
- Not checked yetcites [8] Karlsson FH, Fak F, Nookaew I, Tremaroli V, Fagerberg B, Petranovic D, Bäckhed F, Nielsen J. Symptomatic atherosclerosis is associated with an altered gut metagenome. Nat Commun. 2012; 3: 1245. 23212374 PMC3538954 source
hedgedcorrelational- Asserted: passes — The authors put it forward as true.
- Checkable: passes — It can be checked against evidence.
- Load-bearing: passes — The paper’s conclusions depend on it.
- Based: passes — The paper gives a reason why it holds.
Probably not a substantial claim.
What the paper did — it cites no source for this, so there is none to check. The quote shows it is in the paper.
In the paper
“Training was achieved through 10‐fold cross‐validation and optimized using the area under the curve derived from receiver operating characteristic analysis.”
§ Dysbiosis of Gut Microbiota With Reduced Trimethylamine‐N‐Oxide Level in Patients With Large‐Artery Atherosclerotic Stroke or Transient Ischemic Attack > Methods > Sequencing and Microbiome Data Analysis
plain- Asserted: passes — The authors put it forward as true.
- Checkable: passes — It can be checked against evidence.
- Load-bearing: fails — The paper’s conclusions may not depend on it.
- Based: passes — The paper gives a reason why it holds.
Probably not a substantial claim. The paper’s conclusions may not depend on it. It may state two separate claims as one.
What the paper did — it cites no source for this, so there is none to check. The quote shows it is in the paper.
In the paper
“only 9 TIA patients were enrolled in this study”
§ Dysbiosis of Gut Microbiota With Reduced Trimethylamine‐N‐Oxide Level in Patients With Large‐Artery Atherosclerotic Stroke or Transient Ischemic Attack > Results
plainn = 9- Asserted: passes — The authors put it forward as true.
- Checkable: passes — It can be checked against evidence.
- Load-bearing: passes — The paper’s conclusions depend on it.
- Based: passes — The paper gives a reason why it holds.
Probably not a substantial claim.
What the paper did — it cites no source for this, so there is none to check. The quote shows it is in the paper.
In the paper
“our earliest samples were ≈14 hours from the event, and there were too few early stage samples to find any significant differences with those collected later.”
§ Dysbiosis of Gut Microbiota With Reduced Trimethylamine‐N‐Oxide Level in Patients With Large‐Artery Atherosclerotic Stroke or Transient Ischemic Attack > Results
plain- Asserted: passes — The authors put it forward as true.
- Checkable: passes — It can be checked against evidence.
- Load-bearing: passes — The paper’s conclusions depend on it.
- Based: passes — The paper gives a reason why it holds.
It may state two separate claims as one.
A conclusion the paper draws from its own results — it cites no other source for it, so there is none to check. The quote shows it is in the paper.
In the paper
“Participants with asymptomatic atherosclerosis did not exhibit an obvious change in gut microbiota and blood TMAO levels”
- Also stated in: § Results · hedged
“All of these analyses suggested that atherosclerosis was not related to a significantly different gut microbiome or blood TMAO level within the asymptomatic group.”
§ Dysbiosis of Gut Microbiota With Reduced Trimethylamine‐N‐Oxide Level in Patients With Large‐Artery Atherosclerotic Stroke or Transient Ischemic Attack > Abstract > Conclusions
plain- Asserted: passes — The authors put it forward as true.
- Checkable: passes — It can be checked against evidence.
- Load-bearing: passes — The paper’s conclusions depend on it.
- Based: passes — The paper gives a reason why it holds.
It may state two separate claims as one.
- Rests on an assumption: The observed differences in gut microbiota and TMAO between stroke/TIA patients and controls are not due to differences in age, sex, or comorbidities (e.g., diabetes, hypertension) between the groups.
- Also stated in: § Results · hedged
None of the sources cited for this claim have been checked yet.
In the paper
“The blood TMAO level has been reported to be positively correlated with long‐term mortality risk in patients with atherosclerosis, heart failure, and chronic kidney disease.5, 6, 7”
§ Dysbiosis of Gut Microbiota With Reduced Trimethylamine‐N‐Oxide Level in Patients With Large‐Artery Atherosclerotic Stroke or Transient Ischemic Attack > Introduction
What the sources say
- Not checked yetcites [5] Koeth RA, Wang Z, Levison BS, Buffa JA, Org E, Sheehy BT, Britt EB, Fu X, Wu Y, Li L, Smith JD, DiDonato JA, Chen J, Li H, Wu GD, Lewis JD, Warrier M, Brown JM, Krauss RM, Tang WH, Bushman FD, Lusis AJ, Hazen SL. Intestinal microbiota metabolism of L‐carnitine, a nutrient in red meat, promotes atherosclerosis. Nat Med. 2013; 19: 576– 585. 23563705 PMC3650111 source
- Not checked yetcites [6] Tang WH, Wang Z, Fan Y, Levison B, Hazen JE, Donahue LM, Wu Y, Hazen SL. Prognostic value of elevated levels of intestinal microbe‐generated metabolite trimethylamine‐N‐oxide in patients with heart failure: refining the gut hypothesis. J Am Coll Cardiol. 2014; 64: 1908– 1914. 25444145 PMC4254529 source
- Not checked yetcites [7] Tang WH, Wang Z, Kennedy DJ, Wu Y, Buffa JA, Agatisa‐Boyle B, Li XS, Levison BS, Hazen SL. Gut microbiota‐dependent trimethylamine N‐oxide (TMAO) pathway contributes to both development of renal insufficiency and mortality risk in chronic kidney disease. Circ Res. 2015; 116: 448– 455. 25599331 PMC4312512 source
plaincorrelational- Asserted: passes — The authors put it forward as true.
- Checkable: passes — It can be checked against evidence.
- Load-bearing: fails — The paper’s conclusions may not depend on it.
- Based: passes — The paper gives a reason why it holds.
Probably not a substantial claim. The paper’s conclusions may not depend on it.
None of the sources cited for this claim have been checked yet.
In the paper
“a metabolite that could promote atherogenesis partly by promoting the formation of foam cells from macrophages.4, 5”
§ Dysbiosis of Gut Microbiota With Reduced Trimethylamine‐N‐Oxide Level in Patients With Large‐Artery Atherosclerotic Stroke or Transient Ischemic Attack > Introduction
What the sources say
- Not checked yetcites [4] Tang WH, Wang Z, Levison BS, Koeth RA, Britt EB, Fu X, Wu Y, Hazen SL. Intestinal microbial metabolism of phosphatidylcholine and cardiovascular risk. N Engl J Med. 2013; 368: 1575– 1584. 23614584 PMC3701945 source
- Not checked yetcites [5] Koeth RA, Wang Z, Levison BS, Buffa JA, Org E, Sheehy BT, Britt EB, Fu X, Wu Y, Li L, Smith JD, DiDonato JA, Chen J, Li H, Wu GD, Lewis JD, Warrier M, Brown JM, Krauss RM, Tang WH, Bushman FD, Lusis AJ, Hazen SL. Intestinal microbiota metabolism of L‐carnitine, a nutrient in red meat, promotes atherosclerosis. Nat Med. 2013; 19: 576– 585. 23563705 PMC3650111 source
hedgedconditional- Asserted: passes — The authors put it forward as true.
- Checkable: passes — It can be checked against evidence.
- Load-bearing: fails — The paper’s conclusions may not depend on it.
- Based: passes — The paper gives a reason why it holds.
Probably not a substantial claim. The paper’s conclusions may not depend on it.
What the paper did — it cites no source for this, so there is none to check. The quote shows it is in the paper.
In the paper
“We did not use an age‐ and sex‐matching strategy in our selection of controls and patients but set the age range from 18 to 80 years.”
§ Dysbiosis of Gut Microbiota With Reduced Trimethylamine‐N‐Oxide Level in Patients With Large‐Artery Atherosclerotic Stroke or Transient Ischemic Attack > Methods > Research Participants and Sample Collection
plain- Asserted: passes — The authors put it forward as true.
- Checkable: passes — It can be checked against evidence.
- Load-bearing: fails — The paper’s conclusions may not depend on it.
- Based: passes — The paper gives a reason why it holds.
Probably not a substantial claim. The paper’s conclusions may not depend on it.
None of the sources cited for this claim have been checked yet.
In the paper
“In particular, Faecalibacterium has been widely recognized as a critical butyrate acid–producing beneficial bacterium that is reduced in many diseases.2, 3, 23”
§ Dysbiosis of Gut Microbiota With Reduced Trimethylamine‐N‐Oxide Level in Patients With Large‐Artery Atherosclerotic Stroke or Transient Ischemic Attack > Discussion
What the sources say
- Not checked yetcites [2] Qin J, Li Y, Cai Z, Li S, Zhu J, Zhang F, Liang S, Zhang W, Guan Y, Shen D, Peng Y, Zhang D, Jie Z, Wu W, Qin Y, Xue W, Li J, Han L, Lu D, Wu P, Dai Y, Sun X, Li Z, Tang A, Zhong S, Li X, Chen W, Xu R, Wang M, Feng Q, Gong M, Yu J, Zhang Y, Zhang M, Hansen T, Sanchez G, Raes J, Falony G, Okuda S, Almeida M, LeChatelier E, Renault P, Pons N, Batto JM, Zhang Z, Chen H, Yang R, Zheng W, Li S, Yang H, Wang J, Ehrlich SD, Nielsen R, Pedersen O, Kristiansen K, Wang J. A metagenome‐wide association study of gut microbiota in type 2 diabetes. Nature. 2012; 490: 55– 60. 23023125 source
- Not checked yetcites [3] Abu‐Shanab A, Quigley EM. The role of the gut microbiota in nonalcoholic fatty liver disease. Nat Rev Gastroenterol Hepatol. 2010; 12: 691– 701. 21045794
- Not checked yetcites [23] Barcenilla A, Pryde SE, Martin JC, Duncan SH, Stewart CS, Henderson C, Flint HJ. Phylogenetic relationships of butyrate‐producing bacteria from the human gut. Appl Environ Microbiol. 2000; 66: 1654– 1661. 10742256 PMC92037
boostedcorrelational- Asserted: passes — The authors put it forward as true.
- Checkable: passes — It can be checked against evidence.
- Load-bearing: fails — The paper’s conclusions may not depend on it.
- Based: passes — The paper gives a reason why it holds.
Probably not a substantial claim. The paper’s conclusions may not depend on it. It may state two separate claims as one.
None of the sources cited for this claim have been checked yet.
In the paper
“many cohort studies have suggested that an increased number of adverse outcomes are associated with high TMAO levels,4, 5, 6, 7”
§ Dysbiosis of Gut Microbiota With Reduced Trimethylamine‐N‐Oxide Level in Patients With Large‐Artery Atherosclerotic Stroke or Transient Ischemic Attack > Discussion
What the sources say
- Not checked yetcites [4] Tang WH, Wang Z, Levison BS, Koeth RA, Britt EB, Fu X, Wu Y, Hazen SL. Intestinal microbial metabolism of phosphatidylcholine and cardiovascular risk. N Engl J Med. 2013; 368: 1575– 1584. 23614584 PMC3701945 source
- Not checked yetcites [5] Koeth RA, Wang Z, Levison BS, Buffa JA, Org E, Sheehy BT, Britt EB, Fu X, Wu Y, Li L, Smith JD, DiDonato JA, Chen J, Li H, Wu GD, Lewis JD, Warrier M, Brown JM, Krauss RM, Tang WH, Bushman FD, Lusis AJ, Hazen SL. Intestinal microbiota metabolism of L‐carnitine, a nutrient in red meat, promotes atherosclerosis. Nat Med. 2013; 19: 576– 585. 23563705 PMC3650111 source
- Not checked yetcites [6] Tang WH, Wang Z, Fan Y, Levison B, Hazen JE, Donahue LM, Wu Y, Hazen SL. Prognostic value of elevated levels of intestinal microbe‐generated metabolite trimethylamine‐N‐oxide in patients with heart failure: refining the gut hypothesis. J Am Coll Cardiol. 2014; 64: 1908– 1914. 25444145 PMC4254529 source
hedgedcorrelational- Asserted: passes — The authors put it forward as true.
- Checkable: passes — It can be checked against evidence.
- Load-bearing: fails — The paper’s conclusions may not depend on it.
- Based: passes — The paper gives a reason why it holds.
Probably not a substantial claim. The paper’s conclusions may not depend on it.
None of the sources cited for this claim have been checked yet.
In the paper
“Although the TMAO level has been suggested to be involved in atherosclerosis,4, 5”
§ Dysbiosis of Gut Microbiota With Reduced Trimethylamine‐N‐Oxide Level in Patients With Large‐Artery Atherosclerotic Stroke or Transient Ischemic Attack > Discussion
What the sources say
- Not checked yetcites [4] Tang WH, Wang Z, Levison BS, Koeth RA, Britt EB, Fu X, Wu Y, Hazen SL. Intestinal microbial metabolism of phosphatidylcholine and cardiovascular risk. N Engl J Med. 2013; 368: 1575– 1584. 23614584 PMC3701945 source
- Not checked yetcites [5] Koeth RA, Wang Z, Levison BS, Buffa JA, Org E, Sheehy BT, Britt EB, Fu X, Wu Y, Li L, Smith JD, DiDonato JA, Chen J, Li H, Wu GD, Lewis JD, Warrier M, Brown JM, Krauss RM, Tang WH, Bushman FD, Lusis AJ, Hazen SL. Intestinal microbiota metabolism of L‐carnitine, a nutrient in red meat, promotes atherosclerosis. Nat Med. 2013; 19: 576– 585. 23563705 PMC3650111 source
hedgedcorrelational- Asserted: passes — The authors put it forward as true.
- Checkable: passes — It can be checked against evidence.
- Load-bearing: fails — The paper’s conclusions may not depend on it.
- Based: passes — The paper gives a reason why it holds.
Probably not a substantial claim. The paper’s conclusions may not depend on it.
A conclusion the paper draws from its own results — it cites no other source for it, so there is none to check. The quote shows it is in the paper.
In the paper
“These findings indicate that gut microbiota changes are involved in the onset or even the severity of stroke.”
§ Dysbiosis of Gut Microbiota With Reduced Trimethylamine‐N‐Oxide Level in Patients With Large‐Artery Atherosclerotic Stroke or Transient Ischemic Attack > Discussion
hedgedcorrelational- Asserted: passes — The authors put it forward as true.
- Checkable: passes — It can be checked against evidence.
- Load-bearing: passes — The paper’s conclusions depend on it.
- Based: passes — The paper gives a reason why it holds.
It may state two separate claims as one.
The authors state this as an assumption.
Little is known about gut microbial diversity and blood TMAO levels in stroke patients.
“Nevertheless, little is known about gut microbial diversity and blood TMAO levels in stroke patients.”
“these diseases have rarely been examined with respect to TMAO level and gut microbiota.”
The paper relies on this without support.
The observed differences in gut microbiota and TMAO between stroke/TIA patients and controls are not due to differences in age, sex, or comorbidities (e.g., diabetes, hypertension) between the groups.
“stroke and transient ischemic attack patients showed significant dysbiosis of the gut microbiota”
“Male, n (%) | 220 (68.3) | 130 (56.3) | 0.004”
The paper relies on this without support.
The gut microbiota composition from a single fecal sample is representative of the participant's gut microbiota at the time relevant to stroke/TIA.
“their first available fecal samples within 48 hours after admission were collected”
The paper relies on this without support.
The blood TMAO level measured within 24 hours after admission reflects the patient's usual TMAO level and is not substantially altered by acute stroke.
“The first fasting blood samples were drawn from all participants within 24 hours after admission”
The paper relies on this without support.
No reports have examined the increase in TMAO levels in asymptomatic atherosclerosis patients.
“no reports have examined the increase in TMAO levels in asymptomatic atherosclerosis patients.”
The paper relies on this without support.
The three major depleted genera (Bacteroides, Prevotella, and Faecalibacterium) are major commensal or beneficial microbes.
“the 3 major depleted genera in the patient groups, namely, Bacteroides, Prevotella, and Faecalibacterium, are major commensal or beneficial microbes.”
Claims other papers make about this one
Each is checked against this paper’s own text: does it say what the citing paper says it does?
In the citing paper
“In a case-control study of patients with large-artery atherosclerotic ischemic stroke and transient ischemic attack, participants with asymptomatic atherosclerosis did not exhibit an obvious change in gut microbiota and blood TMAO levels; however, stroke and transient ischemic attack patients showed significant dysbiosis of the gut microbiota, and their blood TMAO levels were decreased [36].”
From Trimethylamine N-oxide: the good, the bad and the unknown. (2016) · cites this paper as [36]
In the citing paper
“Moreover, Bacteroides abundance was found to be decreased in patients with atherosclerotic ischemic stroke and transient ischemic attack.10”
From Bacteroides vulgatus and Bacteroides dorei Reduce Gut Microbial Lipopolysaccharide Production and Inhibit Atherosclerosis (2018) · cites this paper as [10]
Self-check
Percentages, sums and reported differences re-computed from the paper’s own numbers.
Each contradiction between two passages listed here was confirmed by an independent check.
Rated major: it would touch a result — a value a result rests on, reported and recomputed p-values on opposite sides of the significance level, two passages that conflict with no sign which is right, or a cited work retracted before this paper was published.
In the paper
§ Dysbiosis of Gut Microbiota With Reduced Trimethylamine‐N‐Oxide Level in Patients With Large‐Artery Atherosclerotic Stroke or Transient Ischemic Attack > Results
“| TMAO, μmol/L | 2.70 (3.47) | 1.91 (1.99) | <0.001 |”
§ Dysbiosis of Gut Microbiota With Reduced Trimethylamine‐N‐Oxide Level in Patients With Large‐Artery Atherosclerotic Stroke or Transient Ischemic Attack > Abstract > Methods and Results
“The TMAO level in the stroke and transient ischemic attack patients was significantly lower, rather than higher, than that of the asymptomatic group.”
Rated major: it would touch a result — a value a result rests on, reported and recomputed p-values on opposite sides of the significance level, two passages that conflict with no sign which is right, or a cited work retracted before this paper was published.
In the paper
§ Dysbiosis of Gut Microbiota With Reduced Trimethylamine‐N‐Oxide Level in Patients With Large‐Artery Atherosclerotic Stroke or Transient Ischemic Attack > Results
“The average and median TMAO levels of stroke/TIA patients were only 2.68 μmol/L and 1.91 μmol/L, respectively”
§ Dysbiosis of Gut Microbiota With Reduced Trimethylamine‐N‐Oxide Level in Patients With Large‐Artery Atherosclerotic Stroke or Transient Ischemic Attack > Results
“| TMAO, μmol/L | 2.70 (3.47) | 1.91 (1.99) | <0.001 |”
Rated major: it would touch a result — a value a result rests on, reported and recomputed p-values on opposite sides of the significance level, two passages that conflict with no sign which is right, or a cited work retracted before this paper was published.
In the paper
§ Dysbiosis of Gut Microbiota With Reduced Trimethylamine‐N‐Oxide Level in Patients With Large‐Artery Atherosclerotic Stroke or Transient Ischemic Attack > Results
“The α‐diversity of severe stroke patients (NIHSS score >4) was higher than that of mild stroke patients (NIHSS score ≤4)”
§ Dysbiosis of Gut Microbiota With Reduced Trimethylamine‐N‐Oxide Level in Patients With Large‐Artery Atherosclerotic Stroke or Transient Ischemic Attack > Results
“(23.54 versus 26.47, P=0.014)”
Rated minor: it would not touch a result — a value no result rests on, a p-value that stays on the same side of the significance level, or a conflict that is clerical, resolved elsewhere in the paper, or outside its own findings.
In the paper
§ Dysbiosis of Gut Microbiota With Reduced Trimethylamine‐N‐Oxide Level in Patients With Large‐Artery Atherosclerotic Stroke or Transient Ischemic Attack > Results
“231 participants provided blood samples and 97 collected fresh fecal samples”
§ Dysbiosis of Gut Microbiota With Reduced Trimethylamine‐N‐Oxide Level in Patients With Large‐Artery Atherosclerotic Stroke or Transient Ischemic Attack > Results
“| Fecal sample | 141 | 94 | |”
Citations
Cites
QIIME allows analysis of high-throughput community sequencing data
Caporaso, J. G., Kuczynski, J., Stombaugh, J., Bittinger, K., Bushman, F. D., Costello, E. K., Fierer, N., Peña, A. G., Goodrich, J. K., Gordon, J. I., et al. (2010) · Nature Methods · doi:10.1038/nmeth.f.303 · Cited by 34,887
An introduction to ROC analysis
Fawcett, T. (2006) · Pattern Recognition Letters · doi:10.1016/j.patrec.2005.10.010 · Cited by 21,879
Search and clustering orders of magnitude faster than BLAST
Edgar, R. C. (2010) · Bioinformatics · doi:10.1093/bioinformatics/btq461 · Cited by 21,056
Metagenomic biomarker discovery and explanation
Segata, N., Izard, J., Waldron, L., Gevers, D., Miropolsky, L., Garrett, W. S., & Huttenhower, C. (2011) · Genome Biology · doi:10.1186/gb-2011-12-6-r60 · Cited by 16,192
Building Predictive Models in R Using the caret Package
Kuhn, M. (2008) · Journal of Statistical Software · doi:10.18637/jss.v028.i05 · Cited by 8,863
Enterotypes of the human gut microbiome
MetaHIT Consortium (additional members), Arumugam, M., Raes, J., Pelletier, E., Le Paslier, D., Yamada, T., Mende, D. R., Fernandes, G. R., Tap, J., Bruls, T., et al. (2011) · Nature · doi:10.1038/nature09944 · Cited by 7,548
A metagenome-wide association study of gut microbiota in type 2 diabetes
Qin, J., Li, Y., Cai, Z., Li, S., Zhu, J., Zhang, F., Liang, S., Zhang, W., Guan, Y., Shen, D., et al. (2012) · Nature · doi:10.1038/nature11450 · Cited by 6,762
Self-citationFastTree: Computing Large Minimum Evolution Trees with Profiles instead of a Distance Matrix
Price, M. N., Dehal, P. S., & Arkin, A. P. (2009) · Molecular Biology and Evolution · doi:10.1093/molbev/msp077 · Cited by 5,602
Intestinal microbiota metabolism of l-carnitine, a nutrient in red meat, promotes atherosclerosis
Koeth, R. A., Wang, Z., Levison, B. S., Buffa, J. A., Org, E., Sheehy, B. T., Britt, E. B., Fu, X., Wu, Y., Li, L., et al. (2013) · Nature Medicine · doi:10.1038/nm.3145 · Cited by 4,386
Gut Microbiota from Twins Discordant for Obesity Modulate Metabolism in Mice
Ridaura, V. K., Faith, J. J., Rey, F. E., Cheng, J., Duncan, A. E., Kau, A. L., Griffin, N. W., Lombard, V., Henrissat, B., Bain, J. R., et al. (2013) · Science · doi:10.1126/science.1241214 · Cited by 3,788
Cited by
Sorted by citations
Cryan, J. F., O'Riordan, K. J., Cowan, C. S. M., Sandhu, K. V., Bastiaanssen, T. F. S., Boehme, M., Codagnone, M. G., Cussotto, S., Fulling, C., Golubeva, A. V., et al. (2019) · Physiological Reviews · doi:10.1152/physrev.00018.2018 · Cited by 5,286
The gut microbiome in neurological disorders
Cryan, J. F., O'Riordan, K. J., Sandhu, K., Peterson, V., & Dinan, T. G. (2020) · The Lancet Neurology · doi:10.1016/s1474-4422(19)30356-4 · Cited by 1,336
Microbiota Dysbiosis Controls the Neuroinflammatory Response after Stroke
Singh, V., Roth, S., Llovera, G., Sadler, R., Garzetti, D., Stecher, B., Dichgans, M., & Liesz, A. (2016) · Journal of Neuroscience · doi:10.1523/jneurosci.1114-16.2016 · Cited by 815
Microbiome-wide association studies link dynamic microbial consortia to disease
Gilbert, J. A., Quinn, R. A., Debelius, J. W., Xu, Z. Z., Morton, J. T., Garg, N., Jansson, J. K., Dorrestein, P. C., & Knight, R. D. (2016) · Nature · doi:10.1038/nature18850 · Cited by 730
Yoshida, N., Emoto, T., Yamashita, T., Watanabe, H., Hayashi, T., Tabata, T., Hoshi, N., Hatano, N., Ozawa, G., Sasaki, N., et al. (2018) · Circulation · doi:10.1161/circulationaha.118.033714 · Cited by 619
Pathogenic mechanisms following ischemic stroke
Khoshnam, S. E., Winlow, W., Farzaneh, M., Farbood, Y., & Moghaddam, H. F. (2017) · Neurological Sciences · doi:10.1007/s10072-017-2938-1 · Cited by 636
Chen, Z., Venkat, P., Seyfried, D., Chopp, M., Yan, T., & Chen, J. (2017) · Circulation Research · doi:10.1161/circresaha.117.311170 · Cited by 574
A Comprehensive Review on the Role of the Gut Microbiome in Human Neurological Disorders
Sorboni, S. G., Moghaddam, H. S., Esfehani, R. J., & Soleimanpour, S. (2022) · Clinical Microbiology Reviews · doi:10.1128/cmr.00338-20 · Cited by 572
Intestinal Microbiota in Cardiovascular Health and Disease
Tang, W. H. W., Bäckhed, F., Landmesser, U., & Hazen, S. L. (2019) · Journal of the American College of Cardiology · doi:10.1016/j.jacc.2019.03.024 · Cited by 524
Sun, X., Jiao, X., Ma, Y., Liu, Y., Zhang, L., He, Y., & Chen, Y. (2016) · Biochemical and Biophysical Research Communications · doi:10.1016/j.bbrc.2016.11.017 · Cited by 507
Self-citationTrimethylamine N-oxide: the good, the bad and the unknown.
Velasquez, M., Ramezani, A., Manal, A., & Raj, D. (2016) · Toxins · doi:10.3390/toxins8110326 · Cited by 504
Microbial modulation of cardiovascular disease
Brown, J. M., & Hazen, S. L. (2018) · Nature Reviews Microbiology · doi:10.1038/nrmicro.2017.149 · Cited by 440
Gut Microbiota and Complications of Type-2 Diabetes
Iatcu, O. C., Steen, A., & Covașă, M. (2021) · Nutrients · doi:10.3390/nu14010166 · Cited by 448
The progress of gut microbiome research related to brain disorders
Zhu, S., Jiang, Y., Xu, K., Cui, M., Ye, W., Zhao, G., Jin, L., & Chen, X. (2020) · Journal of Neuroinflammation · doi:10.1186/s12974-020-1705-z · Cited by 419
Role of the gut microbiota in type 2 diabetes and related diseases
Yang, G., Wei, J., Liu, P., Zhang, Q., Tian, Y., Hou, G., Meng, L., Xin, Y., & Jiang, X. (2021) · Metabolism · doi:10.1016/j.metabol.2021.154712 · Cited by 418
Fecal Microbiota Transplantation in Neurological Disorders
Vendrik, K. E. W., Ooijevaar, R. E., de Jong, P. R. C., Laman, J. D., van Oosten, B. W., van Hilten, J. J., Ducarmon, Q. R., Keller, J. J., Kuijper, E. J., & Contarino, M. F. (2020) · Frontiers in Cellular and Infection Microbiology · doi:10.3389/fcimb.2020.00098 · Cited by 413
Role of microbiota-derived short-chain fatty acids in nervous system disorders
Mirzaei, R., Bouzari, B., Hosseini‐Fard, S. R., Mazaheri, M., Ahmadyousefi, Y., Abdi, M., Jalalifar, S., Karimitabar, Z., Teimoori, A., Keyvani, H., et al. (2021) · Biomedicine & Pharmacotherapy · doi:10.1016/j.biopha.2021.111661 · Cited by 408
Gut microbiota and cardiovascular disease: opportunities and challenges
Kazemian, N., Mahmoudi, M., Halperin, F. A., Wu, J. C., & Pakpour, S. (2020) · Microbiome · doi:10.1186/s40168-020-00821-0 · Cited by 401
Yang, S., Li, X., Yang, F., Zhao, R., Pan, X., Liang, J., Tian, L., Li, X., Liu, L., Xing, Y., et al. (2019) · Frontiers in Pharmacology · doi:10.3389/fphar.2019.01360 · Cited by 360
Recent developments in understanding the role of the gut microbiota in brain health and disease
Sherwin, E., Dinan, T. G., & Cryan, J. F. (2018) · Annals of the New York Academy of Sciences · doi:10.1111/nyas.13416 · Cited by 338
Yamashiro, K., Tanaka, R., Urabe, T., Ueno, Y., Yamashiro, Y., Nomoto, K., Takahashi, T., Tsuji, H., Asahara, T., & Hattori, N. (2017) · PLoS ONE · doi:10.1371/journal.pone.0171521 · Cited by 321
Rapid gut dysbiosis induced by stroke exacerbates brain infarction in turn
Xu, K., Gao, X., Xia, G., Chen, M., Zeng, N., Wang, S., You, C., Tian, X., Di, H., Tang, W., et al. (2021) · Gut · doi:10.1136/gutjnl-2020-323263 · Cited by 308
Self-citationTMAO: how gut microbiota contributes to heart failure
Zhang, Y., Wang, Y., Ke, B., & Du, J. (2020) · Translational research · doi:10.1016/j.trsl.2020.08.007 · Cited by 311
Liu, F., Li, P., Chen, M., Luo, Y., Prabhakar, M., Zheng, H., He, Y., Qi, Q., Long, H., Zhang, Y., et al. (2017) · Scientific Reports · doi:10.1038/s41598-017-10722-2 · Cited by 305
Self-citationKe, Y., Li, D., Zhao, M., Liu, C., Liu, J., Zeng, A., Shi, X., Cheng, S., Pan, B., Zheng, L., et al. (2018) · Free Radical Biology and Medicine · doi:10.1016/j.freeradbiomed.2018.01.007 · Cited by 285
The gut microbiota–brain axis in neurological disorder
Ullah, H., Arbab, S., Tian, Y., Liu, C., Chen, Y., Li, Q., Khan, M. I. U., Hassan, I. U., & Li, K. (2023) · Frontiers in Neuroscience · doi:10.3389/fnins.2023.1225875 · Cited by 292
Systemic inflammation after stroke: implications for post‐stroke comorbidities
Simats, A., & Liesz, A. (2022) · EMBO Molecular Medicine · doi:10.15252/emmm.202216269 · Cited by 276
van den Munckhof, I., Kurilshikov, A., ter Horst, R., Riksen, N. P., Joosten, L. A. B., Zhernakova, A., Fu, J., Keating, S. T., Netea, M. G., Graaf, J. D., et al. (2018) · Obesity Reviews · doi:10.1111/obr.12750 · Cited by 281
Microbiome and metabolome features of the cardiometabolic disease spectrum
Fromentin, S., Forslund, S. K., Chechi, K., Aron‐Wisnewsky, J., Chakaroun, R., Nielsen, T., Tremaroli, V., Ji, B., Prifti, E., Myridakis, A., et al. (2022) · Nature Medicine · doi:10.1038/s41591-022-01688-4 · Cited by 281
Change of intestinal microbiota in cerebral ischemic stroke patients
Li, N., Wang, X., Sun, C., Lü, M., Lü, M., Si, Y., Ye, X., Wang, T., Yu, X., Zhao, X., et al. (2019) · BMC Microbiology · doi:10.1186/s12866-019-1552-1 · Cited by 273
Desulfovibrio in the Gut: The Enemy within?
Singh, S., Carroll‐Portillo, A., & Lin, H. C. (2023) · Microorganisms · doi:10.3390/microorganisms11071772 · Cited by 279
The Gut Microbiota (Microbiome) in Cardiovascular Disease and Its Therapeutic Regulation
Rahman, M. M., Islam, F., Harun-Or-Rashid, M., Mamun, A. A., Rahaman, M. S., Islam, M. M., Meem, A. F. K., Sutradhar, P. R., Mitra, S., Mimi, A. A., et al. (2022) · Frontiers in Cellular and Infection Microbiology · doi:10.3389/fcimb.2022.903570 · Cited by 272
Xu, K., Xia, G., Lu, J.-Q., Chen, M.-X., Zhen, X., Wang, S., You, C., Nie, J., Zhou, H., & Yin, J. (2017) · Scientific Reports · doi:10.1038/s41598-017-01387-y · Cited by 268
Self-citationGut Microbiota and Their Metabolites in Stroke: A Double-Edged Sword
Peh, A., O’Donnell, J. A., Broughton, B. R. S., & Marques, F. Z. (2022) · Stroke · doi:10.1161/strokeaha.121.036800 · Cited by 260
Zuo, K., Li, J., Li, K., Hu, C., Gao, Y., Chen, M., Hu, R., Liu, Y., Chi, H., Wang, H., et al. (2019) · GigaScience · doi:10.1093/gigascience/giz058 · Cited by 235
Trimethylamine N-oxide (TMAO) in human health
Gątarek, P., & Kałużna‐Czaplińska, J. (2020) · EXCLI journal · doi:10.17179/excli2020-3239 · Cited by 235
Liu, Y., & Dai, M. (2020) · Mediators of Inflammation · doi:10.1155/2020/4634172 · Cited by 235
Tan, C., Wu, Q., Wang, H., Gao, X., Xu, R., Cui, Z., Zhu, J., Zeng, X., Zhou, H., He, Y., et al. (2020) · Journal of Parenteral and Enteral Nutrition · doi:10.1002/jpen.1861 · Cited by 233
Self-citationMaking Sense of … the Microbiome in Psychiatry
Bastiaanssen, T. F. S., Cowan, C. S. M., Claesson, M. J., Dinan, T. G., & Cryan, J. F. (2018) · The International Journal of Neuropsychopharmacology · doi:10.1093/ijnp/pyy067 · Cited by 234
Xia, G., You, C., Gao, X., Zeng, X., Zhu, J., Xu, K., Tan, C., Xu, R., Wu, Q., Zhou, H., et al. (2019) · Frontiers in Neurology · doi:10.3389/fneur.2019.00397 · Cited by 220
Self-citationDysbiosis signatures of gut microbiota in coronary artery disease
Zhu, Q. R., Gao, R., Zhang, Y., Pan, D., Zhu, Y., Zhang, X., Yang, R., Jiang, R., Xu, Y., & Qin, H. (2018) · Physiological Genomics · doi:10.1152/physiolgenomics.00070.2018 · Cited by 220
Zhang, Y., Chen, R., Zhang, D., Qi, S., & Liu, Y. (2023) · Biomedicine & Pharmacotherapy · doi:10.1016/j.biopha.2023.114295 · Cited by 224
Sundman, M., Chen, N., Subbian, V., & Chou, Y. (2017) · Brain Behavior and Immunity · doi:10.1016/j.bbi.2017.05.009 · Cited by 204
Canyelles, M., Tondo, M., Cedó, L., Farràs, M., Escolá‐Gil, J. C., & Blanco‐Vaca, F. (2018) · International Journal of Molecular Sciences · doi:10.3390/ijms19103228 · Cited by 197
Zeng, X., Gao, X., Peng, Y., Wu, Q., Zhu, J., Tan, C., Xia, G., You, C., Xu, R., Pan, S., et al. (2019) · Frontiers in Cellular and Infection Microbiology · doi:10.3389/fcimb.2019.00004 · Cited by 189
Self-citationLinking gut microbiota, metabolic syndrome and economic status based on a population-level analysis
He, Y., Wu, W. H., Wu, S., Zheng, H., Li, P., Sheng, H.-F., Chen, M.-X., Chen, Z., Ji, G., Zheng, Z., et al. (2018) · Microbiome · doi:10.1186/s40168-018-0557-6 · Cited by 189
Self-citationThe epithelial barrier theory and its associated diseases
Sun, N., Öğülür, İ., Mitamura, Y., Yazıcı, D., Pat, Y., Bu, X., Li, M., Zhu, X., Babayev, H., Ardıçlı, S., et al. (2024) · Allergy · doi:10.1111/all.16318 · Cited by 190
The microbiome-gut-brain axis in acute and chronic brain diseases
Benakis, C., Martin‐Gallausiaux, C., Trezzi, J., Melton, P., Liesz, A., & Wilmes, P. (2019) · Current Opinion in Neurobiology · doi:10.1016/j.conb.2019.11.009 · Cited by 189
Gut Microbiota and Ischemic Stroke: The Role of Trimethylamine N-Oxide
Nam, H. S. (2019) · Journal of Stroke · doi:10.5853/jos.2019.00472 · Cited by 176
Emoto, T., Yamashita, T., Kobayashi, T., Sasaki, N., Hirota, Y., Hayashi, T., So, A., Kasahara, K., Yodoi, K., Matsumoto, T., et al. (2017) · Heart and Vessels · doi:10.1007/s00380-016-0841-y · Cited by 174
Aging Microbiota-Gut-Brain Axis in Stroke Risk and Outcome
Honarpisheh, P., Bryan, R. M., & McCullough, L. D. (2022) · Circulation Research · doi:10.1161/circresaha.122.319983 · Cited by 176
Examining the Role of the Microbiota-Gut-Brain Axis in Stroke
Durgan, D. J., Lee, J., McCullough, L. D., & Bryan, R. M. (2019) · Stroke · doi:10.1161/strokeaha.119.025140 · Cited by 169
New insights into the mechanisms of high‐fat diet mediated gut microbiota in chronic diseases
Chen, J., Xiao, Y., Li, D., Zhang, S., Wu, Y., Zhang, Q., & Bai, W. (2023) · iMeta · doi:10.1002/imt2.69 · Cited by 173
Association between gut microbiota and bone health: Potential mechanisms and prospective
Chen, Y.-C., Greenbaum, J., Shen, H., & Deng, H.-W. (2017) · The Journal of Clinical Endocrinology & Metabolism · doi:10.1210/jc.2017-00513 · Cited by 165
Hu, B., & Arya, A. K. (2018) · Brain Circulation · doi:10.4103/bc.bc_32_18 · Cited by 170
The Influence of Gut Dysbiosis in the Pathogenesis and Management of Ischemic Stroke
Chidambaram, S. B., Rathipriya, A. G., Mahalakshmi, A. M., Sonali, S., Hediyal, T. A., Ray, B., Sunanda, T., Rungratanawanich, W., Kashyap, R. S., Qoronfleh, M. W., et al. (2022) · Cells · doi:10.3390/cells11071239 · Cited by 167
The role of gut microbiota in bone homeostasis
Behera, J., Ison, J., Tyagi, S. C., & Tyagi, N. (2020) · Bone · doi:10.1016/j.bone.2020.115317 · Cited by 162
The Role of Gut Microbiota in an Ischemic Stroke
Pluta, R. M., Januszewski, S., & Czuczwar, S. J. (2021) · International Journal of Molecular Sciences · doi:10.3390/ijms22020915 · Cited by 163
Trimethylamine N-Oxide in Relation to Cardiometabolic Health—Cause or Effect?
Papandreou, C., Moré, M. I., & Bellamine, A. (2020) · Nutrients · doi:10.3390/nu12051330 · Cited by 157
Guasch‐Ferré, M., Hu, F. B., Ruiz‐Canela, M., Bulló, M., Toledo, E., Wang, D. D., Corella, D., Gómez‐Gracia, E., Fiol, M., Estruch, R., et al. (2017) · Journal of the American Heart Association · doi:10.1161/jaha.117.006524 · Cited by 152
The Molecular Basis of Predicting Atherosclerotic Cardiovascular Disease Risk
Nayor, M. G., Brown, K., & Vasan, R. S. (2021) · Circulation Research · doi:10.1161/circresaha.120.315890 · Cited by 149
Differences in Alpha Diversity of Gut Microbiota in Neurological Diseases
Li, Z., Zhou, J., Liang, H., Ye, L., Lan, L., Lü, F., Wang, Q., Lei, T., Yang, X., Cui, P., et al. (2022) · Frontiers in Neuroscience · doi:10.3389/fnins.2022.879318 · Cited by 151
Haak, B. W., Westendorp, W. F., van Engelen, T. S. R., Brands, X., Brouwer, M. C., Vermeij, J., Hugenholtz, F., Verhoeven, A., Derks, R. J. E., Giera, M. A., et al. (2020) · Translational Stroke Research · doi:10.1007/s12975-020-00863-4 · Cited by 146
The Cerebrovascular-Chronic Kidney Disease Connection: Perspectives and Mechanisms
Lau, W. L., Huisa, B. N., & Fisher, M. (2016) · Translational Stroke Research · doi:10.1007/s12975-016-0499-x · Cited by 136
Huć, T., Drapała, A., Gawryś-Kopczyńska, M., Konop, M., Maksymiuk, K. M., Zaorska, E., Samborowska, E., Wyczałkowska-Tomasik, A., Pączek, L., Dadlez, M., et al. (2018) · American Journal of Physiology-Heart and Circulatory Physiology · doi:10.1152/ajpheart.00536.2018 · Cited by 134
Post-stroke remodeling processes in animal models and humans
Cirillo, C., Brihmat, N., Castel-Lacanal, E., Friec, A. L., Barbieux‐Guillot, M., Raposo, N., Pariente, J., Viguier, A., Simonetta‐Moreau, M., Albucher, J., et al. (2019) · Journal of Cerebral Blood Flow & Metabolism · doi:10.1177/0271678x19882788 · Cited by 143
Beyond the Brain: The Systemic Pathophysiological Response to Acute Ischemic Stroke
Balch, M. H. H., Nimjee, S. M., Rink, C. L., & Hannawi, Y. (2020) · Journal of Stroke · doi:10.5853/jos.2019.02978 · Cited by 133
Muralitharan, R. R., Jama, H. A., Xie, L., Peh, A., Snelson, M., & Marques, F. Z. (2020) · Hypertension · doi:10.1161/hypertensionaha.120.14473 · Cited by 131
Trimethylamine N -oxide: A harmful, protective or diagnostic marker in lifestyle diseases?
Nowiński, A., & Ufnal, M. (2017) · Nutrition · doi:10.1016/j.nut.2017.08.001 · Cited by 132
The alteration of gut microbiome and metabolism in amyotrophic lateral sclerosis patients
Zeng, Q., Shen, J., Chen, K., Zhou, J., Liao, Q., Lu, K., Yuan, J., & Bi, F. (2020) · Scientific Reports · doi:10.1038/s41598-020-69845-8 · Cited by 127
Intestinal microbiota profiling and predicted metabolic dysregulation in psoriasis patients
Chen, Y., Ho, H. J., Tseng, C., Lai, Z.-L., Shieh, J., & Wu, C. (2018) · Experimental Dermatology · doi:10.1111/exd.13786 · Cited by 123
The potential of tailoring the gut microbiome to prevent and treat cardiometabolic disease
Chakaroun, R., Olsson, L. M., & Bäckhed, F. (2022) · Nature Reviews Cardiology · doi:10.1038/s41569-022-00771-0 · Cited by 126
Dysbiosis of the intestinal microbiota in neurocritically ill patients and the risk for death
Xu, R., Tan, C., Zhu, J., Zeng, X., Gao, X., Wu, Q., Chen, Q., Wang, H., Zhou, H., He, Y., et al. (2019) · Critical Care · doi:10.1186/s13054-019-2488-4 · Cited by 120
Self-citationMetabolic endotoxemia promotes neuroinflammation after focal cerebral ischemia
Kurita, N., Yamashiro, K., Kuroki, T., Tanaka, R., Urabe, T., Ueno, Y., Miyamoto, N., Takanashi, M., Shimura, H., Inaba, T., et al. (2020) · Journal of Cerebral Blood Flow & Metabolism · doi:10.1177/0271678x19899577 · Cited by 121
Tomlinson, J. A. P., & Wheeler, D. C. (2017) · Kidney International · doi:10.1016/j.kint.2017.03.053 · Cited by 121
Metabolomics and Lipidomics of Ischemic Stroke
Au, A. (2018) · Advances in clinical chemistry · doi:10.1016/bs.acc.2018.02.002 · Cited by 121
TXNIP: A Double‐Edged Sword in Disease and Therapeutic Outlook
Pan, M., Zhang, F., Qu, K., Liu, C., & Zhang, J. (2022) · Oxidative Medicine and Cellular Longevity · doi:10.1155/2022/7805115 · Cited by 120
Atorvastatin Treatment Modulates the Gut Microbiota of the Hypercholesterolemic Patients
Khan, T. J., Ahmed, Y. M., Zamzami, M. A., Siddiqui, A. M., Khan, I., Baothman, O. A. S., Mehanna, M. G., Kuerban, A., Mohammed, K., & Yasir, M. (2018) · OMICS A Journal of Integrative Biology · doi:10.1089/omi.2017.0130 · Cited by 117
Gut Microbiome and Cardiovascular Diseases
Yoshida, N., Yamashita, T., & Hirata, K. (2018) · Diseases · doi:10.3390/diseases6030056 · Cited by 116
Liu, Z., Li, J., Liu, H., Ying, T., Zhan, Q., Lai, W., Ao, L., Meng, X., Ren, H., Xu, D., et al. (2018) · Atherosclerosis · doi:10.1016/j.atherosclerosis.2018.11.038 · Cited by 116
Moludi, J., Maleki, V., Vayghan, H. J., Vaghef‐Mehrabany, E., & Alizadeh, M. (2020) · Clinical and Experimental Pharmacology and Physiology · doi:10.1111/1440-1681.13250 · Cited by 115
Koay, Y. C., Chen, Y., Wali, J. A., Luk, A. W. S., Li, M., Doma, H., Reimark, R., Zaldivia, M. T. K., Habtom, H. T., Franks, A. E., et al. (2020) · Cardiovascular Research · doi:10.1093/cvr/cvaa094 · Cited by 113
NMN Maintains Intestinal Homeostasis by Regulating the Gut Microbiota
Huang, P., Jiang, A., Wang, X., Zhou, Y., Tang, W., Ren, C., Qian, X., Zhou, Z., & Gong, A. (2021) · Frontiers in Nutrition · doi:10.3389/fnut.2021.714604 · Cited by 110
The Gut Microbiome as Therapeutic Target in Central Nervous System Diseases: Implications for Stroke
Winek, K., Dirnagl, U., & Meisel, A. (2016) · Neurotherapeutics · doi:10.1007/s13311-016-0475-x · Cited by 108
Brown, J. M., & Hazen, S. L. (2017) · Journal of Biological Chemistry · doi:10.1074/jbc.r116.765388 · Cited by 108
Gastrointestinal dysfunction after spinal cord injury
Holmes, G. M., & Blanke, E. N. (2019) · Experimental Neurology · doi:10.1016/j.expneurol.2019.113009 · Cited by 111
Role of Gut Microbiota in Neurological Disorders and Its Therapeutic Significance
Tiwari, P., Dwivedi, R., Bansal, M., Tripathi, M., & Dada, R. (2023) · Journal of Clinical Medicine · doi:10.3390/jcm12041650 · Cited by 108
Chen, L., Chen, D., Liu, J., Zhang, J., Vaziri, N. D., Zhuang, S., Chen, H., Feng, Y., Guo, Y. P., & Zhao, Y. (2019) · Experimental & Molecular Medicine · doi:10.1038/s12276-019-0234-2 · Cited by 105
TMA, A Forgotten Uremic Toxin, but Not TMAO, Is Involved in Cardiovascular Pathology
Jaworska, K., Hering, D., Mosieniak, G., Bielak-Żmijewska, A., Pilz, M., Konwerski, M., Gąsecka, A., Kapłon‐Cieślicka, A., Filipiak, K. J., Sikora, E., et al. (2019) · Toxins · doi:10.3390/toxins11090490 · Cited by 106
Fecal Microbiota Transplantation: A New Therapeutic Attempt from the Gut to the Brain
Xu, H., Huang, H., Zhou, Y., Zhao, H., Xu, J., Shou, D., Liu, Y., Zhou, Y., & Nie, Y. (2021) · Gastroenterology Research and Practice · doi:10.1155/2021/6699268 · Cited by 103
An unexplored brain-gut microbiota axis in stroke
Wen, S., & Wong, C. H. Y. (2017) · Gut Microbes · doi:10.1080/19490976.2017.1344809 · Cited by 101
Yang, Q., Lin, S. L., Kwok, M. K., Leung, G. M., & Schooling, C. M. (2018) · American Journal of Epidemiology · doi:10.1093/aje/kwy096 · Cited by 100
The central and biodynamic role of gut microbiota in critically ill patients
Wozniak, H., Beckmann, T. S., Fröhlich, L., Soccorsi, T., Terrier, C. L., de Watteville, A., Schrenzel, J., & Heidegger, C. (2022) · Critical Care · doi:10.1186/s13054-022-04127-5 · Cited by 102
Liu, Y., Kong, C., Gong, L., Zhang, X., Zhu, Y., Wang, H., Qu, X., Gao, R., Yin, F., Liu, X., et al. (2020) · Journal of Alzheimer s Disease · doi:10.3233/jad-191066 · Cited by 99
Benakis, C., Poon, C., Lane, D., Brea, D., Sita, G., Moore, J. M. R., Murphy, M., Racchumi, G., Iadecola, C., & Anrather, J. (2020) · Stroke · doi:10.1161/strokeaha.120.029262 · Cited by 100
Gut Microbiota in Acute Ischemic Stroke: From Pathophysiology to Therapeutic Implications
Battaglini, D., Pimentel‐Coelho, P. M., Robba, C., dos Santos, C. C., Cruz, F. F., Pelosi, P. P., & Rocco, P. R. M. (2020) · Frontiers in Neurology · doi:10.3389/fneur.2020.00598 · Cited by 100
Ischemic stroke and intestinal flora: an insight into brain–gut axis
Hu, W., Kong, X., Wang, H., Li, Y., & Luo, Y. (2022) · European journal of medical research · doi:10.1186/s40001-022-00691-2 · Cited by 102
Shanmugham, M., Bellanger, S., & Leo, C. H. (2023) · Pharmaceuticals · doi:10.3390/ph16040504 · Cited by 103
Gut-brain axis: Focus on gut metabolites short-chain fatty acids
Guo, C., Huo, Y., Li, Y., Han, Y., & Zhou, D. (2022) · World Journal of Clinical Cases · doi:10.12998/wjcc.v10.i6.1754 · Cited by 100
Wang, Q., Guo, M., Liu, Y., Xu, M., Shi, L., Li, X., Zhao, J., Zhang, H., Wang, G., & Chen, W. (2022) · Nutrients · doi:10.3390/nu14061222 · Cited by 97
Metadata
- Authors
- Yin, J., Liao, S., He, Y., Wang, S., Xia, G., Liu, F., Zhu, J., You, C., Chen, Q., Zhou, L., Pan, S., & Zhou, H.
- Affiliations
- Nanfang Hospital (CN)
- Southern Medical University (CN)
- Department of Neurology, NanFang Hospital, Southern Medical University, Guangzhou, China
- Department of Environmental Health, Guangdong Provincial Key Laboratory of Tropical Disease Research, School of Public Health and Tropical Medicine, Southern Medical University, Guangzhou, China
- State Key Laboratory of Organ Failure Research, Southern Medical University, Guangzhou, China
- Venue
- Journal of the American Heart Association
- Published
- 2015-10-29
- Volume
- 4
- Issue
- 11
- ISSN
- 2047-9980 (ISSN-L)
- PMC
- PMC4845212
- OpenAlex
- W2178133650
- Semantic Scholar
- e22153ff5a5f849aa7f5c6438beb6f42c91f837e
- Cited by
- 669
- References
- 23
- Citations by year
- 2026: 35 · 2025: 72 · 2024: 71 · 2023: 96 · 2022: 117 · 2021: 76 · 2020: 78 · 2019: 57 · 2018: 34 · 2017: 20 · 2016: 13
- FWCI
- 9.69
- Type
- journal article
- Language
- en
- Open access
- gold
- doi.org
- Licence
- cc-by-nc
- Locations
- Journal of the American Heart Association (publishedVersion, cc-by-nc)
- PubMed Central (publishedVersion, cc-by-nc)
- PubMed (publishedVersion)
- Funders
- National Natural Science Foundation of China (31270152)
- Natural Science Foundation of Guangdong Province
- Guangzhou Municipal Science and Technology Project
- Topics
- Life Sciences › Biochemistry, Genetics and Molecular Biology › Molecular Biology › Gut microbiota and health
- Health Sciences › Dentistry › Periodontics › Oral microbiology and periodontitis research
- Health Sciences › Medicine › Surgery › Abdominal vascular conditions and treatments
- Keywords
- gut dysbiosis, trimethylamine N-oxide, large artery atherosclerotic stroke, transient ischemic attack, ischemic stroke, carotid plaque, opportunistic pathogens, Enterobacter, Megasphaera, Oscillibacter, Bacteroides, Prevotella, Faecalibacterium, atherogenesis, disease severity
- MeSH terms
- Gastrointestinal Microbiome, Aged, Aged, 80 and over, Bacteria, Carotid Artery Diseases, Ischemic Attack, Transient, Chromatography, Liquid, Feces, Female, Humans, Intestines, Male, Methylamines, Middle Aged, Mass Spectrometry, Down-Regulation, Case-Control Studies, Stroke, Ribotyping, Asymptomatic Diseases, Dysbiosis
About these checks
Registry, retraction, Cites and statistics results are computed, not judged, with one exception: a printed reference that no index lists is read once by a model before it counts as a citation error. Claims are extracted by a model and kept only when their quote appears verbatim in the text; each cited source is then checked, with a model’s help, for whether it says what the claim relies on. Those verdicts can be wrong — read the claim’s quote and the cited source before relying on one.
A language model drew the claims from the paper on 2026-10-09, under version 3 of the claim definition (model deepseek-v4.1-flash, prompt extract-v3).
A second model labelled each claim on 2026-10-09 (model jev-1.13-20260917, definition revision gold-guideline-v0.2).
Statistics and arithmetic are recomputed, not judged.
Confidence bands are shown only for fields calibrated on our annotated test set. None is calibrated yet, so no band is shown.
What counts as a claim ›How we measure confidence ›How we check this ›
Are you an author, or do you see a problem with this page? Request a review
