

The DOI matches its Crossref record; 13 of the 13 references it cites were found in a registry or an index.
Single-cell profiling of T and B cell repertoires following SARS-CoV-2 mRNA vaccine
Published version of a preprint
Abstract
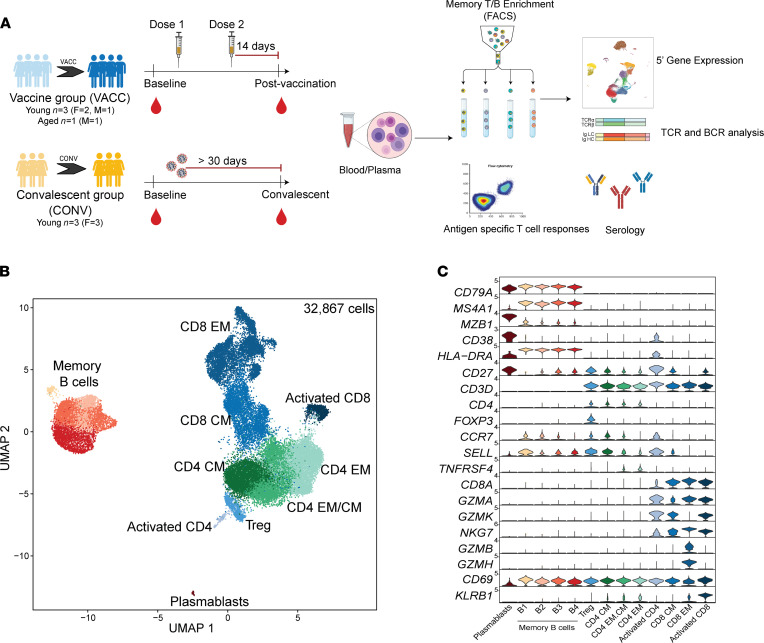
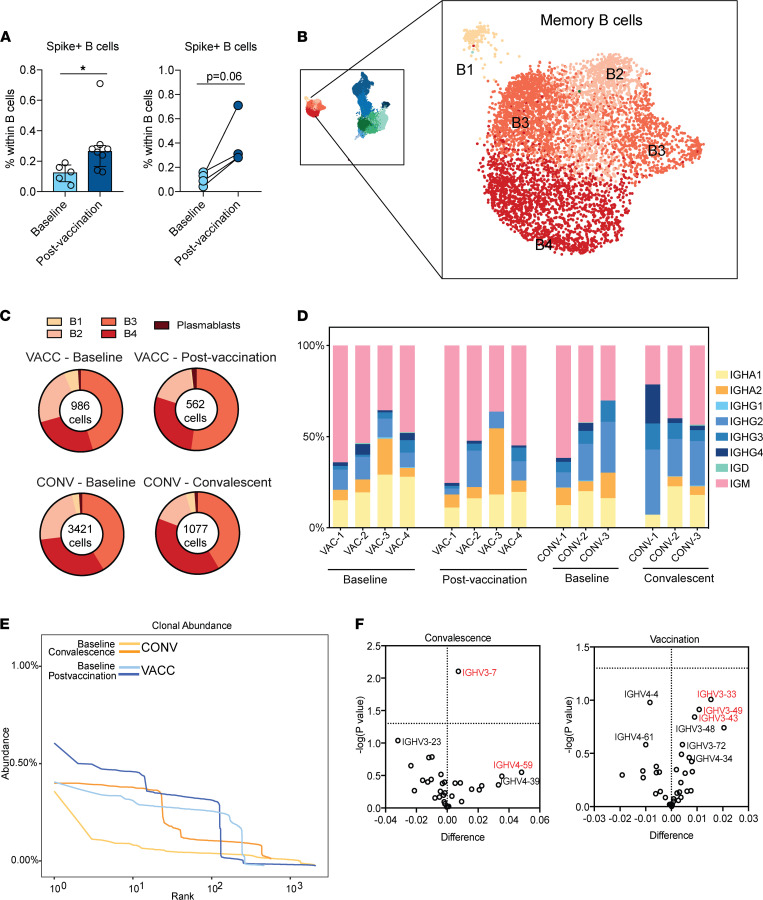
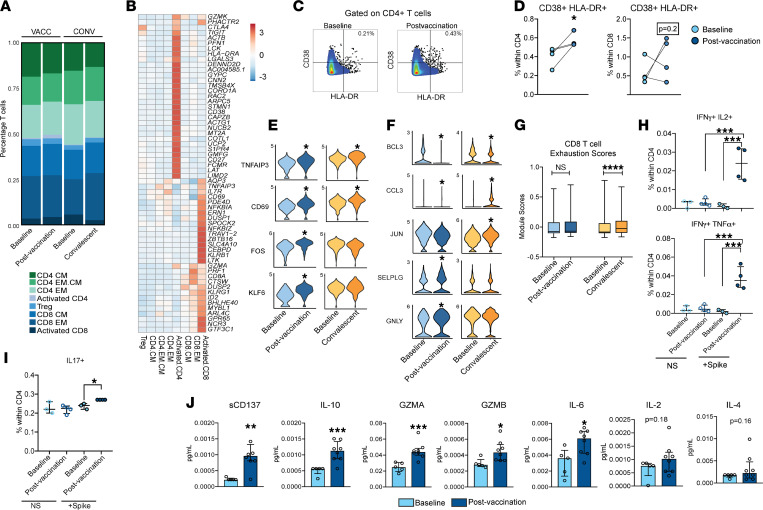
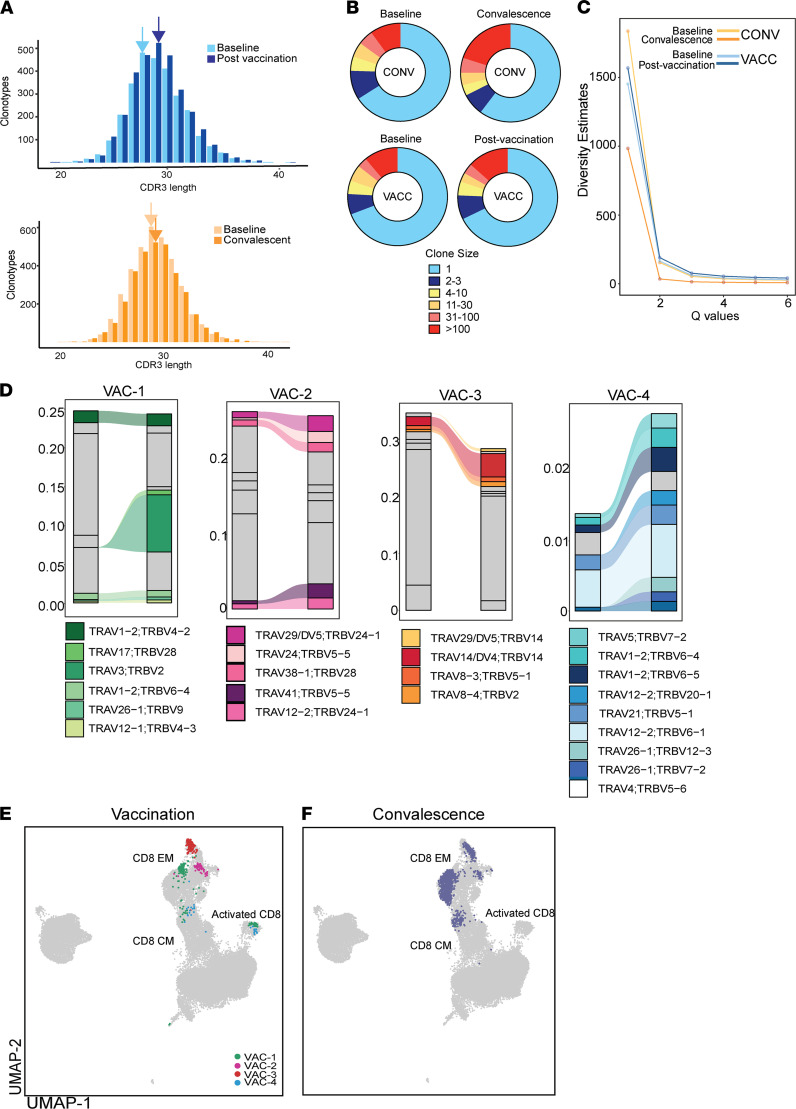
mRNA vaccines for SARS-CoV-2 have shown exceptional clinical efficacy, providing robust protection against severe disease. However, our understanding of transcriptional and repertoire changes following full vaccination remains incomplete. We used scRNA-Seq and functional assays to compare humoral and cellular responses to 2 doses of mRNA vaccine with responses observed in convalescent individuals with asymptomatic disease. Our analyses revealed enrichment of spike-specific B cells, activated CD4 + T cells, and robust antigen-specific polyfunctional CD4 + T cell responses following vaccination. On the other hand, although clonally expanded CD8 + T cells were observed following both vaccination and natural infection, CD8 + T cell responses were relatively weak and variable. In addition, TCR gene usage was variable, reflecting the diversity of repertoires and MHC polymorphism in the human population. Natural infection induced expansion of CD8 + T cell clones that occupy distinct clusters compared to those induced by vaccination and likely recognize a broader set of viral antigens of viral epitopes presented by the virus not seen in the mRNA vaccine. Our study highlights a coordinated adaptive immune response in which early CD4 + T cell responses facilitate the development of the B cell response and substantial expansion of effector CD8 + T cells, together capable of contributing to future recall responses.
Overview
The claims and statistics of this paper haven’t been checked yet.
Run the check — free, no account needed. It reads the open-access text and checks the sources it cites.
Integrity signals
Registry
Cites
Statistics
Figures
Verification
Claims the paper makes
The claims and statistics of this paper haven’t been checked yet.
Run the check — free, no account needed. It reads the open-access text and checks the sources it cites.
Claims other papers make about this one
Each is checked against this paper’s own text: does it say what the citing paper says it does?
The source backs part of the claim, not all of it — or backs it for a different population, condition or comparison.
In the citing paper
“BNT162b2 vaccination induces strong antibody and antigen-specific T-cell responses, and it is associated with a significant expansion of a distinct myeloid cell cluster enriched in interferon-response transcription factors [26,27].”
From Systemic profiling of immune responses in healthy adults vaccinated with an RBD-targeting COVID-19 mRNA vaccine (2025) · cites this paper as [27]
Experimental — accuracy not yet measured
Self-check
Percentages, sums and reported differences re-computed from the paper’s own numbers.
The self-check needs the paper’s full text.
Citations
Cites
Safety and Efficacy of the BNT162b2 mRNA Covid-19 Vaccine
Polack, F. P., Thomas, S. J., Kitchin, N., Absalon, J., Gurtman, A., Lockhart, S., Perez, J. L., Pérez Marc, G., Moreira, E. D., Zerbini, C., et al. (2020) · New England Journal of Medicine · doi:10.1056/nejmoa2034577 · Cited by 14,592 · cited 1×
“Findings from human trials of Pfizer/BioNTech and Moderna suggest 95% maximal protection within 1-2 months after the second vaccine dose, including against several circulating variants of concern (9, 10).”
MethodEfficacy and Safety of the mRNA-1273 SARS-CoV-2 Vaccine
Baden, L. R., El Sahly, H. M., Essink, B., Kotloff, K., Frey, S., Novak, R., Diemert, D., Spector, S. A., Rouphael, N., Creech, C. B., et al. (2021) · New England Journal of Medicine · doi:10.1056/nejmoa2035389 · Cited by 10,119
COVID-19 vaccine BNT162b1 elicits human antibody and TH1 T cell responses
Sahin, U., Muik, A., Derhovanessian, E., Vogler, I., Kranz, L. M., Vormehr, M., Baum, A., Pascal, K., Quandt, J., Maurus, D., et al. (2020) · Nature · doi:10.1038/s41586-020-2814-7 · Cited by 1,977
Evolution of antibody immunity to SARS-CoV-2
Gaebler, C., Wang, Z., Lorenzi, J. C. C., Muecksch, F., Finkin, S., Tokuyama, M., Cho, A., Jankovic, M., Schaefer-Babajew, D., Oliveira, T. Y., et al. (2021) · Nature · doi:10.1038/s41586-021-03207-w · Cited by 1,674
Safety and Immunogenicity of SARS-CoV-2 mRNA-1273 Vaccine in Older Adults
Anderson, E. J., Rouphael, N. G., Widge, A. T., Jackson, L. A., Roberts, P. C., Makhene, M., Chappell, J. D., Denison, M. R., Stevens, L. J., Pruijssers, A. J., et al. (2020) · New England Journal of Medicine · doi:10.1056/nejmoa2028436 · Cited by 1,523
Mathew, D., Giles, J. R., Baxter, A. E., Oldridge, D. A., Greenplate, A. R., Wu, J. E., Alanio, C., Kuri-Cervantes, L., Pampena, M. B., D’Andrea, K., et al. (2020) · Science · doi:10.1126/science.abc8511 · Cited by 1,509
Safety and Efficacy of the BNT162b2 mRNA Covid-19 Vaccine
(2021) · New England Journal of Medicine · doi:10.1056/nejmc2036242 · Cited by 831
Durability of Responses after SARS-CoV-2 mRNA-1273 Vaccination
Widge, A. T., Rouphael, N. G., Jackson, L. A., Anderson, E. J., Roberts, P. C., Makhene, M., Chappell, J. D., Denison, M. R., Stevens, L. J., Pruijssers, A. J., et al. (2021) · New England Journal of Medicine · doi:10.1056/nejmc2032195 · Cited by 722
Goel, R. R., Apostolidis, S. A., Painter, M. M., Mathew, D., Pattekar, A., Kuthuru, O., Gouma, S., Hicks, P., Meng, W., Rosenfeld, A. M., et al. (2021) · Science Immunology · doi:10.1126/sciimmunol.abi6950 · Cited by 655
Pardi, N., Hogan, M. J., Naradikian, M. S., Parkhouse, K., Cain, D. W., Jones, L., Moody, M. A., Verkerke, H. P., Myles, A., Willis, E., et al. (2018) · Journal of Experimental Medicine · doi:10.1084/jem.20171450 · Cited by 530
Humoral and circulating follicular helper T cell responses in recovered patients with COVID-19
Juno, J. A., Tan, H.-X., Lee, W. S., Reynaldi, A., Kelly, H. G., Wragg, K., Esterbauer, R., Kent, H. E., Batten, C. J., Mordant, F. L., et al. (2020) · Nature Medicine · doi:10.1038/s41591-020-0995-0 · Cited by 437
SARS-CoV-2 mRNA vaccination induces functionally diverse antibodies to NTD, RBD, and S2
Amanat, F., Thapa, M., Lei, T., Ahmed, S. M. S., Adelsberg, D. C., Carreño, J. M., Strohmeier, S., Schmitz, A. J., Zafar, S., Zhou, J. Q., et al. (2021) · Cell · doi:10.1016/j.cell.2021.06.005 · Cited by 273
Prolonged evolution of the human B cell response to SARS-CoV-2 infection
Sakharkar, M., Rappazzo, C. G., Wieland-Alter, W. F., Hsieh, C.-L., Wrapp, D., Esterman, E. S., Kaku, C. I., Wec, A. Z., Geoghegan, J. C., McLellan, J. S., et al. (2021) · Science Immunology · doi:10.1126/sciimmunol.abg6916 · Cited by 174
Research works printed but not linked: 17
- 10.1038/s41577-021-00522-1 · DOI
- Thomas, Safety and efficacy of the BNT162b2 mRNA Covid-19 vaccine through 6 months, N Engl J Med
- 10.1016/j.immuni.2021.08.001 · DOI · Paper page
- CDC. If You Need a Second Shot. https://www.cdc.gov/coronavirus/2019-ncov/vaccines/second-shot.html Updated October 18, 2021. Accessed November 3, 2021 · DOI
- Mateus J, et al. Low dose mRNA-1273 COVID-19 vaccine generates durable T cell memory and antibodies enhanced by pre-existing crossreactive T cell memory [preprint]. https://doi.org/10.1101/2021.06.30.21259787 Posted on medRxiv July 5, 2021 · DOI · Paper page
- 10.1038/s41591-021-01329-2 · DOI · Paper page
- Sheikh-Mohamed S, et al. A mucosal antibody response is induced by intra-muscular SARS-CoV-2 mRNA vaccination [preprint]. https://doi.org/10.1101/2021.08.01.21261297 Posted on medRxiv August 19, 2021 · DOI
- Cho, Anti- SARS-CoV-2 receptor binding domain antibody evolution after mRNA vaccination, Nature
- 10.1038/s41586-021-03738-2 · DOI · Paper page
- Ssemaganda A, et al. Expansion of tissue-resident CD8+ T cells and CD4+ Th17 cells in the nasal mucosa following mRNA COVID-19 vaccination [preprint]. https://doi.org/10.1101/2021.05.07.442971 Posted on bioRxiv May 9, 2021 · DOI
- 10.1126/sciimmunol.abf7550 · DOI
- 10.1038/s41590-020-0762-x · DOI · Paper page
- Wang, 2021, Identification of potential vaccine targets for COVID-19 by combining single-cell and bulk TCR sequencing, Clin Transl Med, 11, 10.1002/ctm2.430 · DOI
- Westmeier, 2020, Impaired cytotoxic CD8+ T cell response in elderly COVID-19 patients, mBio, 11, e02243, 10.1128/mBio.02243-20 · DOI
- 10.3389/fimmu.2021.693054 · DOI
- 10.1172/JCI141054 · DOI
- Mudd PA, et al. SARS-CoV-2 mRNA vaccination elicits robust and persistent T follicular helper cell response in humans [preprint]. https://doi.org/10.1101/2021.09.08.459485 Posted on bioRxiv September 8, 2021 · DOI
Cited by
Sorted by citations
Tong, R., Luo, L., Zhao, Y., Sun, M., Li, R., Zhong, J., Chen, Y., Hu, L., Li, Z., Shi, J., et al. (2023) · Emerging Microbes & Infections · doi:10.1080/22221751.2023.2187245 · Cited by 21
Zhou, C., Sun, M., Huang, X., Liu, P., Ouyang, Z., Wu, M., Yuan, L., Chen, J., Shu, W., Cao, T., et al. (2025) · hLife · doi:10.1016/j.hlife.2025.04.008 · Cited by 5
Metadata
- Authors
- Sureshchandra, S., Lewis, S. A., Doratt, B. M., Jankeel, A., Coimbra Ibraim, I., & Messaoudi, I.
- Affiliations
- Department of Molecular Biology and Biochemistry,
- Venue
- JCI Insight
- Published
- 2021-12-22
- Volume
- 6
- Issue
- 24
- ISSN
- 2379-3708
- PMC
- PMC8783687
- Cited by
- 91
- References
- 13
- Language
- en
- Funders
- National Institutes of Health (UL1TR001414, F31 A028704)
About these checks
Registry, retraction, Cites and statistics results are computed, not judged, with one exception: a printed reference that no index lists is read once by a model before it counts as a citation error. Claims are extracted by a model and kept only when their quote appears verbatim in the text; each cited source is then checked, with a model’s help, for whether it says what the claim relies on. Those verdicts can be wrong — read the claim’s quote and the cited source before relying on one.
Statistics and arithmetic are recomputed, not judged.
Confidence bands are shown only for fields calibrated on our annotated test set. None is calibrated yet, so no band is shown.
What counts as a claim ›How we measure confidence ›How we check this ›
Are you an author, or do you see a problem with this page? Request a review
