

The DOI matches its Crossref record; 75 of the 76 references it cites were found in a registry or an index.
Using multiple genetic variants as instrumental variables for modifiable risk factors
Open accessAbstract
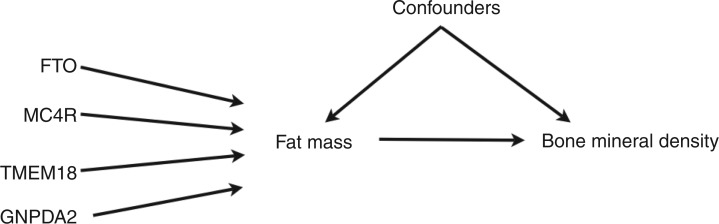
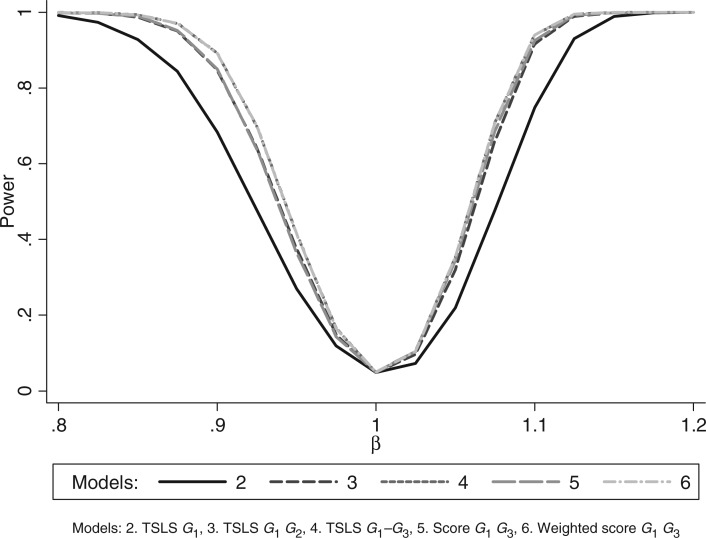
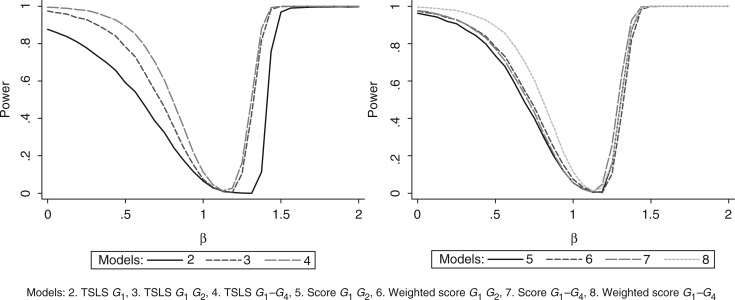
Mendelian randomisation analyses use genetic variants as instrumental variables (IVs) to estimate causal effects of modifiable risk factors on disease outcomes. Genetic variants typically explain a small proportion of the variability in risk factors; hence Mendelian randomisation analyses can require large sample sizes. However, an increasing number of genetic variants have been found to be robustly associated with disease-related outcomes in genome-wide association studies. Use of multiple instruments can improve the precision of IV estimates, and also permit examination of underlying IV assumptions. We discuss the use of multiple genetic variants in Mendelian randomisation analyses with continuous outcome variables where all relationships are assumed to be linear. We describe possible violations of IV assumptions, and how multiple instrument analyses can be used to identify them. We present an example using four adiposity-associated genetic variants as IVs for the causal effect of fat mass on bone density, using data on 5509 children enrolled in the ALSPAC birth cohort study. We also use simulation studies to examine the effect of different sets of IVs on precision and bias. When each instrument independently explains variability in the risk factor, use of multiple instruments increases the precision of IV estimates. However, inclusion of weak instruments could increase finite sample bias. Missing data on multiple genetic variants can diminish the available sample size, compared with single instrument analyses. In simulations with additive genotype-risk factor effects, IV estimates using a weighted allele score had similar properties to estimates using multiple instruments. Under the correct conditions, multiple instrument analyses are a promising approach for Mendelian randomisation studies. Further research is required into multiple imputation methods to address missing data issues in IV estimation.
Overview
The claims and statistics of this paper haven’t been checked yet.
Run the check — free, no account needed. It reads the open-access text and checks the sources it cites.
Integrity signals
Registry
Cites
Statistics
Figures
Verification
Claims the paper makes
The claims and statistics of this paper haven’t been checked yet.
Run the check — free, no account needed. It reads the open-access text and checks the sources it cites.
Claims other papers make about this one
Each is checked against this paper’s own text: does it say what the citing paper says it does?
The cited source doesn’t support the claim as written.
In the citing paper
“All three of these SNPs have previously been shown to be strong instruments for MR analysis as measured by F-statistics > 10 [8,18]”
From Associations of genetically determined iron status across the phenome: A mendelian randomization study (2019) · cites this paper as [18]
Checked by a reasoning model — may be wrong.
Experimental — accuracy not yet measuredIn the citing paper
“Interpretation of results from MR studies relies on four conditions.12,24”
From Mendelian randomization (2022) · cites this paper as [24]
Self-check
Percentages, sums and reported differences re-computed from the paper’s own numbers.
The self-check needs the paper’s full text.
Citations
Cites
(2001) · RePEc: Research Papers in Economics · Cited by 27,577
Specification Tests in Econometrics
Hausman, J. A. (1978) · Econometrica · doi:10.2307/1913827 · Cited by 18,820
Statistical Analysis With Missing Data
Lahiff, M., Little, R. J. A., & Rubin, D. B. (1989) · Journal of the American Statistical Association · doi:10.2307/2289883 · Cited by 17,385
Large Sample Properties of Generalized Method of Moments Estimators
Hansen, L. P. (1982) · Econometrica · doi:10.2307/1912775 · Cited by 13,467
Genome-wide association study of 14,000 cases of seven common diseases and 3,000 shared controls
The Wellcome Trust Case Control Consortium, Management Committee, Burton, P. R., Clayton, D. G., Cardon, L. R., Craddock, N., Deloukas, P., Duncanson, A., Kwiatkowski, D. P., McCarthy, M. I., et al. (2007) · Nature · doi:10.1038/nature05911 · Cited by 9,442
Self-citationStatistical Analysis with Missing Data
Little, R. J. A., & Rubin, D. B. (2002) · Wiley Series in Probability and Statistics · doi:10.1002/9781119013563 · Cited by 8,473
Genetics of Food Intake Self-Regulation in Childhood: Literature Review and Research Opportunities
Faith, M. S., Carnell, S., & Kral, T. V. E. (2013) · Human Heredity · doi:10.1159/000353879 · Cited by 7,633
Instrumental Variables Regression with Weak Instruments
Staiger, D., & Stock, J. H. (1997) · Econometrica · doi:10.2307/2171753 · Cited by 7,081
Lippa, N. C., & Sanderson, S. C. (2013) · Human Heredity · doi:10.1159/000353712 · Cited by 6,095
Davey Smith, G., & Ebrahim, S. (2003) · International Journal of Epidemiology · doi:10.1093/ije/dyg070 · Cited by 5,882
Research works printed but not linked: 3
- Youngman LD, 2000, Circulation, 102, 31
- Pierce BL, 2010, Int J Epidemiol
- Davey Smith G, 2010, Genes Nutr
Cited by
Sorted by citations
Items 701–800 of 1,000
Shao, Y., Lu, Y., Gu, Y., Chen, Y., & Li, C. (2025) · Frontiers in Medicine · doi:10.3389/fmed.2025.1427144 · Cited by 3
“The F -statistic was employed to gauge the tool’s strength, thus mitigating the risk of weak instruments bias (20, 21).”
Fu, W., Chang, N., Liang, H., Xu, R., Yang, K., Xu, L., & Wang, X. (2025) · Journal of Translational Medicine · doi:10.1186/s12967-025-07191-x · Cited by 4
“The F-statistic was calculated for each SNP to evaluate its association with the exposure, and only SNPs with an F-statistic greater than 10 were included [52].”
Berstein, F. M., Goncalves-Soares, A., Yang, Q., McBride, N., Bond, T. A., Arab, M. A., Fernández‐Sanlés, A., Magnus, M. C., Sanderson, E. C. M., Hart, E. J., et al. (2026) · BMC Medicine · doi:10.1186/s12916-025-04548-3 · Cited by 3
“…meta-analyses by calculating the F-statistic and R 2 for the selected SNPs as follows: R 2 ( 2 β 2 SD × MAF × ( 1 − MAF )) [49] and F = β 2 se 2 [50], where MAF is the minor allele frequency, N is the sample size, and β is the effect estimate of the instrumental variable—blood pressure…”
Circulating Copper and Liver Cancer
Chen, W., Zhang, Z., Liu, K., Jiang, D., Sun, X., Mao, Y., Li, S., & Ye, D. (2023) · Biological Trace Element Research · doi:10.1007/s12011-023-03554-x · Cited by 3
“Secondly, the potential confounding factors should fail to influence the IVs related to circulating copper and liver cancer.”
MethodInfluentialJiang, Y., Ping, J., Lu, H., Zhang, H., Liu, M., Li, Y., & Zhou, G. (2023) · Molecular Genetics and Genomics · doi:10.1007/s00438-023-02035-z · Cited by 3
“Strength estimates of the IVs We used the F statistic to assess the strength of the IVs in our MR analyses as described previously (Palmer et al. 2012).”
BackgroundMethodInfluentialChen, X., Li, X. Y., YANG, K. Y., & Fang, J. (2024) · Clinical Oral Investigations · doi:10.1007/s00784-024-05591-9 · Cited by 3
“Only those SNPs with F > 10 are eligible for subsequent analysis using the following formulas [15, 16]: To explore the presence of horizontal pleiotropy, we conducted MR Pleiotropy RESidual Sum and Outlier (MR PRESSO) analysis, with particular attention to any outliers in cases where horizontal…”
MethodCausal Relationship Between Immune Cells/Cytokines and Dilated Cardiomyopathy
Qi, B., Huang, N., Yang, Z., Zheng, W., & Gui, C. (2024) · International Heart Journal · doi:10.1536/ihj.23-215 · Cited by 3
Association between glaucoma and stroke: A bidirectional mendelian randomization study
Wang, K., Lin, X., Sheng, S., Chen, D., Liu, X., & Yao, K. (2024) · Advances in Ophthalmology Practice and Research · doi:10.1016/j.aopr.2024.04.003 · Cited by 3
“41 Sensitivity analyses were performed by omitting SNPs associated with metabolic factors and calculating a pooled estimate for the remaining SNPs to evaluate whether the results were affected markedly.”
MethodRen, F., Yang, C., Feng, K., Shang, Q., Liu, J., Kang, X., Wang, X., & Wang, X. (2024) · Aging · doi:10.18632/aging.205745 · Cited by 3
Liang, X., Huang, X., Cheng, Y., Wang, Z., Song, Y., Shu, Q., & Xie, N. (2024) · Frontiers in Genetics · doi:10.3389/fgene.2024.1392518 · Cited by 3
Pan, R., Sun, C., Zheng, L., Liu, J., & Xu, W. (2024) · Frontiers in Genetics · doi:10.3389/fgene.2024.1334972 · Cited by 3
Gut Microbiota, Human Blood Metabolites, and Esophageal Cancer: A Mendelian Randomization Study
Xiuzhi, L. I., Xu, B., Yang, H., & Zhu, Z. (2024) · Genes · doi:10.3390/genes15060729 · Cited by 4
“The estimated F-statistics for exposure, which were used to quantify the IVs, ranged from 19 to 57, which is consistent with the notion of F > 10 for MR studies and enables us to remove weak instrumental variable bias [21].”
MethodZheng, X., Wang, Y., Wang, Y., Wang, X., Pei, L., Zhao, S., Gong, F., Li, R., Liu, H., Liu, W., et al. (2024) · Frontiers in Immunology · doi:10.3389/fimmu.2024.1417716 · Cited by 3
Nie, J., Zhang, Y., Ma, J., Xue, Q., Hu, M., & Qi, H. (2024) · Frontiers in Psychiatry · doi:10.3389/fpsyt.2024.1442679 · Cited by 3
Yue, J., Fang, H., Chen, S., Gu, L., & Ren, G. (2024) · Aging · doi:10.18632/aging.206042 · Cited by 3
Educational attainment, brain cortical structure, and sarcopenia: a Mendelian randomization study
Zhang, Y., Wang, R., Chen, Z., Zhou, F., & Su, S. (2024) · Frontiers in Public Health · doi:10.3389/fpubh.2024.1415343 · Cited by 3
Guo, Z., Zhang, J., Hu, Z., Wu, J., Zhou, W., Zhang, W., & Zhu, S. (2024) · Journal of Cancer · doi:10.7150/jca.98769 · Cited by 3
“Afterwards, the F test was used to exclude factor variables that were considered to be weak, using a standard threshold of F >10 [11].”
Duan, H., Tao, L., Wu, K., Li, Q., Zhou, X., Dong, P., Sun, X., Lin, L., Ma, X., Zhao, R., et al. (2024) · Frontiers in Psychiatry · doi:10.3389/fpsyt.2024.1425730 · Cited by 4
“In essence, this approach calculates statistical power by considering variables such as the sample size in genome-wide association studies (GWAS), the proportion of cases in case-control GWAS, and the variance explained by the genetic tools related to the exposure (31, 32).”
Wei, J., Li, J., Li, T., Xu, T., Zhang, Y., Yang, S., Wu, H. J., & Hao, H. (2024) · Arthritis Research & Therapy · doi:10.1186/s13075-024-03445-z · Cited by 3
“A variety of methods were used to determine whether a causal relationship exists between immune cells with RA and AS, including inverse variance weighted (IVW) [35], MR-Egger [33], weighted median [36], weighted model [37], and simple model [38] methods.”
Causality between gut microbiota, immune cells, and breast cancer: Mendelian randomization analysis
Lv, R., Wang, D., Wang, T., Li, R., & Aiwen, Z. (2024) · Medicine · doi:10.1097/md.0000000000040815 · Cited by 5
Li, B., Xu, J., Zheng, Q., Gao, J., Ren, Q., & Zhou, Y. (2024) · The Journal of Clinical Endocrinology & Metabolism · doi:10.1210/clinem/dgae843 · Cited by 2
Miao, L.-T., Xiang, J., Yang, Y., Hong, S., Sun, J., Zhang, S., Gong, Y., Xia, Q., & Wang, S. (2025) · Kidney Diseases · doi:10.1159/000545550 · Cited by 3
“The F-statistics were computed using the following formula [31 – 33]: In this formula, N is the sample size in the selected exposure dataset and R 2 represents the degree of variation explained by each SNP, which is calculated as the following formula: where β is the amount of SNP effect on…”
Chen, P., Zhao, L., Mo, X., Liu, Q., Cai, J., Liang, Y., Zhong, L., Li, X., Qiu, T., Zhang, T., et al. (2025) · Journal of Affective Disorders · doi:10.1016/j.jad.2025.04.092 · Cited by 5
Wang, Q., Li, S., Li, H., Yang, X., Jiang, F., Zhang, N., Han, M., & Jia, C. (2017) · American Journal on Addictions · doi:10.1111/ajad.12507 · Cited by 3
“The genetic risk score (weighted score) was the sum of each genotype multiplied by its estimated coefficient from the regression of the risk factors on that particular genotype, and then divided by the sum of the weights (the sum of each coefficient) (Equation (1)).(28,29)”
MethodSong, W., Cao, H., Zhang, D., Xu, H., Zhang, Q., Wang, Z., Li, S., Wang, W., Hu, W., Wang, B., et al. (2021) · BMC Medical Genomics · doi:10.1186/s12920-021-01044-4 · Cited by 3
Mazidi, M., Dehghan, A., & Banach, M. (2021) · Nutrients · doi:10.3390/nu13082563 · Cited by 3
“All instruments had F statistics of more than 10, ranging from 19 to 79 [16].”
BackgroundMethodMazidi, M., Katsiki, N., & Banach, M. (2023) · Journal of the American Nutrition Association · doi:10.1080/07315724.2019.1664955 · Cited by 3
Chen, C., Wan, B., Lu, W., & Lu, J. (2023) · Environmental Science and Pollution Research · doi:10.1007/s11356-023-27420-4 · Cited by 3
“Utilizing RadialMR, outliers were identified in IVW and MR-Egger regression models (Palmer et al. 2012).”
MethodUnravelling the genetic causality of immunoglobulin G N-glycans in ischemic stroke
Wang, B., Gao, L., Zhang, J., Meng, X., Xu, X., Hou, H., Xing, W., Wang, W., & Wang, Y. (2023) · Glycoconjugate Journal · doi:10.1007/s10719-023-10127-6 · Cited by 3
Gu, D., Ou, S., & Liu, G. (2023) · Frontiers in Psychiatry · doi:10.3389/fpsyt.2023.1152005 · Cited by 3
“48%, and the F-statistic was 25, satisfying the threshold of >10 (21).”
BackgroundCausal links of α-thalassemia indices and cardiometabolic traits and diabetes: MR study
Hsu, L., Wu, S., Teng, M., & Ko, Y. (2023) · Life Science Alliance · doi:10.26508/lsa.202302204 · Cited by 3
Zhu, Y., Wang, Q., Dai, H., Hou, T., Wang, T., Zhao, Z., Li, M., Miao, W., Yang, J., Lu, J., et al. (2023) · Diabetes Obesity and Metabolism · doi:10.1111/dom.15326 · Cited by 3
“23”
Dong, J., Jiang, W., Zhang, W., Hu, R.-H., Huang, Z., Guo, T., Du, T., & Jiang, X.-H. (2024) · Environmental Toxicology · doi:10.1002/tox.24147 · Cited by 3
“28 Next, we used R 2 and F -statistics to detect the strength of the included SNPs. 29 If the F statistic exceeds 10 ( F -statistic = 2) and forest plots (Figure 3).”
MethodWu, Y., Li, Z., Chen, X., Wu, S., Zhong, X., Zheng, A., Li, L., Chen, H., Li, J., Lu, Y., et al. (2024) · BMC Medical Genomics · doi:10.1186/s12920-023-01783-6 · Cited by 3
“To evaluate the strength of genetic instruments for various forms of mental health and socioeconomic status, we calculated the F statistics for each SNP. IVs with F statistics less than 10 were considered weak instruments, and the exposure would not be included in MR analysis [20].”
MethodGu, L., Liu, W., Huang, J., Zhu, L., Hu, X., Yue, J., & Lin, J. (2024) · BMC Pulmonary Medicine · doi:10.1186/s12890-024-02962-6 · Cited by 3
“An F statistic of ≥ 10 indicates a relatively low risk of weak instrument bias in MR analysis [14].”
BackgroundMethodFu, L., Yu, J., Chen, Z., Gao, F., Zhang, Z., Fu, J., Feng, W., Hong, P., & Jin, J. (2024) · Infectious Agents and Cancer · doi:10.1186/s13027-024-00577-4 · Cited by 3
“To avoid bias from weak instrumental variables, our criteria included only SNPs with an F statistic greater than 10 [16, 17].”
MethodZhang, W., Sun, J., Yu, H., Shi, M., Hu, H., & Yuan, H. (2024) · Frontiers in Endocrinology · doi:10.3389/fendo.2024.1405517 · Cited by 4
Jie, J., Gong, Y., Luo, S., Yang, X., & Guo, K. (2024) · Frontiers in Immunology · doi:10.3389/fimmu.2024.1404260 · Cited by 3
“SNP clumping (kb = 10,000, r 2 = 0.001) was performed to remove SNPs in linkage disequilibrium (LD), and, where possible, allele frequency information was used to infer and harmonize the forward strand for palindromic SNPs. Incompatible SNPs were excluded.”
BackgroundInfluentialRen, Y., & Zhang, H. (2024) · Human Immunology · doi:10.1016/j.humimm.2024.110830 · Cited by 3
Zhang, T., Qiao, J., Wang, Y., Zhou, Y., Hamoudi, H. J. A. S., Alhendi, M. A., & Wang, J. (2024) · Frontiers in Endocrinology · doi:10.3389/fendo.2024.1388608 · Cited by 3
Wei, L., Wang, S., Xu, S., & Zhang, C. (2024) · Journal of Reproductive Immunology · doi:10.1016/j.jri.2024.104293 · Cited by 3
Hypertension and iron deficiency anemia: Exploring genetic associations and causal inference
Cao, R., Zhang, J., Chen, Z., Sun, Q., Bai, Y., & Zhang, G. (2024) · Nutrition Metabolism and Cardiovascular Diseases · doi:10.1016/j.numecd.2024.06.017 · Cited by 8
Causal role of immune cells in uveitis: Mendelian randomization study
Wu, J., Fang, C., Zhou, Y., Wang, M., Li, Q., & Dong, S. (2024) · Frontiers in Immunology · doi:10.3389/fimmu.2024.1402074 · Cited by 3
Geng, C., & Chen, C. (2024) · Sleep And Breathing · doi:10.1007/s11325-024-03100-6 · Cited by 3
Liang, Q., & Peng, Z. (2024) · Medicine · doi:10.1097/md.0000000000038977 · Cited by 3
“[37]”
Association of inflammatory cytokines with lung function, chronic lung diseases, and COVID-19
Rontogianni, M. O., Gill, D., Bouras, E., Asimakopoulos, A., Tzoulaki, I., Karhunen, V., Lehtimäki, T. J., Raitakari, O. T., Wielscher, M., Salomaa, V. V., et al. (2024) · iScience · doi:10.1016/j.isci.2024.110704 · Cited by 4
The impact of lipidome on five inflammatory skin diseases: a Mendelian randomization study
Xu, Z., & Wu, W. (2024) · Archives of Dermatological Research · doi:10.1007/s00403-024-03294-5 · Cited by 3
“Finally, the f statistic of IVs is calculated to remove the weak instrumental variables, and an f statistic > 10 indicates that there is no bias due to weak IVs [51].”
Liu, Z., Wang, Y., Wang, S., Wu, J., Cui, J., Tan, X., Liu, X., Huang, X., & Zhang, L. (2024) · Skin Research and Technology · doi:10.1111/srt.13906 · Cited by 2
“28,29 where N denotes the sample size of the exposure (urticaria or inflammatory cytokines), R 2 denotes the proportion of exposures that can be explained for as IVs, which is usually calculated by the following equation: Intheformula, β denotesthealleleeffectvalue,EAFdenotesthefre-quency of the…”
BackgroundRetractedChen, G., Zhao, D., Wen, X., Kong, D., Zhang, J., & Kong, P. (2024) · Journal of Orthopaedic Surgery and Research · doi:10.1186/s13018-024-05059-2 · Cited by 3
“…of the IVs using the following strict mathematical formula: ], N is the total amount of samples in the exposed GWAS, β indicates the impact projection for the genetic variants in the exposed GWAS, and EAF is the frequency of occurrence of an allele (variant form of a gene) in a population [19, 20].”
MethodShi, S., Zhou, Y., Zhang, H., Zhu, Y., Jiang, P., Xie, C., Feng, T., Zeng, Y., He, H., Luo, Y., et al. (2024) · Biomedicines · doi:10.3390/biomedicines12102264 · Cited by 3
“Finally, the F-statistic for each IV was calculated using the following formula: F = R 2 (N − 2)/(1 − R 2 ) [22].”
Pei, X.-Q., Wang, W., Gao, Y.-H., Zhang, T.-X., Liu, J., Zhao, Z., & Zhang, H. (2024) · Frontiers in Microbiology · doi:10.3389/fmicb.2024.1463394 · Cited by 5
Chen, S., Zhu, X., Wang, Q., Jiang, F., & Zhang, J. (2024) · American Heart Journal Plus Cardiology Research and Practice · doi:10.1016/j.ahjo.2024.100482 · Cited by 3
Wei, C., Li, C., Zhang, G., Li, H., Li, J., & Zeng, J. (2024) · Biochemical Genetics · doi:10.1007/s10528-024-10966-4 · Cited by 3
“Calculate the F statistic[ ( eaf stands for effect allele frequency, and N is the sample size), and exclude weak IVs (F < 10) (Palmer et al. 2012; Bowden et al. 2016).”
InfluentialFeng, J. F., Qi, X., Chen, C., Li, B., Wang, M., Xie, X., Yang, K., Liu, X., Chen, R. M., Guo, T., et al. (2025) · Scientific Reports · doi:10.1038/s41598-025-90447-9 · Cited by 4
Tong, R., Liang, Z., Zhuo, C., Bai, X., Dao, L., Yu, L., Li, L., Tong, Z., Du, Y., & Xu, L. (2025) · BMC Medical Genomics · doi:10.1186/s12920-025-02143-2 · Cited by 3
“When the F-statistic was over 10, there was a low chance of weak instrument bias [18].”
Duan, Q., Su, W., Gu, X., Long, J., Jiang, Z., Yin, K., Cai, W., Cao, B., Chi, L., Gao, X., et al. (2025) · Brain and Behavior · doi:10.1002/brb3.70766 · Cited by 4
“Third, to ensure a strong correlation and minimize bias from weak IVs, we considered an F -statistic of at least 10 as sufficient for performing an MR analysis, which is well-accepted in the field (Palmer et al. 2012, Jiang et al. 2023).”
Recent Findings on the Genetics of Obesity: Is there Public Health Relevance?
Richmond, R. C., & Timpson, N. J. (2012) · Current Nutrition Reports · doi:10.1007/s13668-012-0027-x · Cited by 3
“Of these limitations, power and population stratification may be overcome with rigorous sampling techniques, whereas the issues of pleiotropy and canalization of effects often are more difficult to quantify and tackle, although considerable advance has been made in the addressing of these [84].”
BackgroundCausal effect of vitamin D on prostate cancer using Mendelian randomization approach
Yu, H., Xu, P., & Cui, Y. (2015) · World Journal of Urology · doi:10.1007/s00345-015-1672-7 · Cited by 3
“To overcome this, the authors could either increase the sample size or use multiple instrument variables to create a genetic risk score [8], which offers a more efficient design for Mendelian randomization study.”
BackgroundGenetic Examination of Hematological Parameters in SARS-CoV-2 Infection and COVID-19Preprint
Sun, Q., Rowland, B. T., Wang, W., Miller-Fleming, T., Cox, N. J., Graff, M., Faucon, A., Shuey, M. M., Blue, E., Auer, P. W., et al. (2022) · medRxiv · doi:10.1101/2022.02.28.22271562 · Cited by 2
Combining Mendelian randomization with the sibling comparison design
Sjölander, A., Frisell, T., Öberg, A. S., Wang, Y., & Hägg, S. (2023) · Statistics in Medicine · doi:10.1002/sim.9983 · Cited by 2
“19 In our sample there were several measured potential confounders for LDL and DBP, including waist-to-hip ratio (WHR), body mass index (BMI; kg/m 2 ), amount of physical exercise per week (graded on a scale from 0 to 6), smoking and alcohol intake (ever vs never), education (total number of years…”
BackgroundZhu, J., Pang, X., Wang, X., Wang, R., Lian, J., Xu, B., Ji, S., & Lu, H. (2024) · World Journal of Oncology · doi:10.14740/wjon1860 · Cited by 2
“The F-statistics of our univariable MR analysis ranged from 46.00 to 90.47 in the Asian population and 152.59 to 258.63 in the European population, suggesting that weak instrument bias may not be substantial in this study (Supplementary Material 6, www.wjon.org) [29].”
MethodInfluentialChang, M., Yao, K., Hao, J.-W., Long, Y., Qiao, L.-L., Zhang, Y., Ma, K., Zhang, S.-X., Li, X.-F., & He, P. F. (2024) · Rheumatology & autoimmunity · doi:10.1002/rai2.12125 · Cited by 2
Zhou, J., Wang, H., Xu, Y., & Liu, Z. (2024) · Medicine · doi:10.1097/md.0000000000038626 · Cited by 2
Gu, R., Chen, L., Hua, M., Miao, H., & Qin, Y. (2024) · International Dental Journal · doi:10.1016/j.identj.2024.07.1210 · Cited by 2
Liu, X., Han, Y., Yan, G., & Sun, M. (2024) · European Journal of Nutrition · doi:10.1007/s00394-024-03491-y · Cited by 3
Qiu, D., Song, R., Cao, X., Tian, Y., Cheng, X., Sun, D., Cai, S., Wang, Z., & Zhang, W. (2024) · Scientific Reports · doi:10.1038/s41598-024-80330-4 · Cited by 2
Chen, J., Chen, J., Liang, C., Liu, C., Liu, J., Liu, B., & Yang, X. (2024) · Neuroprotection/Neuroprotection (Chichester, England. Print) · doi:10.1002/nep3.67 · Cited by 2
Yang, Q., Magnus, M. C., Kilpi, F., Santorelli, G., Soares, A. G., West, J., Magnus, P. M., Håberg, S. E., Tilling, K. M., Lawlor, D. A., et al. (2024) · BMC Pregnancy and Childbirth · doi:10.1186/s12884-024-07023-8 · Cited by 3
lian, Q., Dong, L., Zhou, Q., & Yuan, Q. (2025) · Journal of Stomatology Oral and Maxillofacial Surgery · doi:10.1016/j.jormas.2025.102372 · Cited by 3
Ganapati, R. K., Chen, K., Zhao, X., Zheng, T., Zhang, F., Laiyuan, Z., & Xu, J. (2025) · Rice Science · doi:10.1016/j.rsci.2025.04.006 · Cited by 2
Wang, X., Yang, Y., Wu, G., Liu, S., Cui, Y., & Wu, J. (2025) · Lipids in Health and Disease · doi:10.1186/s12944-025-02573-y · Cited by 2
“If the F-statistic was > 10, this indicated no bias from weak SNPs [33].”
Qian, S., Gong, Y., & Chen, Y. (2025) · Discover Oncology · doi:10.1007/s12672-025-02785-9 · Cited by 2
“The validity of the IVs was evaluated using the F statistic, with an F -value exceeding 10 indicating strong instrument strength and mitigating the risk of weak instrument bias [27].”
Yang, C., Du, Z., Ma, J., Guo, L., Zhang, H., Tian, Y., & Zhao, J. (2025) · Medicine · doi:10.1097/md.0000000000042901 · Cited by 2
Causal association between cathepsins and asthma: a Mendelian randomization study
Qiu, F., Shao, W., Qin, X., Xu, R., Liu, Y., & Lu, H. (2025) · Scientific Reports · doi:10.1038/s41598-025-08457-6 · Cited by 2
Feng, W., Zheng, J., Xiao, J., Wang, Z., Zheng, Y.-F., Jin, X., Xie, J.-Y., Liao, W., Guo, X., & Guan, W. (2025) · Journal of Thoracic Disease · doi:10.21037/jtd-24-1894 · Cited by 2
“An F -statistic below 10 indicates a weak instrumental variable, implying probable bias in the outputs (26).”
Li, C., Xian, X., Zhao, X., Liu, H., Wu, X., Chen, Y., Cao, P., Miao, F., Yan, J., & Zhang, X. (2025) · International Journal of Cardiology · doi:10.1016/j.ijcard.2025.133746 · Cited by 2
Kong, Z., Xu, J., Wei, Y., Diao, L., Wei, L., & Cai, L. (2025) · Journal of Affective Disorders · doi:10.1016/j.jad.2025.120284 · Cited by 2
Xie, W., Yu, J., & Wang, P. (2025) · Journal of Attention Disorders · doi:10.1177/10870547251385350 · Cited by 2
“Moreover, to avoid the bias caused by weak IVs, we utilized the F -statistic to gauge the power of IVs, and in general, the F -statistic greater than 10 indicates an effective IV (Palmer et al., 2012).”
Li, C., Peng, H., Lu, F., Zhang, G., Xu, N., Chen, X., & Gao, X. (2025) · Medicine · doi:10.1097/md.0000000000045513 · Cited by 2
“[33,34] We utilized Mendelian randomization Pleiotropy RESidual Sum and Outlier (MR-PRESSO) and MR-Egger regression tests to assess possible horizontal pleiotropy.”
Liu, L., Liu, B., Li, M., & Qin, L. (2025) · Journal of Ovarian Research · doi:10.1186/s13048-025-01884-z · Cited by 2
“This step ensured that the chosen instruments were sufficiently strong, reducing the risk of bias from weak instruments [21].”
Xue, H., Zang, J., Yang, F., Zhang, L., Yang, X., Zhang, M., Zhang, X., & Wu, L. (2025) · Medicine · doi:10.1097/md.0000000000045824 · Cited by 2
“[24]”
Lin, M., Ge, S., Abuduxukuer, K., Chen, Y. D., Yang, S., Han, K., & Chen, M. (2026) · Food Science & Nutrition · doi:10.1002/fsn3.71475 · Cited by 2
Xiang, B., Zhang, R., Zhou, Y., Zhang, S., Zhao, Y., Yang, X., & Zhou, X. (2026) · European Journal of Preventive Cardiology · doi:10.1093/eurjpc/zwag090 · Cited by 2
Chen, M., Huang, H., Huang, X., Liu, J., Liu, Y., Yu, Q., Ruan, H., Nguyen, S. V., Lu, X., Zheng, S., et al. (2026) · Brain Behavior and Immunity · doi:10.1016/j.bbi.2026.106589 · Cited by 3
Association between obesity and frailty: A two-sample Mendelian randomization
Ji, F., Liu, J., Wang, X., Zhang, J., & Kim, J.-H. (2026) · Aging Medicine and Healthcare · doi:10.4103/amah.amh-2024-12-121 · Cited by 2
Lou, Y., Ma, D., Gan, Q., 許先越, Xiao, Y., Wang, J., Li, Z., Zhang, T., Qi, L., & Feng, S. (2026) · Frontiers in Immunology · doi:10.3389/fimmu.2026.1855966 · Cited by 2
Depression and sarcopenia: a Mendelian randomization analysis
Lu, Y., Zhang, R., & Zheng, Q. (2023) · Psychiatric Genetics · doi:10.1097/ypg.0000000000000346 · Cited by 2
“The MR process could only be established in a robust manner if the following conditions were met: (1) the used genetic instrumental variables (IVs) are robustly associated with exposure; (2) the selected IVs are not related to known or unknown confounder factors; (3) the IVs only have an influence on the outcome depen…”
MethodThe Causal Effect of Gut Microbiota on the Development of Idiopathic Normal Pressure Hydrocephalus
Zhang, H., Mao, W., & Zhang, Y. (2023) · World Neurosurgery · doi:10.1016/j.wneu.2023.11.024 · Cited by 2
Role of polygenic risk scores in the association between chronotype and health risk behaviors
Zhang, Y., Li, S., Xie, Y., Xiao, W., Xu, H., Jin, Z., Li, R., Wan, Y., & Tao, F. (2023) · BMC Psychiatry · doi:10.1186/s12888-023-05337-z · Cited by 2
“Weighted PRS is obtained by the product of the number of mutant alleles and the corresponding weight of the gene loci constructing PRS [64, 65].”
MethodLiu, Y., Li, S., Zhang, X., Huang, B., Fu, Y., Li, X., & Cui, J. (2024) · Nutrition Metabolism and Cardiovascular Diseases · doi:10.1016/j.numecd.2024.01.018 · Cited by 2
Wang, J., Wang, Y., Ou, Q., Yang, S., Jing, J., & Fang, J. (2024) · Cerebral Cortex · doi:10.1093/cercor/bhae061 · Cited by 2
Ma, X.-B., Liu, Y., Lv, Y.-L., & Lin, Q. (2024) · 老年心脏病学杂志:英文版 · doi:10.26599/1671-5411.2024.01.006 · Cited by 2
The causal effect of obesity on concomitant exotropia: A lifecourse Mendelian randomization study
Liu, C., Zhao, Y., Liu, J., & Zhao, Q. (2024) · Medicine · doi:10.1097/md.0000000000037348 · Cited by 2
“[23,24] To estimate the statistical power, a web-based tool (https://shiny. cnsgenomics.com/mRnd/) was used.”
MethodMR-GGI: accurate inference of gene–gene interactions using Mendelian randomization
Oh, W., Jung, J., & Joo, J. (2024) · BMC Bioinformatics · doi:10.1186/s12859-024-05808-4 · Cited by 1
“We apply a fine-mapping method, such as sum of single effects linear regression (susieR [16, 17]) to identify a set of cis-SNPs consisting of independent variants for each gene.”
MethodInfluentialFang, X. M., Wu, C., Ding, W., Xu, D., & Shi, Z. (2024) · Medicine · doi:10.1097/md.0000000000038223 · Cited by 2
Wang, L., & Lu, Y. W. (2024) · Frontiers in Cardiovascular Medicine · doi:10.3389/fcvm.2024.1393383 · Cited by 4
Association between inflammatory factors and melanoma: a bidirectional Mendelian randomization study
Lu, J., Feng, Y., Guo, K., Sun, L., & Zhang, K. (2024) · Cancer Causes & Control · doi:10.1007/s10552-024-01890-4 · Cited by 2
“The F value is calculated using the formula , where R 2 is the SNP’s fraction of variance explaining the function, and N is the GWAS sample size [23].”
Li, L., Zhang, M., Gu, M., Li, J., Li, Z., Zhang, R., Du, C., & Lv, Y. F. (2024) · PLoS ONE · doi:10.1371/journal.pone.0303170 · Cited by 2
Ba, Y., Shen, L., Peng, X., Zhang, Y., & Wang, J. (2024) · Medicine · doi:10.1097/md.0000000000038426 · Cited by 2
“[35] Details of the instrumental variables re shown in Table 1.”
BackgroundMa, X., Zhang, H., Li, G., Ma, J., Cheng, W., Wang, T., & Zhang, Y. (2024) · Heliyon · doi:10.1016/j.heliyon.2024.e32988 · Cited by 2
“In this study, the TwoSampleMR package within the R software environment was utilized to conduct MR analyses [31], including inverse variance weighted (IVW), simple median, MR-Egger, weighted mode, and weighted median; IVW and MR-Egger are the major approaches for estimating the causal effects of a…”
BackgroundMethod
Metadata
- Authors
- Palmer, T. M., Lawlor, D. A., Harbord, R. M., Sheehan, N. A., Tobias, J. H., Timpson, N. J., Smith, G. D., & Sterne, J. A.
- Affiliations
- University of Bristol (GB)
- University of Leicester (GB)
- School of Clinical Sciences, University of Bristol, Bristol, UK
- Corresponding author
- Palmer, Tom M
- ORCID
- Venue
- Statistical Methods in Medical Research
- Publisher
- SAGE Publications
- Published
- 2011-01-07
- Volume
- 21
- Issue
- 3
- Pages
- 223-242
- ISSN
- 0962-2802 (ISSN-L)
- 1477-0334
- PMC
- PMC3917707
- OpenAlex
- W2151096860
- Cited by
- 1,289
- References
- 76
- Citations by year
- 2026: 92 · 2025: 240 · 2024: 394 · 2023: 164 · 2022: 83 · 2021: 67 · 2020: 44 · 2019: 33 · 2018: 22 · 2017: 20 · 2016: 27 · 2015: 44 · 2014: 20 · 2013: 19 · 2012: 14
- FWCI
- 11.61
- Type
- journal article
- Language
- en
- Open access
- green
- www.ncbi.nlm.nih.gov
- Locations
- Statistical Methods in Medical Research (publishedVersion)
- Europe PMC (PubMed Central) (publishedVersion, cc-by)
- PubMed Central (publishedVersion, cc-by)
- PubMed (publishedVersion)
- Adelaide Research & Scholarship (AR&S) (University of Adelaide) (submittedVersion)
- Lancaster EPrints (Lancaster University) (submittedVersion)
- Figshare (submittedVersion, cc-by)
- Leicester Research Archive (University of Leicester) (submittedVersion, cc-by)
- Bristol Research (University of Bristol) (submittedVersion, cc-by)
- Funders
- Wellcome Trust (G0600705, 092731)
- University of Bristol (G0600705)
- Medical Research Council (G0600705)
- Economic and Social Research Council (ES/E00234X/1)
- Topics
- Life Sciences › Biochemistry, Genetics and Molecular Biology › Genetics › Genetic Associations and Epidemiology
- Physical Sciences › Mathematics › Statistics and Probability › Advanced Causal Inference Techniques
- Life Sciences › Biochemistry, Genetics and Molecular Biology › Genetics › Genetics and Physical Performance
- Keywords
- Mendelian randomization, modifiable risk factors, weak instruments, finite-sample bias, fat mass, bone mineral density, children, causal effect estimation, continuous outcomes
- MeSH terms
- Female, Genotype, Humans, Male, Risk Factors, Genetic Variation, Mendelian Randomization Analysis
About these checks
Registry, retraction, Cites and statistics results are computed, not judged, with one exception: a printed reference that no index lists is read once by a model before it counts as a citation error. Claims are extracted by a model and kept only when their quote appears verbatim in the text; each cited source is then checked, with a model’s help, for whether it says what the claim relies on. Those verdicts can be wrong — read the claim’s quote and the cited source before relying on one.
Statistics and arithmetic are recomputed, not judged.
Confidence bands are shown only for fields calibrated on our annotated test set. None is calibrated yet, so no band is shown.
What counts as a claim ›How we measure confidence ›How we check this ›
Are you an author, or do you see a problem with this page? Request a review
