

The DOI matches its Crossref record; 75 of the 76 references it cites were found in a registry or an index.
Using multiple genetic variants as instrumental variables for modifiable risk factors
Open accessAbstract
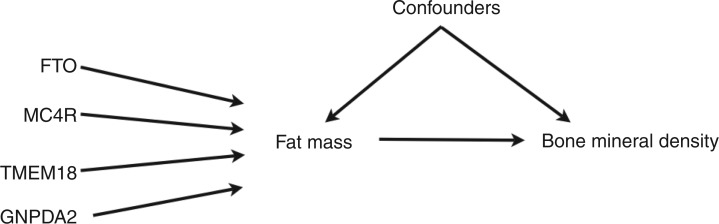
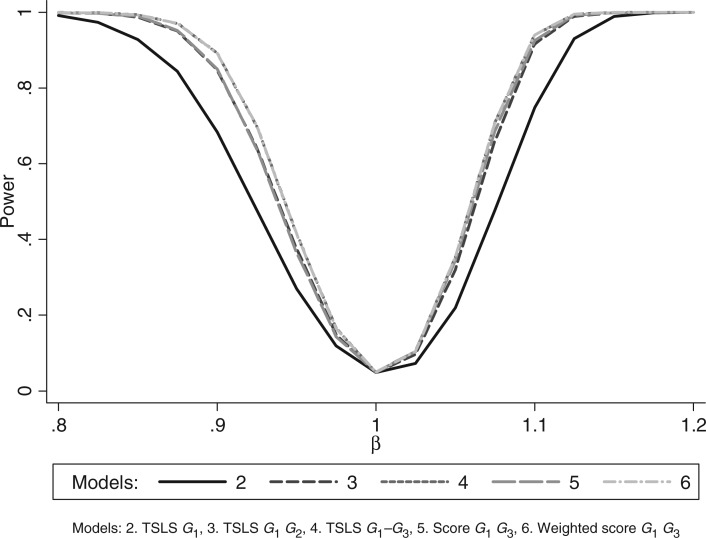
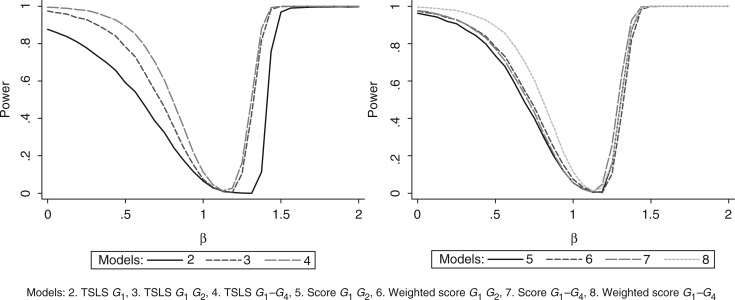
Mendelian randomisation analyses use genetic variants as instrumental variables (IVs) to estimate causal effects of modifiable risk factors on disease outcomes. Genetic variants typically explain a small proportion of the variability in risk factors; hence Mendelian randomisation analyses can require large sample sizes. However, an increasing number of genetic variants have been found to be robustly associated with disease-related outcomes in genome-wide association studies. Use of multiple instruments can improve the precision of IV estimates, and also permit examination of underlying IV assumptions. We discuss the use of multiple genetic variants in Mendelian randomisation analyses with continuous outcome variables where all relationships are assumed to be linear. We describe possible violations of IV assumptions, and how multiple instrument analyses can be used to identify them. We present an example using four adiposity-associated genetic variants as IVs for the causal effect of fat mass on bone density, using data on 5509 children enrolled in the ALSPAC birth cohort study. We also use simulation studies to examine the effect of different sets of IVs on precision and bias. When each instrument independently explains variability in the risk factor, use of multiple instruments increases the precision of IV estimates. However, inclusion of weak instruments could increase finite sample bias. Missing data on multiple genetic variants can diminish the available sample size, compared with single instrument analyses. In simulations with additive genotype-risk factor effects, IV estimates using a weighted allele score had similar properties to estimates using multiple instruments. Under the correct conditions, multiple instrument analyses are a promising approach for Mendelian randomisation studies. Further research is required into multiple imputation methods to address missing data issues in IV estimation.
Overview
The claims and statistics of this paper haven’t been checked yet.
Run the check — free, no account needed. It reads the open-access text and checks the sources it cites.
Integrity signals
Registry
Cites
Statistics
Figures
Verification
Claims the paper makes
The claims and statistics of this paper haven’t been checked yet.
Run the check — free, no account needed. It reads the open-access text and checks the sources it cites.
Claims other papers make about this one
Each is checked against this paper’s own text: does it say what the citing paper says it does?
The cited source doesn’t support the claim as written.
In the citing paper
“All three of these SNPs have previously been shown to be strong instruments for MR analysis as measured by F-statistics > 10 [8,18]”
From Associations of genetically determined iron status across the phenome: A mendelian randomization study (2019) · cites this paper as [18]
Checked by a reasoning model — may be wrong.
Experimental — accuracy not yet measuredIn the citing paper
“Interpretation of results from MR studies relies on four conditions.12,24”
From Mendelian randomization (2022) · cites this paper as [24]
Self-check
Percentages, sums and reported differences re-computed from the paper’s own numbers.
The self-check needs the paper’s full text.
Citations
Cites
(2001) · RePEc: Research Papers in Economics · Cited by 27,577
Specification Tests in Econometrics
Hausman, J. A. (1978) · Econometrica · doi:10.2307/1913827 · Cited by 18,820
Statistical Analysis With Missing Data
Lahiff, M., Little, R. J. A., & Rubin, D. B. (1989) · Journal of the American Statistical Association · doi:10.2307/2289883 · Cited by 17,385
Large Sample Properties of Generalized Method of Moments Estimators
Hansen, L. P. (1982) · Econometrica · doi:10.2307/1912775 · Cited by 13,467
Genome-wide association study of 14,000 cases of seven common diseases and 3,000 shared controls
The Wellcome Trust Case Control Consortium, Management Committee, Burton, P. R., Clayton, D. G., Cardon, L. R., Craddock, N., Deloukas, P., Duncanson, A., Kwiatkowski, D. P., McCarthy, M. I., et al. (2007) · Nature · doi:10.1038/nature05911 · Cited by 9,442
Self-citationStatistical Analysis with Missing Data
Little, R. J. A., & Rubin, D. B. (2002) · Wiley Series in Probability and Statistics · doi:10.1002/9781119013563 · Cited by 8,473
Genetics of Food Intake Self-Regulation in Childhood: Literature Review and Research Opportunities
Faith, M. S., Carnell, S., & Kral, T. V. E. (2013) · Human Heredity · doi:10.1159/000353879 · Cited by 7,633
Instrumental Variables Regression with Weak Instruments
Staiger, D., & Stock, J. H. (1997) · Econometrica · doi:10.2307/2171753 · Cited by 7,081
Lippa, N. C., & Sanderson, S. C. (2013) · Human Heredity · doi:10.1159/000353712 · Cited by 6,095
Davey Smith, G., & Ebrahim, S. (2003) · International Journal of Epidemiology · doi:10.1093/ije/dyg070 · Cited by 5,882
Research works printed but not linked: 3
- Youngman LD, 2000, Circulation, 102, 31
- Pierce BL, 2010, Int J Epidemiol
- Davey Smith G, 2010, Genes Nutr
Cited by
Sorted by citations
Mendelian Randomization Analysis With Multiple Genetic Variants Using Summarized Data
Burgess, S., Butterworth, A., & Thompson, S. G. (2013) · Genetic Epidemiology · doi:10.1002/gepi.21758 · Cited by 6,050
“This problem can be partially redressed by the use of multiple genetic variants [Palmer et al., 2011].”
BackgroundMendelian Randomization as an Approach to Assess Causality Using Observational Data
Sekula, P., Del Greco M, F., Pattaro, C., & Köttgen, A. (2016) · Journal of the American Society of Nephrology · doi:10.1681/asn.2016010098 · Cited by 2,351
Sanderson, E., Glymour, M. M., Holmes, M. V., Kang, H., Morrison, J., Munafò, M. R., Palmer, T., Schooling, C. M., Wallace, C., Zhao, Q., et al. (2022) · Nature Reviews Methods Primers · doi:10.1038/s43586-021-00092-5 · Cited by 2,229
Self-citationA review of instrumental variable estimators for Mendelian randomization
Burgess, S., Small, D. S., & Thompson, S. G. (2015) · Statistical Methods in Medical Research · doi:10.1177/0962280215597579 · Cited by 1,769
Detecting pleiotropy in Mendelian randomisation studies with summary data and a continuous outcome
Greco M, F. D., Minelli, C., Sheehan, N. A., & Thompson, J. R. (2015) · Statistics in Medicine · doi:10.1002/sim.6522 · Cited by 1,700
“When using data on G − X and G − Y that was collected on the same subjects, formal testing of pleiotropy can be performed using the Sargan test [13], an over-identification test associated with the two-stage regression that tests the null hypothesis that all instruments provide the same MR estimate [12].”
BackgroundMethodSelf-citationPierce, B. L., & Burgess, S. (2013) · American Journal of Epidemiology · doi:10.1093/aje/kwt084 · Cited by 1,389
“A possible solution to this is the use of multiple IVs, when available (7, 16).”
MethodPleiotropy in complex traits: challenges and strategies
Solovieff, N., Cotsapas, C., Lee, P. H., Purcell, S. M., & Smoller, J. W. (2013) · Nature Reviews Genetics · doi:10.1038/nrg3461 · Cited by 1,085
Vimaleswaran, K. S., Berry, D. J., Lu, C., Tikkanen, E., Pilz, S., Hiraki, L. T., Cooper, J. D., Dastani, Z., Li, R., Houston, D. K., et al. (2013) · PLoS Medicine · doi:10.1371/journal.pmed.1001383 · Cited by 1,046
“One of the methodological challenges of the MR approach relates to the large sample size requirement, arising from the availability of relatively weak instruments for most exposures [22,31].”
BackgroundMendelian randomization of blood lipids for coronary heart disease
Holmes, M. V., Asselbergs, F. W., Palmer, T. M., Drenos, F., Lanktree, M. B., Nelson, C. P., Dale, C. E., Padmanabhan, S., Finan, C., Swerdlow, D. I., et al. (2015) · European Heart Journal · doi:10.1093/eurheartj/eht571 · Cited by 748
“This should increase power, because each additional SNP contributes incrementally to the explained variance in the lipid fraction of interest and reduces the lack of specificity often observed with single SNPs, because the effects on traits other than the lipid fraction of interest should be small, non-systematic, and…”
Self-citationBurgess, S. (2014) · International Journal of Epidemiology · doi:10.1093/ije/dyu005 · Cited by 637
“With an allele score, power can be further increased by the use of relevant weights for the variants.10 Provided that weights are not derived naively from the data under analysis, the allele score approach avoids some of the problems of bias from weak instruments resulting from using many IVs.24 A disadvantage of the…”
MethodInfluentialElevated C-reactive protein in the diagnosis, prognosis, and cause of cancer
Allin, K. H., & Nordestgaard, B. G. (2011) · Critical Reviews in Clinical Laboratory Sciences · doi:10.3109/10408363.2011.599831 · Cited by 563
Mendelian Randomization: New Applications in the Coming Age of Hypothesis-Free Causality
Evans, D. M., & Smith, G. D. (2015) · Annual Review of Genomics and Human Genetics · doi:10.1146/annurev-genom-090314-050016 · Cited by 529
“When multiple instruments are available, it may be possible to fit a series of models involving different instruments (34, 88).”
BackgroundUse of allele scores as instrumental variables for Mendelian randomization
Burgess, S., & Thompson, S. G. (2013) · International Journal of Epidemiology · doi:10.1093/ije/dyt093 · Cited by 452
Selecting instruments for Mendelian randomization in the wake of genome-wide association studies.
Swerdlow, D. I., Kuchenbaecker, K. B., Shah, S., Sofat, R., Holmes, M. V., White, J., Mindell, J. S., Kivimaki, M., Brunner, E. J., Whittaker, J. C., et al. (2016) · International Journal of Epidemiology · doi:10.1093/ije/dyw088 · Cited by 387
“For weighted scores, the effect size should ideally be calculated in a dataset independent from that used for the MR analysis, to reduce bias as a consequence of over-fitting.17 A further enhancement of the multi-locus approach has been to use information from multiple SNPs but to treat them as individual instrumental…”
MethodInfluentialVimaleswaran, K. S., Cavadino, A., Berry, D. J., Jorde, R., Dieffenbach, A. K., Lu, C., Alves, A. C., Heerspink, H. J. L., Tikkanen, E., Eriksson, J., et al. (2014) · The Lancet Diabetes & Endocrinology · doi:10.1016/s2213-8587(14)70113-5 · Cited by 373
Statistical methods for Mendelian randomization in genome-wide association studies: A review
Boehm, F. J., & Zhou, X. (2022) · Computational and Structural Biotechnology Journal · doi:10.1016/j.csbj.2022.05.015 · Cited by 333
“Schatzkin [41] resolved this issue by proposing use of multiple SNP instruments in MR analysis.”
MethodMendelian randomization: where are we now and where are we going?
Burgess, S., Timpson, N. J., Ebrahim, S. B. J., & Smith, G. D. (2015) · International Journal of Epidemiology · doi:10.1093/ije/dyv108 · Cited by 313
Glymour, M. M., Tchetgen Tchetgen, E. J., & Robins, J. M. (2012) · American Journal of Epidemiology · doi:10.1093/aje/kwr323 · Cited by 292
“Overidentification tests can use multiple genes, each of which influences the phenotype of interest; they will thus become increasingly feasible as MR studies use genome-wide data (10).”
Nordestgaard, B. G., Palmer, T., Benn, M., Zacho, J., Tybjærg‐Hansen, A., Smith, G. D., & Timpson, N. J. (2012) · PLoS Medicine · doi:10.1371/journal.pmed.1001212 · Cited by 284
“Indeed, the use of multiple independent genetic instruments for a single risk factor in the undertaking of Mendelian randomisation experiments is recognised as a favourable approach [25].”
BackgroundSelf-citationKappelmann, N., Arloth, J., Georgakis, M. K., Czamara, D., Rost, N., Ligthart, S., Khandaker, G. M., & Binder, E. B. (2020) · JAMA Psychiatry · doi:10.1001/jamapsychiatry.2020.3436 · Cited by 270
Genetically Determined Levels of Circulating Cytokines and Risk of Stroke
Georgakis, M. K., Gill, D., Rannikmäe, K., Traylor, M., Anderson, C. D., Lee, J., Kamatani, Y., Hopewell, J. C., Worrall, B. B., Bernhagen, J., et al. (2019) · Circulation · doi:10.1161/circulationaha.118.035905 · Cited by 248
Saleheen, D., Haycock, P., Zhao, W., Rasheed, A., Taleb, A., Imran, A., Abbas, S., Majeed, F., Akhtar, S., Qamar, N., et al. (2017) · The Lancet Diabetes & Endocrinology · doi:10.1016/s2213-8587(17)30088-8 · Cited by 238
Richardson, T. G., Harrison, S., Hemani, G., & Davey Smith, G. (2019) · eLife · doi:10.7554/elife.43657 · Cited by 198
Ference, B. A., Bhatt, D. L., Catapano, A. L., Packard, C. J., Graham, I. M., Kaptoge, S. K., Ference, T. B., Guo, Q., Laufs, U., Ruff, C. T., et al. (2019) · JAMA · doi:10.1001/jama.2019.14120 · Cited by 228
Holmes, M. V., Lange, L. A., Palmer, T., Lanktree, M. B., North, K. E., Almoguera, B., Buxbaum, S., Chandrupatla, H. R., Elbers, C. C., Guo, Y., et al. (2014) · The American Journal of Human Genetics · doi:10.1016/j.ajhg.2013.12.014 · Cited by 216
Self-citationThe Role of Adiposity in Cardiometabolic Traits: A Mendelian Randomization Analysis
Fall, T., Hägg, S., Mägi, R., Ploner, A., Fischer, K., Horikoshi, M., Sarin, A.-P., Thorleifsson, G., Ladenvall, C., Kals, M., et al. (2013) · PLoS Medicine · doi:10.1371/journal.pmed.1001474 · Cited by 203
“A suggested way to assess pleiotropy in IV studies using multiple genotypes is to compare IV estimates between variants: if they are similar, it is less plausible that LD or pleiotropy is present [42].”
Genetics of height and risk of atrial fibrillation: A Mendelian randomization study
Levin, M. G., Judy, R., Gill, D., Vujković, M., Verma, S. S., Bradford, Y., Ritchie, M. D., Hyman, M. C., Nazarian, S., Rader, D. J., et al. (2020) · PLoS Medicine · doi:10.1371/journal.pmed.1003288 · Cited by 193
“F-statistics were then calculated for each variant using the formula F 1⁄4 R 2�ðN 2Þ 1 R2 (where R 2 represents the variance in exposure explained by the genetic variant, and N represents the number of individuals in the exposure GWAS) to assess the strength of the selected instruments [29].”
MethodKeenan, T. E., Zhao, W., Rasheed, A., Ho, W.-K., Malik, R., Felix, J. F., Young, R., Shah, N., Samuel, M., Sheikh, N., et al. (2016) · Journal of the American College of Cardiology · doi:10.1016/j.jacc.2015.10.086 · Cited by 187
“SNPs found exclusively associated with serum urate levels were used in a genetic score as an instrument for MR analyses (39,40).”
MethodNead, K. T., Sharp, S. J., Thompson, D. J., Painter, J. N., Savage, D. B., Semple, R. K., Barker, A., Perry, J. R. B., Attia, J., Dunning, A. M., et al. (2015) · JNCI Journal of the National Cancer Institute · doi:10.1093/jnci/djv178 · Cited by 189
“While not possible to exclude confounding by unknown confounders, the use of multiple independent variants acting through different pathways decreases the likelihood of confounded instrumental variable associations (9,51).”
BackgroundPower and sample size calculations for Mendelian randomization studies using one genetic instrument
Freeman, G., Cowling, B. J., & Schooling, C. M. (2013) · International Journal of Epidemiology · doi:10.1093/ije/dyt110 · Cited by 184
Thrift, A. P., Shaheen, N. J., Gammon, M. D., Bernstein, L., Reid, B. J., Onstad, L., Risch, H. A., Liu, G., Bird, N. C., Wu, A. H., et al. (2014) · JNCI Journal of the National Cancer Institute · doi:10.1093/jnci/dju252 · Cited by 179
“Using multiple genetic variants as instrumental variables can actually increase statistical power and improve the precision of causal estimates (19).”
BackgroundRichmond, R. C., Davey Smith, G., Ness, A. R., den Hoed, M., McMahon, G., & Timpson, N. J. (2014) · PLoS Medicine · doi:10.1371/journal.pmed.1001618 · Cited by 167
“Of 609,203 SNPs, those with a minor allele frequency of , 1%, with a call rate of ,95%, or not in Hardy–Weinberg equilibrium (p,561027) were removed, leaving 500,527 SNPs that passed quality control.”
BackgroundMethodInfluentialSelf-citationZhou, W., Liu, G., Hung, R. J., Haycock, P. C., Aldrich, M. C., Andrew, A. S., Arnold, S. M., Bickeböller, H., Bojesen, S. E., Brennan, P., et al. (2021) · International Journal of Cancer · doi:10.1002/ijc.33292 · Cited by 172
“We calculated R(2) to estimate the proportion of phenotypic variance explained and F-statistics to evaluate the strength of instruments.(30) The two-sample conditional F-statistics (FTS) 17,31 were also estimated to evaluate the strength of SNP-exposure conditional on other expo-”
MethodSerum Iron Levels and the Risk of Parkinson Disease: A Mendelian Randomization Study
Pichler, I., Del Greco M., F., Gögele, M., Lill, C. M., Bertram, L., Do, C. B., Eriksson, N., Foroud, T., Myers, R. H., PD GWAS Consortium, et al. (2013) · PLoS Medicine · doi:10.1371/journal.pmed.1001462 · Cited by 173
“In a MR study, if all instruments are valid, their MR estimates should differ only as a result of sampling error [10], so that there should be no heterogeneity in the meta-analysis of MR estimates.”
BackgroundMethodInfluentialCirculating inflammatory cytokines and risk of five cancers: a Mendelian randomization analysis
Bouras, E., Karhunen, V., Gill, D., Huang, J. V., Haycock, P., Gunter, M. J., Johansson, M., Brennan, P., Key, T. J., Lewis, S. J., et al. (2022) · BMC Medicine · doi:10.1186/s12916-021-02193-0 · Cited by 178
“we calculated the F-statistic and proportion of variance explained (r(2)) for each genetic variant based on the circulating protein concentrations [29] (Additional”
MethodCommon Methods for Performing Mendelian Randomization
Teumer, A. (2018) · Frontiers in Cardiovascular Medicine · doi:10.3389/fcvm.2018.00051 · Cited by 163
“Using multiple instruments can help to test the violation of the MR assumptions which may occur due to pleiotropy and via SNPs in linkage disequilibrium (but not for a violation due to population stratification) (28), or to conduct sensitivity analyses (25).”
BackgroundInfluentialUse of Genetic Variants Related to Antihypertensive Drugs to Inform on Efficacy and Side Effects
Gill, D., Georgakis, M. K., Koskeridis, F., Jiang, L., Feng, Q., Wei, W., Τheodoratou, E., Elliott, P., Denny, J. C., Malik, R., et al. (2019) · Circulation · doi:10.1161/circulationaha.118.038814 · Cited by 164
Dudbridge, F. (2016) · Genetic Epidemiology · doi:10.1002/gepi.21966 · Cited by 161
“This assumption is increasingly likely to be violated as more variants enter the model [Burgess and Thompson, 2013; Palmer et al., 2012].”
BackgroundAssociation between frailty and depression: A bidirectional Mendelian randomization study
Deng, M., Liu, F., Liang, Y., Wang, K., Nie, J., & Liu, J. (2023) · Science Advances · doi:10.1126/sciadv.adi3902 · Cited by 163
Gill, D., Efstathiadou, A., Cawood, K., Tzoulaki, I., & Dehghan, A. (2019) · International Journal of Epidemiology · doi:10.1093/ije/dyz200 · Cited by 151
“F statistic and R(2) values were estimated for the instrument SNPs of both traits to evaluate their strength in conventional MR and proportion of phenotypic variance explained, respectively (with the specific formulae used detailed in Supplementary Tables 2 and 3, available as Supplementary data at IJE online).(21,22)…”
MethodUrate, Blood Pressure, and Cardiovascular Disease
Gill, D., Cameron, A. C., Burgess, S., Li, X., Doherty, D. J., Karhunen, V., Abdul‐Rahim, A. H., Rowan, M. T., Zuber, V., Tsao, P. S., et al. (2020) · Hypertension · doi:10.1161/hypertensionaha.120.16547 · Cited by 158
Obesity as a causal risk factor for deep venous thrombosis: a M endelian randomization study
Klovaite, J., Benn, M., & Nordestgaard, B. G. (2014) · Journal of Internal Medicine · doi:10.1111/joim.12299 · Cited by 151
Liu, B., Ye, D., Yang, H., Song, J., Sun, X., Mao, Y., & He, Z. (2022) · Frontiers in Immunology · doi:10.3389/fimmu.2022.921546 · Cited by 152
“F statistics were calculated using the following equation: F=R(2)(n-k-1)/k(1-R(2)), in which R(2) represents the variance explained by the IVs (each gut microbiome) and n represents the sample size (25).”
MethodLyngdoh, T., Vuistiner, P., Marques-Vidal, P. M., Rousson, V., Waeber, G., Vollenweider, P., & Bochud, M. (2012) · PLoS ONE · doi:10.1371/journal.pone.0039321 · Cited by 150
“the instrument is unrelated to the confounders) by examining the association between the instruments and the potential confounders (as below) that were measured, as done by others [38,39].”
Methodvan de Vegte, Y. J., Said, M. A., Rienstra, M., van der Harst, P., & Verweij, N. (2020) · Nature Communications · doi:10.1038/s41467-020-15553-w · Cited by 145
Addressing dyslipidemic risk beyond LDL-cholesterol
Tall, A. R., Thomas, D. G., Gonzalez-Cabodevilla, A. G., & Goldberg, I. J. (2022) · Journal of Clinical Investigation · doi:10.1172/jci148559 · Cited by 150
Zhang, G., Bačelis, J., Lengyel, C., Teramo, K., Hallman, M., Helgeland, Ø., Johansson, S., Myhre, R., Sengpiel, V., Njølstad, P. R., et al. (2015) · PLoS Medicine · doi:10.1371/journal.pmed.1001865 · Cited by 148
Statistical methods to detect pleiotropy in human complex traits
Hackinger, S., & Zeggini, E. (2017) · Open Biology · doi:10.1098/rsob.170125 · Cited by 143
Yao, S., Zhang, M., Dong, S., Wang, J.-H., Zhang, K., Guo, J., Guo, Y., & Yang, T. (2022) · Nature Human Behaviour · doi:10.1038/s41562-022-01412-9 · Cited by 144
Adiposity as a cause of cardiovascular disease: a Mendelian randomization study
Hägg, S., Fall, T., Ploner, A., Mägi, R., Fischer, K., Draisma, H. H. M., Kals, M., de Vries, P. S., Dehghan, A., Willems, S. M., et al. (2015) · International Journal of Epidemiology · doi:10.1093/ije/dyv094 · Cited by 142
“In the present study, we utilized a genetic score derived from 32 established BMI-associated loci(17) as an instrument for lifelong BMI in order to more robustly investigate the causal association between BMI, here referred to as adiposity, and cardiovascular traits.(18) Towards this aim, we used a large prospective f…”
MethodHeight and Breast Cancer Risk: Evidence From Prospective Studies and Mendelian Randomization
Zhang, B., Shu, X., Delahanty, R., Zeng, C., Michailidou, K., Bolla, M. K., Wang, Q., Dennis, J., Wen, W., Long, J., et al. (2015) · JNCI Journal of the National Cancer Institute · doi:10.1093/jnci/djv219 · Cited by 143
“Thus, a genetic score summarizing the effects of these height-associated SNPs can serve as an instrumental variable in a Mendelian randomization analysis of adult height and breast cancer risk (39).”
BackgroundThe many weak instruments problem and Mendelian randomization
Davies, N. M., von Hinke Kessler Scholder, S., Farbmacher, H., Burgess, S., Windmeijer, F., & Smith, G. D. (2015) · Statistics in Medicine · doi:10.1002/sim.6358 · Cited by 140
“Whilst there are a number of techniques for using multiple variants, such as meta-analysis and structural mean models [20,21], the aim of this paper is to illustrate the use of CUE and LIML compared with 2SLS and allele scores.”
MethodSelf-citationHigh Density Lipoproteins: Metabolism, Function, and Therapeutic Potential
Jomard, A., & Osto, E. (2020) · Frontiers in Cardiovascular Medicine · doi:10.3389/fcvm.2020.00039 · Cited by 154
“Beyond the CETPi trial results, the fact that HDL-C per se is not causally associated with cardiovascular benefits was supported by Mendelian randomization studies, demonstrating that genetic polymorphisms associated with increased HDL-C had no impact on the risk of myocardial infarction (11, 12).”
ResultApproaches for drawing causal inferences from epidemiological birth cohorts: A review
Richmond, R. C., Al-Amin, A., Smith, G. D., & Relton, C. L. (2014) · Early Human Development · doi:10.1016/j.earlhumdev.2014.08.023 · Cited by 138
Genetic Obesity and the Risk of Atrial Fibrillation
Chatterjee, N. A., Giulianini, F., Geelhoed, B., Lunetta, K. L., Misialek, J. R., Niemeijer, M. N., Rienstra, M., Rose, L. M., Smith, A. V., Arking, D. E., et al. (2016) · Circulation · doi:10.1161/circulationaha.116.024921 · Cited by 136
Plasma urate concentration and risk of coronary heart disease: a Mendelian randomisation analysis.
White, J., Sofat, R., Hemani, G., Shah, T., Engmann, J., Dale, C., Shah, S., Kruger, F. A., Giambartolomei, C., Swerdlow, D. I., et al. (2016) · The Lancet Diabetes & Endocrinology · doi:10.1016/s2213-8587(15)00386-1 · Cited by 132
Self-citationGenetic markers as instrumental variables
von Hinke, S., Smith, G. D., Lawlor, D. A., Propper, C., & Windmeijer, F. (2015) · Journal of Health Economics · doi:10.1016/j.jhealeco.2015.10.007 · Cited by 125
Chen, L., Peters, J. E., Prins, B. P., Persyn, E., Traylor, M., Surendran, P., Karthikeyan, S., Yonova‐Doing, E., Angelantonio, E. D., Roberts, D. J., et al. (2022) · Nature Communications · doi:10.1038/s41467-022-33675-1 · Cited by 134
Plasma HDL cholesterol and risk of myocardial infarction: a mendelian randomisation study
Voight, B. F., Peloso, G. M., Orho-Melander, M., Frikke-Schmidt, R., Barbalic, M., Jensen, M. K., Hindy, G., Hólm, H., Ding, E. L., Johnson, T., et al. (2012) · The Lancet · doi:10.1016/s0140-6736(12)60312-2 · Cited by 148
Allard, C., Desgagné, V., Patenaude, J., Lacroix, M., Guillemette, L., Battista, M., Doyon, M., Ménard, J., Jl, A., Perron, P., et al. (2015) · Epigenetics · doi:10.1080/15592294.2015.1029700 · Cited by 130
“MR approaches are useful to further pinpoint etiologic factors and might help to better target our interventions.(21,43) Future studies should assess whether epigenetic miss-programming at birth could be prevented by intervening during pregnancy and/or by re-modeling epigenetic adaptations with early life intervention…”
BackgroundAdult height, coronary heart disease and stroke: a multi-locus Mendelian randomization meta-analysis
Nüesch, E., Dale, C. E., Palmer, T., White, J., Keating, B. J., van Iperen, E. P. A., Goel, A., Padmanabhan, S., Asselbergs, F. W., EPIC-Netherland Investigators, et al. (2015) · International Journal of Epidemiology · doi:10.1093/ije/dyv074 · Cited by 123
“For the instrumental variable (IV) analysis, we used the logistic control function estimator to estimate studyspecific odds ratios (ORs) between height and clinical events.(18,19) This involved a two-stage process: we first conducted within each study a linear regression analysis with adult height as the dependent var…”
Self-citationWang, X., Fang, X., Zheng, W., Zhou, J., Song, Z., Xu, M., Min, J., & Wang, F. (2021) · The Journal of Clinical Endocrinology & Metabolism · doi:10.1210/clinem/dgab454 · Cited by 126
“The first-stage regression F statistic was used to assess the strength of the instruments and was calculated using the following equation: F = (R2/k)/([1− R2 ]/[ n− k− 1]), where R(2) is the proportion of the circulating trace element status variability accounted for by the SNV, k is the number of instruments used in…”
BackgroundMethodA Mendelian randomization study of the effect of type-2 diabetes on coronary heart disease
Ahmad, O. S., Morris, J. A., Mujammami, M. H., Forgetta, V., Leong, A., Li, R., Turgeon, M., Greenwood, C. M. T., Thanassoulis, G., Meigs, J. B., et al. (2015) · Nature Communications · doi:10.1038/ncomms8060 · Cited by 128
Circulating Total Bilirubin and Risk of Incident Cardiovascular Disease in the General Population
Kunutsor, S. K., Bakker, S. J. L., Gansevoort, R. T., Chowdhury, R., & Dullaart, R. P. F. (2015) · Arteriosclerosis Thrombosis and Vascular Biology · doi:10.1161/atvbaha.114.304929 · Cited by 124
Zhou, J., Mi, J., Peng, Y., Han, H., & Liu, Z. (2021) · Frontiers in Endocrinology · doi:10.3389/fendo.2021.740200 · Cited by 127
“Mendelian randomization (MR) is a method that uses singlenucleotide polymorphism (SNP) as instrumental variables for estimating the causal effect of an exposure on an outcome (22, 23).”
MethodMadrid, A. S., Rode, L., Nordestgaard, B. G., & Bojesen, S. E. (2016) · Clinical Chemistry · doi:10.1373/clinchem.2016.258566 · Cited by 120
Poverty and Child Development: A Longitudinal Study of the Impact of the Earned Income Tax Credit
Hamad, R., & Rehkopf, D. H. (2016) · American Journal of Epidemiology · doi:10.1093/aje/kwv317 · Cited by 118
“Because the validity of multiple imputation in IV analyses has not been established (36), we conduct these regressions using unimputed data.”
MethodTargeting ATP-Citrate Lyase in Hyperlipidemia and Metabolic Disorders
Pinkosky, S. L., Groot, P. H. E., Lalwani, N. D., & Steinberg, G. R. (2017) · Trends in Molecular Medicine · doi:10.1016/j.molmed.2017.09.001 · Cited by 118
Lawlor, D. A. (2013) · International Journal of Epidemiology · doi:10.1093/ije/dys209 · Cited by 114
Xiang, M., Wang, Y., Gao, Z., Wang, J., Chen, Q., Sun, Z., Liang, J., & Xu, J. (2023) · Frontiers in Immunology · doi:10.3389/fimmu.2022.985729 · Cited by 113
“Third, the proportion of variance in exposure was calculated using the R(2) value of each SNP, and the instrument strength was estimated using the F-statistic to avoid weak instrument bias (13, 14).”
MethodIron Status and Risk of Stroke: A Mendelian Randomization Study
Gill, D., Monori, G., Tzoulaki, I., & Dehghan, A. (2018) · Stroke · doi:10.1161/strokeaha.118.022701 · Cited by 110
Education leads to a more physically active lifestyle: Evidence based on Mendelian randomization
Kari, J. T., Viinikainen, J., Böckerman, P., Tammelin, T., Pitkänen, N., Lehtimäki, T. J., Pahkala, K., Hirvensalo, M. H., Raitakari, O. T., & Pehkonen, J. (2020) · Scandinavian Journal of Medicine and Science in Sports · doi:10.1111/sms.13653 · Cited by 120
Malik, R., Georgakis, M. K., Vujković, M., Damrauer, S. M., Elliott, P., Karhunen, V., Giontella, A., Fava, C., Hellwege, J. N., Shuey, M. M., et al. (2021) · Hypertension · doi:10.1161/hypertensionaha.120.16534 · Cited by 112
Poverty, Pregnancy, and Birth Outcomes: A Study of the Earned Income Tax Credit
Hamad, R., & Rehkopf, D. H. (2015) · Paediatric and Perinatal Epidemiology · doi:10.1111/ppe.12211 · Cited by 104
Davies, N. M., Gaunt, T. R., Lewis, S. J., Holly, J. M. P., Donovan, J., Hamdy, F. C., Kemp, J. P., Eeles, R. A., Easton, D. F., Kote‐Jarai, Z., et al. (2015) · Cancer Causes & Control · doi:10.1007/s10552-015-0654-9 · Cited by 106
“The genetic risk score is therefore a weighted sum of the estimated number of risk alleles across several genotypes, which can improve the precision of the results compared to an unweighted score [21].”
BackgroundMethodAge at menarche and adult body mass index: a Mendelian randomization study
Gill, D., Brewer, C. F., Fabiola Del Greco, M., Sivakumaran, P., Bowden, J., Sheehan, N. A., & Minelli, C. (2018) · International Journal of Obesity · doi:10.1038/s41366-018-0048-7 · Cited by 105
“They all exceed the recommended threshold of 10 for MR analyses and provide assurance that the results are probably not affected by weak instrument bias [22, 23].”
BackgroundGenetically determined blood pressure, antihypertensive drug classes, and risk of stroke subtypes
Georgakis, M. K., Gill, D., Webb, A. J. S., Εvangelou, Ε., Elliott, P., Sudlow, C. L. M., Dehghan, A., Malik, R., Tzoulaki, I., & Dichgans, M. (2020) · Neurology · doi:10.1212/wnl.0000000000009814 · Cited by 99
Millard, L. A. C., Davies, N. M., Timpson, N. J., Tilling, K. M., Flach, P. A., & Smith, G. D. (2015) · Scientific Reports · doi:10.1038/srep16645 · Cited by 104
Mendelian Randomization using Public Data from Genetic Consortia
Thompson, J. R., Minelli, C., & Fabiola Del Greco, M. (2016) · The International Journal of Biostatistics · doi:10.1515/ijb-2015-0074 · Cited by 97
Association of Hypertensive Disorders of Pregnancy With Future Cardiovascular Disease
Rayes, B., Ardissino, M., Slob, E. A. W., Patel, K. H. K., Girling, J., & Ng, F. S. (2023) · JAMA Network Open · doi:10.1001/jamanetworkopen.2023.0034 · Cited by 104
Gill, D., Del Greco M., F., Walker, A. P., Srai, S. K. S., Laffan, M. A., & Minelli, C. (2017) · Arteriosclerosis Thrombosis and Vascular Biology · doi:10.1161/atvbaha.117.309757 · Cited by 95
Mendelian Randomization Study of Body Mass Index and Colorectal Cancer Risk
Thrift, A. P., Gong, J., Peters, U., Chang-Claude, J. C., Rudolph, A., Slattery, M. L., Chan, A. T., Locke, A. E., Kahali, B., Justice, A. E., et al. (2015) · Cancer Epidemiology Biomarkers & Prevention · doi:10.1158/1055-9965.epi-14-1309 · Cited by 97
“We constructed a weighted genetic risk score from 77 SNPs associated with higher BMI in an externally conducted genome-wide association study to maximize power (8) and provided evidence that the weighted genetic risk score (the IV) is associated with BMI in our study (a sufficiently strong instrument with F-statistics…”
MethodGeorgakis, M. K., Malik, R., Anderson, C. D., Parhofer, K. G., Hopewell, J. C., & Dichgans, M. (2019) · Brain · doi:10.1093/brain/awz413 · Cited by 91
“F was 410 for all selected instruments, indicating a low probability for weak instrument bias (Palmer et al., 2012).”
BackgroundEvaluation of Genetic Markers as Instruments for Mendelian Randomization Studies on Vitamin D
Berry, D. J., Vimaleswaran, K. S., Whittaker, J. C., Hingorani, A. D., & Hyppönen, E. (2012) · PLoS ONE · doi:10.1371/journal.pone.0037465 · Cited by 88
“In the MR analysis as modelled by IV regression using a twostage-least-squares estimator, the association can be biased when both the variance explained by the instruments (in the intermediate phenotype) and the sample size are small [33,34].”
Ansari, M., McKeigue, P., Skerka, C., Hayward, C., Rudan, I., Vitart, V., Polašek, O., Armbrecht, A.-M., Yates, J. R. W., Vatavuk, Z., et al. (2013) · Human Molecular Genetics · doi:10.1093/hmg/ddt336 · Cited by 90
Painter, J. N., O’Mara, T. A., Marquart, L., Webb, P. M., Attia, J., Medland, S. E., Cheng, T. H. T., Dennis, J., Holliday, E. G., McEvoy, M., et al. (2016) · Cancer Epidemiology Biomarkers & Prevention · doi:10.1158/1055-9965.epi-16-0147 · Cited by 87
Berstein, F. M., McCartney, D. L., Lu, A. T., Tsilidis, K. K., Bouras, E., Haycock, P., Burrows, K., Phipps, A. I., Buchanan, D. D., Cheng, I. C., et al. (2022) · eLife · doi:10.7554/elife.75374 · Cited by 89
“R 2 ) (where MAF = effect allele frequency, β = effect estimate of the SNP in the exposure GWAS, SE = standard error, N = sample size) ( Palmer et al., 2012 ).”
Hung, C., Rivera, M., Craddock, N. J., Owen, M. J., Gill, M., Korszun, A., Maier, W., Mors, O. N., Preisig, M., Rice, J. P., et al. (2014) · The British Journal of Psychiatry · doi:10.1192/bjp.bp.113.130419 · Cited by 84
Winsløw, U., Rode, L., & Nordestgaard, B. G. (2015) · International Journal of Epidemiology · doi:10.1093/ije/dyu276 · Cited by 83
Diabetes and Risk of Arterial Stiffness: A Mendelian Randomization Analysis
Xu, M., Huang, Y. F., Xie, L., Peng, K., Ding, L., Lin, L., Po, W., Hao, M., Chen, Y., Sun, Y., et al. (2016) · Diabetes · doi:10.2337/db15-1533 · Cited by 85
“SBP, mmHg 136 (20) 137 (20) 137 (20) 137 (21) 0.”
MethodExploring the Causal Pathway From Telomere Length to Coronary Heart Disease
Zhan, Y., Karlsson, I., Karlsson, R., Tillander, A., Reynolds, C. A., Pedersen, N. L., & Hägg, S. (2017) · Circulation Research · doi:10.1161/circresaha.116.310517 · Cited by 83
“5×10) and satisfied this assumption.(34) Second, the random assortment of alleles at birth should rule out confounding factors in the association between TL, fasting insulin, and CHD.”
BackgroundCausal Associations Between Serum Bilirubin Levels and Decreased Stroke Risk
Choi, Y., Lee, S. J., Spiller, W., Jung, K. J., Lee, J., Kimm, H., Back, J. H., Lee, S., & Jee, S. H. (2019) · Arteriosclerosis Thrombosis and Vascular Biology · doi:10.1161/atvbaha.119.313055 · Cited by 84
Two‐Sample Multivariable Mendelian Randomization Analysis Using R
Rasooly, D., & Peloso, G. M. (2021) · Current Protocols · doi:10.1002/cpz1.335 · Cited by 81
“However, there are also a number of scenarios in which the IV assumptions may be violated, and therefore a genetic variant may not serve as a valid IV for a Mendelian randomization analysis (Palmer et al., 2012; Smith & Ebrahim, 2004; VanderWeele et al., 2014).”
BackgroundAssessing the Causal Role of Body Mass Index on Cardiovascular Health in Young Adults
Wade, K. H., Chiesa, S. T., Hughes, A. D., Chaturvedi, N., Charakida, M., Rapala, A., Muthurangu, V., Khan, T. A., Finer, N., Sattar, N. A., et al. (2018) · Circulation · doi:10.1161/circulationaha.117.033278 · Cited by 86
“To generate the GRS, the dosage of each BMI-increasing allele at each 327 locus in ALSPAC was weighted by the external effect size of the variant in the GWAS 328 results[31, 32].”
MethodThe Effect of Weight on Labor Market Outcomes: An Application of Genetic Instrumental Variables
Böckerman, P., Cawley, J., Viinikainen, J., Lehtimäki, T. J., Rovio, S., Seppälä, I., Pehkonen, J., & Raitakari, O. T. (2016) · Health Economics · doi:10.1002/hec.3828 · Cited by 89
“(11)Using simulations comparing different methods, Palmer et al. (2012, p. 239) provide evidence that supports the use of genetic scores over indicator variables for individual SNPs. (12)Speliotes et al. (2010) reports that the SNP with the greatest explanatory power for BMI is FTO (which explains 0.”
MethodPregnancy diet and associated outcomes in the Avon Longitudinal Study of Parents and Children
Emmett, P. M., Jones, L. R., & Golding, J. (2015) · Nutrition Reviews · doi:10.1093/nutrit/nuv053 · Cited by 86
Gill, D., Brewer, C. F., Monori, G., Trégouët, D., Franceschini, N., Giambartolomei, C., Tzoulaki, I., & Dehghan, A. (2019) · Journal of the American Heart Association · doi:10.1161/jaha.119.012994 · Cited by 78
Minică, C. C., Dolan, C. V., Boomsma, D. I., de Geus, E., & Neale, M. C. (2018) · Behavior Genetics · doi:10.1007/s10519-018-9904-4 · Cited by 80
“Combining the weak genetic effects into a polygenic risk score (PGS) is a possible route to increase the strength of the genetic instrument (Burgess and Thompson 2013, 2015; Palmer et al. 2012; Pierce et al. 2010).”
BackgroundRichmond, R. C., Timpson, N. J., Felix, J. F., Palmer, T., Gaillard, R., McMahon, G., Smith, G. D., Jaddoe, V. W. V., & Lawlor, D. A. (2017) · PLoS Medicine · doi:10.1371/journal.pmed.1002221 · Cited by 83
Self-citationLuo, Q., Hu, Y., Chen, X., Luo, Y. K., Chen, J., & Wang, H. (2022) · Frontiers in Nutrition · doi:10.3389/fnut.2022.899746 · Cited by 80
“Last, F statistic was calculated for each SNP to test the weak IV bias in this study (23).”
Method
Metadata
- Authors
- Palmer, T. M., Lawlor, D. A., Harbord, R. M., Sheehan, N. A., Tobias, J. H., Timpson, N. J., Smith, G. D., & Sterne, J. A.
- Affiliations
- University of Bristol (GB)
- University of Leicester (GB)
- School of Clinical Sciences, University of Bristol, Bristol, UK
- Corresponding author
- Palmer, Tom M
- ORCID
- Venue
- Statistical Methods in Medical Research
- Publisher
- SAGE Publications
- Published
- 2011-01-07
- Volume
- 21
- Issue
- 3
- Pages
- 223-242
- ISSN
- 0962-2802 (ISSN-L)
- 1477-0334
- PMC
- PMC3917707
- OpenAlex
- W2151096860
- Cited by
- 1,289
- References
- 76
- Citations by year
- 2026: 92 · 2025: 240 · 2024: 394 · 2023: 164 · 2022: 83 · 2021: 67 · 2020: 44 · 2019: 33 · 2018: 22 · 2017: 20 · 2016: 27 · 2015: 44 · 2014: 20 · 2013: 19 · 2012: 14
- FWCI
- 11.61
- Type
- journal article
- Language
- en
- Open access
- green
- www.ncbi.nlm.nih.gov
- Locations
- Statistical Methods in Medical Research (publishedVersion)
- Europe PMC (PubMed Central) (publishedVersion, cc-by)
- PubMed Central (publishedVersion, cc-by)
- PubMed (publishedVersion)
- Adelaide Research & Scholarship (AR&S) (University of Adelaide) (submittedVersion)
- Lancaster EPrints (Lancaster University) (submittedVersion)
- Figshare (submittedVersion, cc-by)
- Leicester Research Archive (University of Leicester) (submittedVersion, cc-by)
- Bristol Research (University of Bristol) (submittedVersion, cc-by)
- Funders
- Wellcome Trust (G0600705, 092731)
- University of Bristol (G0600705)
- Medical Research Council (G0600705)
- Economic and Social Research Council (ES/E00234X/1)
- Topics
- Life Sciences › Biochemistry, Genetics and Molecular Biology › Genetics › Genetic Associations and Epidemiology
- Physical Sciences › Mathematics › Statistics and Probability › Advanced Causal Inference Techniques
- Life Sciences › Biochemistry, Genetics and Molecular Biology › Genetics › Genetics and Physical Performance
- Keywords
- Mendelian randomization, modifiable risk factors, weak instruments, finite-sample bias, fat mass, bone mineral density, children, causal effect estimation, continuous outcomes
- MeSH terms
- Female, Genotype, Humans, Male, Risk Factors, Genetic Variation, Mendelian Randomization Analysis
About these checks
Registry, retraction, Cites and statistics results are computed, not judged, with one exception: a printed reference that no index lists is read once by a model before it counts as a citation error. Claims are extracted by a model and kept only when their quote appears verbatim in the text; each cited source is then checked, with a model’s help, for whether it says what the claim relies on. Those verdicts can be wrong — read the claim’s quote and the cited source before relying on one.
Statistics and arithmetic are recomputed, not judged.
Confidence bands are shown only for fields calibrated on our annotated test set. None is calibrated yet, so no band is shown.
What counts as a claim ›How we measure confidence ›How we check this ›
Are you an author, or do you see a problem with this page? Request a review
