

The DOI matches its Crossref record; 9 of the 9 references it cites were found in a registry or an index.
B-cell tumor development in Tet2-deficient mice
Abstract
Key Points: Tet2 is a tumor suppressor in B cells. Loss of Tet2 in B cells leads to age-dependent transformation that requires AID.
Overview
The claims and statistics of this paper haven’t been checked yet.
Run the check — free, no account needed. It reads the open-access text and checks the sources it cites.
Integrity signals
Registry
Cites
Statistics
Figures
Verification
Claims the paper makes
The claims and statistics of this paper haven’t been checked yet.
Run the check — free, no account needed. It reads the open-access text and checks the sources it cites.
Claims other papers make about this one
Each is checked against this paper’s own text: does it say what the citing paper says it does?
In the citing paper
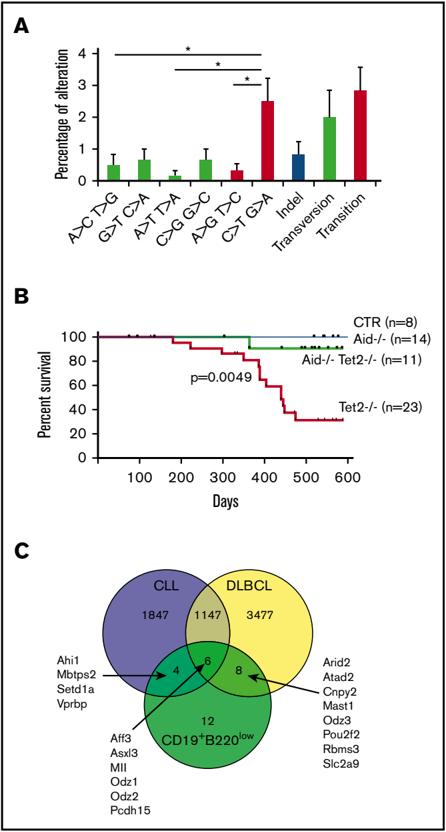
“Interestingly, reduced accumulation of the C to T mutations by inactivation of AID blocked development of B-cell malignancies in aging TET2-deficient mice (Mouly et al., 2018), implying that AID might be a therapeutic targeting candidate for lymphoma, including AITL.”
From Mutation analysis links angioimmunoblastic T-cell lymphoma to clonal hematopoiesis and smoking (2021) · cites this paper as Mouly et al., 2018
Self-check
Percentages, sums and reported differences re-computed from the paper’s own numbers.
The self-check needs the paper’s full text.
Citations
Cites
Mutation in TET2 in Myeloid Cancers
Delhommeau, F., Dupont, S., Valle, V. D., James, C., Trannoy, S., Massé, A., Kosmider, O., Le Couedic, J.-P., Robert, F., Alberdi, A., et al. (2009) · New England Journal of Medicine · doi:10.1056/nejmoa0810069 · Cited by 1,776
Self-citationThe origin and evolution of mutations in acute myeloid leukemia
Welch, J. S., Ley, T. J., Link, D. C., Miller, C. A., Larson, D. E., Koboldt, D. C., Wartman, L. D., Lamprecht, T. L., Liu, F., Xia, J., et al. (2012) · Cell · doi:10.1016/j.cell.2012.06.023 · Cited by 1,575
Tet2 loss leads to increased hematopoietic stem cell self-renewal and myeloid transformation
Moran-Crusio, K., Reavie, L., Shih, A., Abdel-Wahab, O., Ndiaye-Lobry, D., Lobry, C., Figueroa, M. E., Vasanthakumar, A., Patel, J., Zhao, X., et al. (2011) · Cancer Cell · doi:10.1016/j.ccr.2011.06.001 · Cited by 1,339
Genetic and functional drivers of diffuse large B cell lymphoma
Reddy, A., Zhang, J., Davis, N. S., Moffitt, A. B., Love, C. L., Waldrop, A., Leppa, S., Pasanen, A., Meriranta, L., Karjalainen-Lindsberg, M.-L., et al. (2017) · Cell · doi:10.1016/j.cell.2017.09.027 · Cited by 1,104
Human bone marrow hematopoietic stem cells are increased in frequency and myeloid-biased with age
Pang, W. W., Price, E. A., Sahoo, D., Beerman, I., Maloney, W. J., Rossi, D. J., Schrier, S. L., & Weissman, I. L. (2011) · Proceedings of the National Academy of Sciences · doi:10.1073/pnas.1116110108 · Cited by 991
Cdc42 activity regulates hematopoietic stem cell aging and rejuvenation
Florian, M. C., Dörr, K., Niebel, A., Daria, D., Schrezenmeier, H., Rojewski, M., Filippi, M.-D., Hasenberg, A., Gunzer, M., Scharffetter-Kochanek, K., et al. (2012) · Cell Stem Cell · doi:10.1016/j.stem.2012.04.007 · Cited by 564
Lio, C.-W., Zhang, J., González-Avalos, E., Hogan, P. G., Chang, X., & Rao, A. (2016) · eLife · doi:10.7554/elife.18290 · Cited by 170
Tet2 loss leads to hypermutagenicity in haematopoietic stem/progenitor cells
Pan, F., Wingo, T. S., Zhao, Z., Gao, R., Makishima, H., Qu, G., Lin, L., Yu, M., Ortega, J. R., Wang, J., et al. (2017) · Nature Communications · doi:10.1038/ncomms15102 · Cited by 117
Aging of the microenvironment influences clonality in hematopoiesis
Vas, V., Senger, K., Dörr, K., Niebel, A., & Geiger, H. (2012) · PLoS ONE · doi:10.1371/journal.pone.0042080 · Cited by 83
Research works printed but not linked: 38
- Muller-Sieburg, 2012, Stem cell heterogeneity: implications for aging and regenerative medicine, Blood, 119, 3900, 10.1182/blood-2011-12-376749 · DOI
- Steensma, 2015, Clonal hematopoiesis of indeterminate potential and its distinction from myelodysplastic syndromes, Blood, 126, 9, 10.1182/blood-2015-03-631747 · DOI · Paper page
- Langemeijer, 2009, Acquired mutations in TET2 are common in myelodysplastic syndromes, Nat Genet, 41, 838, 10.1038/ng.391 · DOI · Paper page
- Quivoron, 2011, TET2 inactivation results in pleiotropic hematopoietic abnormalities in mouse and is a recurrent event during human lymphomagenesis, Cancer Cell, 20, 25, 10.1016/j.ccr.2011.06.003 · DOI · Paper page
- Asmar, 2013, Genome-wide profiling identifies a DNA methylation signature that associates with TET2 mutations in diffuse large B-cell lymphoma, Haematologica, 98, 1912, 10.3324/haematol.2013.088740 · DOI
- Cimmino, 2015, TET1 is a tumor suppressor of hematopoietic malignancy, Nat Immunol, 16, 653, 10.1038/ni.3148 · DOI
- Haney, 2016, Loss of Dnmt3a induces CLL and PTCL with distinct methylomes and transcriptomes in mice, Sci Rep, 6, 34222, 10.1038/srep34222 · DOI
- Haney, 2016, Promoter hypomethylation and expression is conserved in mouse chronic lymphocytic leukemia induced by decreased or inactivated Dnmt3a, Cell Reports, 15, 1190, 10.1016/j.celrep.2016.04.004 · DOI
- Roos-Weil, 2016, Chronic lymphocytic leukemia: time to go past genomics?, Am J Hematol, 91, 518, 10.1002/ajh.24301 · DOI
- Chandra, 2015, AID targeting: old mysteries and new challenges, Trends Immunol, 36, 527, 10.1016/j.it.2015.07.003 · DOI
- Rickert, 1997, B lymphocyte-specific, Cre-mediated mutagenesis in mice, Nucleic Acids Res, 25, 1317, 10.1093/nar/25.6.1317 · DOI
- Muramatsu, 2000, Class switch recombination and hypermutation require activation-induced cytidine deaminase (AID), a potential RNA editing enzyme, Cell, 102, 553, 10.1016/S0092-8674(00)00078-7 · DOI
- Walter, 2010, Expansion of immunoglobulin-secreting cells and defects in B cell tolerance in Rag-dependent immunodeficiency, J Exp Med, 207, 1541, 10.1084/jem.20091927 · DOI
- Ye, 2013, IgBLAST: an immunoglobulin variable domain sequence analysis tool, Nucleic Acids Res, 41, W34, 10.1093/nar/gkt382 · DOI
- Brochet, 2008, IMGT/V-QUEST: the highly customized and integrated system for IG and TR standardized V-J and V-D-J sequence analysis, Nucleic Acids Res, 36, W503, 10.1093/nar/gkn316 · DOI
- Giudicelli, 2011, IMGT/V-QUEST: IMGT standardized analysis of the immunoglobulin (IG) and T cell receptor (TR) nucleotide sequences, Cold Spring Harb Protoc, 2011, 695
- Lefranc, 2009, IMGT, the international ImMunoGeneTics information system, Nucleic Acids Res, 37, D1006, 10.1093/nar/gkn838 · DOI
- Damm, 2014, Acquired initiating mutations in early hematopoietic cells of CLL patients, Cancer Discov, 4, 1088, 10.1158/2159-8290.CD-14-0104 · DOI
- Stamatopoulos, 2007, Over 20% of patients with chronic lymphocytic leukemia carry stereotyped receptors: pathogenetic implications and clinical correlations, Blood, 109, 259, 10.1182/blood-2006-03-012948 · DOI
- Yan, 2006, B cell receptors in TCL1 transgenic mice resemble those of aggressive, treatment-resistant human chronic lymphocytic leukemia, Proc Natl Acad Sci USA, 103, 11713, 10.1073/pnas.0604564103 · DOI · Paper page
- Hardy, 1991, Resolution and characterization of pro-B and pre-pro-B cell stages in normal mouse bone marrow, J Exp Med, 173, 1213, 10.1084/jem.173.5.1213 · DOI
- Puente, 2011, Whole-genome sequencing identifies recurrent mutations in chronic lymphocytic leukaemia, Nature, 475, 101, 10.1038/nature10113 · DOI
- Zhang, 2013, Genetic heterogeneity of diffuse large B-cell lymphoma, Proc Natl Acad Sci USA, 110, 1398, 10.1073/pnas.1205299110 · DOI
- Pettersen, 2015, AID expression in B-cell lymphomas causes accumulation of genomic uracil and a distinct AID mutational signature, DNA Repair (Amst), 25, 60, 10.1016/j.dnarep.2014.11.006 · DOI
- Quesada, 2011, Exome sequencing identifies recurrent mutations of the splicing factor SF3B1 gene in chronic lymphocytic leukemia, Nat Genet, 44, 47, 10.1038/ng.1032 · DOI
- Schuh, 2012, Monitoring chronic lymphocytic leukemia progression by whole genome sequencing reveals heterogeneous clonal evolution patterns, Blood, 120, 4191, 10.1182/blood-2012-05-433540 · DOI
- Wang, 2011, SF3B1 and other novel cancer genes in chronic lymphocytic leukemia, N Engl J Med, 365, 2497, 10.1056/NEJMoa1109016 · DOI
- Lohr, 2012, Discovery and prioritization of somatic mutations in diffuse large B-cell lymphoma (DLBCL) by whole-exome sequencing, Proc Natl Acad Sci USA, 109, 3879, 10.1073/pnas.1121343109 · DOI
- Morin, 2013, Mutational and structural analysis of diffuse large B-cell lymphoma using whole-genome sequencing, Blood, 122, 1256, 10.1182/blood-2013-02-483727 · DOI
- Pasqualucci, 2011, Analysis of the coding genome of diffuse large B-cell lymphoma, Nat Genet, 43, 830, 10.1038/ng.892 · DOI
- Pekarsky, 2015, The long journey of TCL1 transgenic mice: lessons learned in the last 15 years, Gene Expr, 16, 129, 10.3727/105221615X14181438356256 · DOI
- Bichi, 2002, Human chronic lymphocytic leukemia modeled in mouse by targeted TCL1 expression, Proc Natl Acad Sci USA, 99, 6955, 10.1073/pnas.102181599 · DOI · Paper page
- Benson, 2014, Modeling the clinical phenotype of BTK inhibition in the mature murine immune system, J Immunol, 193, 185, 10.4049/jimmunol.1302570 · DOI
- Casola, 2004, B cell receptor signal strength determines B cell fate, Nat Immunol, 5, 317, 10.1038/ni1036 · DOI
- Jeong, 2014, Large conserved domains of low DNA methylation maintained by Dnmt3a, Nat Genet, 46, 17, 10.1038/ng.2836 · DOI · Paper page
- Ko, 2015, TET proteins and 5-methylcytosine oxidation in hematological cancers, Immunol Rev, 263, 6, 10.1111/imr.12239 · DOI
- Wilson, 2015, Targeting B cell receptor signaling with ibrutinib in diffuse large B cell lymphoma, Nat Med, 21, 922, 10.1038/nm.3884 · DOI
- Soucie, 2012, In aggressive forms of mastocytosis, TET2 loss cooperates with c-KITD816V to transform mast cells, Blood, 120, 4846, 10.1182/blood-2011-12-397588 · DOI
Cited by
Mutation analysis links angioimmunoblastic T-cell lymphoma to clonal hematopoiesis and smoking
Cheng, S., Zhang, W., Inghirami, G., & Tam, W. (2021) · eLife · doi:10.7554/elife.66395 · Cited by 37
Metadata
- Authors
- Mouly, E., Ghamlouch, H., Della-Valle, V., Scourzic, L., Quivoron, C., Roos-Weil, D., Pawlikowska, P., Saada, V., Diop, M. K., Lopez, C. K., Fontenay, M., Dessen, P., Touw, I. P., Mercher, T., Aoufouchi, S., & Bernard, O. A.
- Affiliations
- INSERM, Unité Mixte de Recherche (UMR)1170, Institut Gustave Roussy, Villejuif, France;
- Institut Gustave Roussy, Villejuif, France;
- Département Développement, Reproduction, Cancer, Institut Cochin, INSERM U1016, CNRS UMR8104, Université Paris Descartes, Paris, France; and
- Department of Hematology, Erasmus Cancer Institute, Erasmus University Medical Center, Rotterdam, The Netherlands
- ORCID
- Ghamlouch, Hussein
- Venue
- Blood Advances
- Publisher
- American Society of Hematology
- Published
- 2018-03-26
- Volume
- 2
- Issue
- 6
- Pages
- 703-714
- ISSN
- 2473-9529
- 2473-9537
- Cited by
- 58
- References
- 9
- Language
- en
About these checks
Registry, retraction, Cites and statistics results are computed, not judged, with one exception: a printed reference that no index lists is read once by a model before it counts as a citation error. Claims are extracted by a model and kept only when their quote appears verbatim in the text; each cited source is then checked, with a model’s help, for whether it says what the claim relies on. Those verdicts can be wrong — read the claim’s quote and the cited source before relying on one.
Statistics and arithmetic are recomputed, not judged.
Confidence bands are shown only for fields calibrated on our annotated test set. None is calibrated yet, so no band is shown.
What counts as a claim ›How we measure confidence ›How we check this ›
Are you an author, or do you see a problem with this page? Request a review
