

The DOI matches its Crossref record; 37 of the 37 references it cites were found in a registry or an index.
GC-Content Normalization for RNA-Seq Data
Open accessAbstract
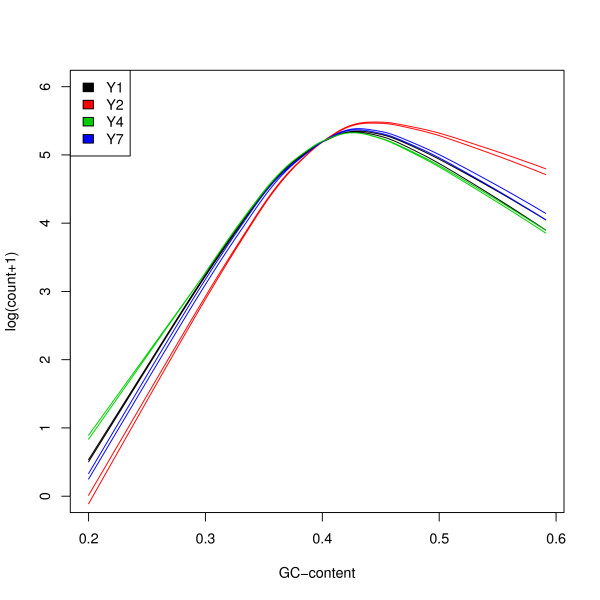
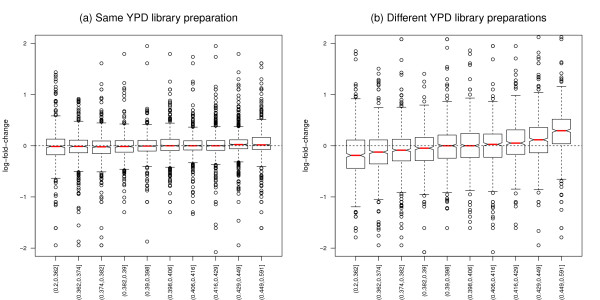
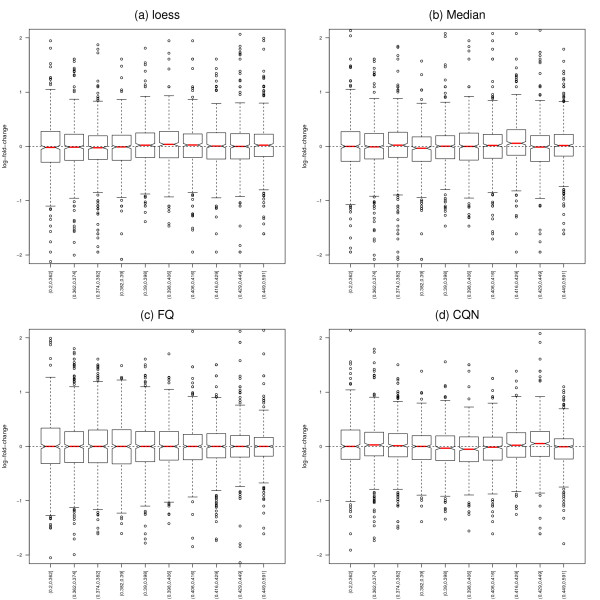
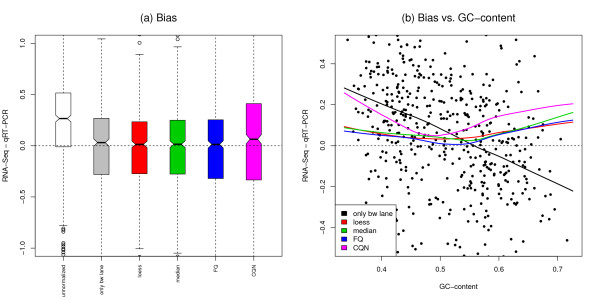
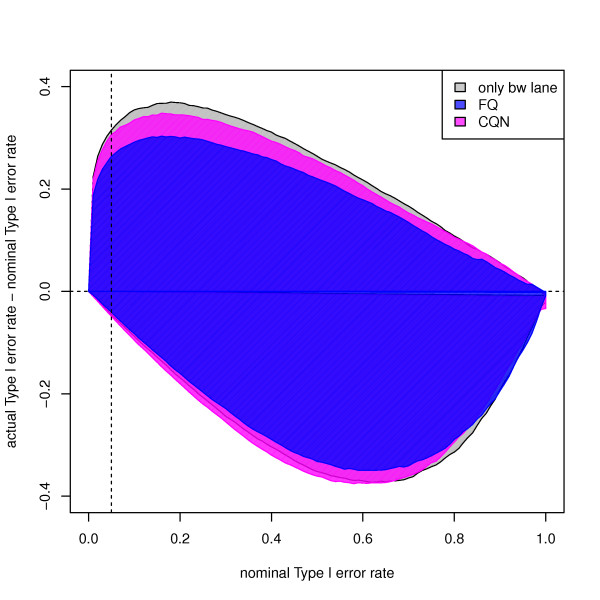
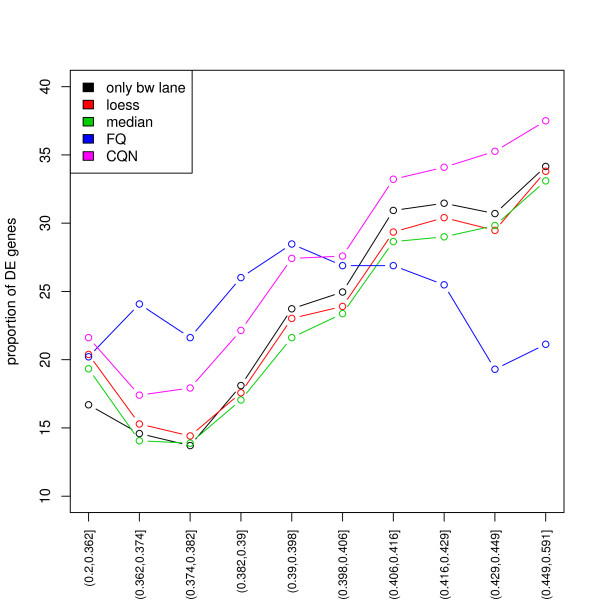
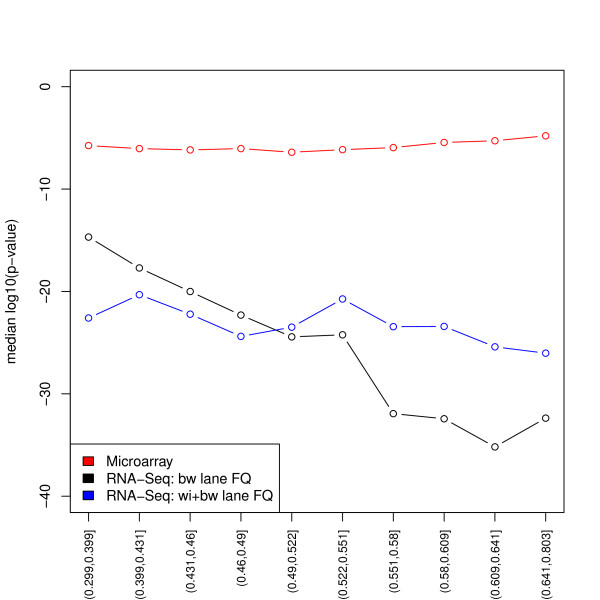
Background: Transcriptome sequencing (RNA-Seq) has become the assay of choice for high-throughput studies of gene expression. However, as is the case with microarrays, major technology-related artifacts and biases affect the resulting expression measures. Normalization is therefore essential to ensure accurate inference of expression levels and subsequent analyses thereof. Results: We focus on biases related to GC-content and demonstrate the existence of strong sample-specific GC-content effects on RNA-Seq read counts, which can substantially bias differential expression analysis. We propose three simple within-lane gene-level GC-content normalization approaches and assess their performance on two different RNA-Seq datasets, involving different species and experimental designs. Our methods are compared to state-of-the-art normalization procedures in terms of bias and mean squared error for expression fold-change estimation and in terms of Type I error and p-value distributions for tests of differential expression. The exploratory data analysis and normalization methods proposed in this article are implemented in the open-source Bioconductor R package EDASeq. Conclusions: Our within-lane normalization procedures, followed by between-lane normalization, reduce GC-content bias and lead to more accurate estimates of expression fold-changes and tests of differential expression. Such results are crucial for the biological interpretation of RNA-Seq experiments, where downstream analyses can be sensitive to the supplied lists of genes.
Overview
The claims and statistics of this paper haven’t been checked yet.
Run the check — free, no account needed. It reads the open-access text and checks the sources it cites.
Integrity signals
Registry
Cites
Statistics
Figures
Verification
Claims the paper makes
The claims and statistics of this paper haven’t been checked yet.
Run the check — free, no account needed. It reads the open-access text and checks the sources it cites.
Claims other papers make about this one
Each is checked against this paper’s own text: does it say what the citing paper says it does?
The source backs part of the claim, not all of it — or backs it for a different population, condition or comparison.
In the citing paper
“commonly used methods fornormalization (cqn, EDASeq, RUV2, sva, PEER) varied in their ability to remove these systematic biases, depending on sample complexity and initial data quality.”
From Detecting and correcting systematic variation in large-scale RNA sequencing data (2014) · cites this paper as [15]
Experimental — accuracy not yet measuredIn the citing paper
“These effects can be minimized by appropriate experimental design [51] or, alternatively, removed by batch-correction methods such as COMBAT [52] or ARSyN [20, 53].”
From A survey of best practices for RNA-seq data analysis (2016) · cites this paper as [20]
In the citing paper
“Filtering out genes that are expressed at low levels prior to differential expression analysis reduces the severity of the correction and may improve the power of detection [20].”
From A survey of best practices for RNA-seq data analysis (2016) · cites this paper as [20]
In the citing paper
“NOISeq and NOISeqBIO (the adaptation of NOISeq for biological replication) are more efficient in avoiding false positive calls at the cost of some sensitivity but perform well with different numbers of replicates [10, 20, 212].”
From A survey of best practices for RNA-seq data analysis (2016) · cites this paper as [20]
In the citing paper
“SAMseq performs well in terms of FDR but presents an acceptable sensitivity when the number of replicates is relatively high, at least 10 [20, 55, 209].”
From A survey of best practices for RNA-seq data analysis (2016) · cites this paper as [20]
In the citing paper
“Notably, neither applying GC bias correction tools (cqn14 and EDASeq15) to individual sites nor changing read counts to only use 3′-UTRs was effective at decreasing the number of inter-site false positive DEGs (Fig. 1b and Supplementary Fig. 3); in most cases, these methods actually increased the number of false positives.”
From Detecting and correcting systematic variation in large-scale RNA sequencing data (2014) · cites this paper as [15]
In the citing paper
“The application of GC content bias correction packages including cqn14 and EDASeq15 could not remove these false positives, likely because GC content bias is not the only source that contributes to bias in gene expression data.”
From Detecting and correcting systematic variation in large-scale RNA sequencing data (2014) · cites this paper as [15]
In the citing paper
“This confirms the impact of two already recognized RNA-seq latent variables, GC-content and insert size15,22, and it also identifies two more relevant contributions to technical variation, gene coverage variation and error rate.”
From Detecting and correcting systematic variation in large-scale RNA sequencing data (2014) · cites this paper as [15]
Self-check
Percentages, sums and reported differences re-computed from the paper’s own numbers.
The self-check needs the paper’s full text.
Citations
Cites
Controlling the False Discovery Rate: A Practical and Powerful Approach to Multiple Testing
Benjamini, Y., & Hochberg, Y. (1995) · Journal of the Royal Statistical Society Series B: Statistical Methodology · doi:10.1111/j.2517-6161.1995.tb02031.x · Cited by 109,482
Robinson, M. D., McCarthy, D. J., & Smyth, G. K. (2010) · Bioinformatics · doi:10.1093/bioinformatics/btp616 · Cited by 41,364
Ultrafast and memory-efficient alignment of short DNA sequences to the human genome.
Langmead, B., Trapnell, C., Pop, M., & Salzberg, S. L. (2009) · Genome Biology · doi:10.1186/gb-2009-10-3-r25 · Cited by 21,849
Differential expression analysis for sequence count data
Anders, S., & Huber, W. (2010) · Genome Biology · doi:10.1186/gb-2010-11-10-r106 · Cited by 15,581
Mapping and quantifying mammalian transcriptomes by RNA-Seq
Mortazavi, A., Williams, B. A., McCue, K., Schaeffer, L., & Wold, B. (2008) · Nature Methods · doi:10.1038/nmeth.1226 · Cited by 13,696
RNA-Seq: a revolutionary tool for transcriptomics
Wang, Z., Gerstein, M., & Snyder, M. (2009) · Nature Reviews Genetics · doi:10.1038/nrg2484 · Cited by 13,174
Smyth, G. K. (2004) · Statistical Applications in Genetics and Molecular Biology · doi:10.2202/1544-6115.1027 · Cited by 11,829
Exploration, normalization, and summaries of high density oligonucleotide array probe level data
Irizarry, R. A. (2003) · Biostatistics · doi:10.1093/biostatistics/4.2.249 · Cited by 10,603
A scaling normalization method for differential expression analysis of RNA-seq data
Robinson, M. D., & Oshlack, A. (2010) · Genome Biology · doi:10.1186/gb-2010-11-3-r25 · Cited by 7,876
Gene ontology analysis for RNA-seq: accounting for selection bias
Young, M. D., Wakefield, M. J., Smyth, G. K., & Oshlack, A. (2010) · Genome Biology · doi:10.1186/gb-2010-11-2-r14 · Cited by 7,107
Cited by
Sorted by citations
Items 401–500 of 865
Giannuzzi, D., Giudice, L., Marconato, L., Ferraresso, S., Giugno, R., Bertoni, F., & Aresu, L. (2020) · Veterinary and Comparative Oncology · doi:10.1111/vco.12588 · Cited by 15
Chouvarine, P., Antić, Ž., Lentes, J., Schröder, C., Alten, J., Brüggemann, M., Pau, E. C. D. S., Illig, T., Laguna, T., Schewe, D. M., et al. (2021) · Cancers · doi:10.3390/cancers13225653 · Cited by 15
Molecular insights into the pathways underlying naked mole-rat eusocialityPreprint
Mulugeta, E., Marion‐Poll, L., Gentien, D., Ganswindt, S. B., Ganswindt, A., Bennett, N. C., Blackburn, E. H., Faulkes, C. G., & Heard, É. (2017) · bioRxiv (Cold Spring Harbor Laboratory) · doi:10.1101/209932 · Cited by 15
Khodaparast, L., Khodaparast, L., Duran‐Romaña, R., Wu, G., Houben, B., Duverger, W., Vleeschouwer, M. D., Konstantoulea, K., Nysen, F., Schalck, T., et al. (2025) · Nature Communications · doi:10.1038/s41467-025-56873-z · Cited by 14
Comparing Segmentation Methods for Genome Annotation Based on RNA-Seq Data
Cleynen, A., Dudoit, S., & Robin, S. S. (2013) · Journal of Agricultural Biological and Environmental Statistics · doi:10.1007/s13253-013-0159-5 · Cited by 14
Self-citationSfikakis, P. P., Verrou, K., Tsitsilonis, O., Παρασκευής, Δ., Kastritis, E., Lianidou, E. S., Μουτσάτσου, Π., Terpos, E., Trougakos, I. P., Chini, V., et al. (2021) · Frontiers in Immunology · doi:10.3389/fimmu.2021.746203 · Cited by 14
Li, C., He, J., Meng, F., Wang, F., Sun, H., Zhang, H., Dong, L., Zhang, M., Xu, Q., Liang, L., et al. (2023) · Cell Death and Disease · doi:10.1038/s41419-023-06038-x · Cited by 14
Manandhar, B., Pandžić, E., Deshpande, N., Chen, S.-Y., Wasinger, V. C., Kockx, M., Glaros, E. N., Ong, K. L., Thomas, S. R., Wilkins, M. R., et al. (2023) · Arteriosclerosis Thrombosis and Vascular Biology · doi:10.1161/atvbaha.123.319378 · Cited by 14
Disruption of MAM integrity in mutant FUS oligodendroglial progenitors from hiPSCs
Zhu, Y., Burg, T., Neyrinck, K., Vervliet, T., Nami, F., Vervoort, E., Ahuja, K., Sassano, M. L., Chai, Y. C., Tharkeshwar, A. K., et al. (2024) · Acta Neuropathologica · doi:10.1007/s00401-023-02666-x · Cited by 14
Niu, Z., Kozminsky, M., Day, K. C., Broses, L. J., Henderson, M. L., Patsalis, C., Tagett, R., Qin, Z., Blumberg, S., Reichert, Z. R., et al. (2024) · Neoplasia · doi:10.1016/j.neo.2024.101036 · Cited by 16
Lozoya, O. A., Santos, J. H., & Woychik, R. P. (2018) · Frontiers in Genetics · doi:10.3389/fgene.2018.00176 · Cited by 14
k-core genes underpin structural features of breast cancer
Dorantes-Gilardi, R., García-Cortés, D., Lemus, E. H., & Enríquez, J. E. (2021) · Scientific Reports · doi:10.1038/s41598-021-95313-y · Cited by 15
Zinshteyn, D., & Barbash, D. A. (2022) · PLoS Genetics · doi:10.1371/journal.pgen.1010110 · Cited by 14
Pulmonary Arterial Hypertension and Consecutive Right Heart Failure Lead to Liver Fibrosis
Hamberger, F., Legchenko, E., Chouvarine, P., Mederacke, Y., Taubert, R., Meier, M., Jonigk, D. D., Hansmann, G., & Mederacke, I. (2022) · Frontiers in Cardiovascular Medicine · doi:10.3389/fcvm.2022.862330 · Cited by 14
Usp22 is an intracellular regulator of systemic emergency hematopoiesis
Dietlein, N., Wang, X., Metz, J., Disson, O., Shang, F., Beyersdörffer, C., Rodriguez-Correa, E., Lipka, D. B., Begus‐Nahrmann, Y., Kosinsky, R. L., et al. (2022) · Science Immunology · doi:10.1126/sciimmunol.abq2061 · Cited by 15
New Insights from Existing Sequence Data: Generating Breakthroughs without a Pipette
Plocik, A. M., & Graveley, B. R. (2013) · Molecular Cell · doi:10.1016/j.molcel.2013.01.031 · Cited by 15
Identification of Novel Reference Genes Based on MeSH Categories
Erşahin, T., Çarkacıoğlu, L., Can, T., Konu, Ö., Atalay, V., & Çetin-Atalay, R. (2014) · PLoS ONE · doi:10.1371/journal.pone.0093341 · Cited by 14
Divergence of Iron Metabolism in Wild Malaysian Yeast
Lee, H. N., Mostovoy, Y., Hsu, T. Y., Chang, A. H., & Brem, R. B. (2013) · G3 Genes Genomes Genetics · doi:10.1534/g3.113.008011 · Cited by 14
A genome-wide approach for detecting novel insertion-deletion variants of mid-range size
Xia, L. C., Sakshuwong, S., Hopmans, E. S., Bell, J., Grimes, S. M., Siegmund, D., Ji, H. P., & Zhang, N. R. (2016) · Nucleic Acids Research · doi:10.1093/nar/gkw481 · Cited by 14
Metabolic systems biology: a brief primer
Edwards, L. M. (2016) · The Journal of Physiology · doi:10.1113/jp272275 · Cited by 16
Naloxone regulates the differentiation of neural stem cells via a receptor‐independent pathway
Chen, J., Liang, L., Yuan, L., Zhang, Y., Zhang, M., Yang, T., Meng, F., Lai, X., Li, C., He, J., et al. (2020) · The FASEB Journal · doi:10.1096/fj.201902873r · Cited by 14
Pires, J. G., da Silva, G. F., Weyssow, T., Conforte, A. J., Pagnoncelli, D., da Silva, F. A. B., & Carels, N. (2021) · Frontiers in Genetics · doi:10.3389/fgene.2021.624259 · Cited by 13
van Lingen, H. J., Diez, M. S., & Saccenti, E. (2024) · Biochimica et Biophysica Acta (BBA) - Gene Regulatory Mechanisms · doi:10.1016/j.bbagrm.2024.195058 · Cited by 14
Verta, J., Moustakas-Verho, J. E., Donner, I., Frapin, M., Ruokolainen, A., Debes, P. V., Erkinaro, J., & Primmer, C. R. (2024) · Proceedings of the National Academy of Sciences · doi:10.1073/pnas.2402386121 · Cited by 13
Bayesian gamma-negative binomial modeling of single-cell RNA sequencing data
Dadaneh, S. Z., de Figueiredo, P., Sze, S., Zhou, M., & Qian, X. (2020) · BMC Genomics · doi:10.1186/s12864-020-06938-8 · Cited by 13
Pin-Pointing the Key Hubs in the IFN-γ Pathway Responding to SARS-CoV-2 Infection
Toro, A. R., Lage-Vickers, S., Bizzotto, J. A., Vilicich, F., Sabater, A. A., Pascual, G., Ledesma-Bazan, S., Sanchis, P., Ruiz, M. S., Arévalo, A. P., et al. (2022) · Viruses · doi:10.3390/v14102180 · Cited by 13
Mielecki, D., Grzesiuk, E., Bednarska, A., Garbicz, D., Świderska, B., & Grzesiuk, M. (2022) · Ecotoxicology and Environmental Safety · doi:10.1016/j.ecoenv.2022.114372 · Cited by 13
Mithramycin induces promoter reprogramming and differentiation of rhabdoid tumor
Chassé, M. H., Johnson, B. K., Boguslawski, E. A., Sorensen, K. M., Rosien, J., Kang, M. H., Reynolds, C. P., Heo, L., Madaj, Z., Beddows, I., et al. (2020) · EMBO Molecular Medicine · doi:10.15252/emmm.202012640 · Cited by 13
Patchett, A. L., Wilson, R., Charlesworth, J., Corcoran, L. M., Papenfuss, A. T., Lyons, B. A., Woods, G. M., & Tovar, C. (2018) · Oncotarget · doi:10.18632/oncotarget.24634 · Cited by 13
AIDE: annotation-assisted isoform discovery with high precisionPreprint
Li, W. V., Li, S., Tong, X., Deng, L., Shi, H., & Li, J. J. (2019) · Genome Research · doi:10.1101/gr.251108.119 · Cited by 13
Regeneration of the human segmentation clock in somitoids in vitro
Qin, Y., Huang, X., Cai, Z., Cai, B., He, J., Yao, Y., Zhou, C., Kuang, J., Yang, Y., Chen, H., et al. (2022) · The EMBO Journal · doi:10.15252/embj.2022110928 · Cited by 12
Hu, H., Ho, D. H. H., Tan, D. S., MacCarthy, C. M., Yu, C., Weng, M., Schöler, H. R., & Jauch, R. (2023) · Nucleic Acids Research · doi:10.1093/nar/gkad597 · Cited by 12
Physical cell-cell contact elicits specific transcriptomic responses in wine yeast species
Luyt, N. A., de Witt, R. N., Divol, B., Patterton, H., Setati, M. E., Taillandier, P., & Bauer, F. F. (2024) · Microbiology Spectrum · doi:10.1128/spectrum.00572-23 · Cited by 12
Targeting EGLN2/PHD1 protects motor neurons and normalizes the astrocytic interferon response
Germeys, C., Vandoorne, T., Davie, K., Poovathingal, S. K., Heeren, K., Vermeire, W., Nami, F., Moisse, M., Quaegebeur, A., Sierksma, A. S. R., et al. (2024) · Cell Reports · doi:10.1016/j.celrep.2024.114719 · Cited by 12
Transcriptional dynamics of sleep deprivation and subsequent recovery sleep in the male mouse cortex
Popescu, A., Ottaway, C. A., Ford, K., Wintler, T., Ingiosi, A. M., Medina, E., Hicks, S. C., Singletary, K. G., & Peixoto, L. (2025) · Physiological Genomics · doi:10.1152/physiolgenomics.00128.2024 · Cited by 14
Post-transcriptional Regulation of UGT2B10 Hepatic Expression and Activity by Alternative Splicing
Labriet, A., Allain, E. P., Rouleau, M., Audet-Delage, Y., Villeneuve, L., & Guillemette, C. (2018) · Drug Metabolism and Disposition · doi:10.1124/dmd.117.079921 · Cited by 12
Identification of New Transcription Factors that Can Promote Pluripotent Reprogramming
Huang, P., Zhu, J., Liu, Y., Liu, G., Zhang, R., Li, D., Pei, D., & Zhu, P. (2021) · Stem Cell Reviews and Reports · doi:10.1007/s12015-021-10220-z · Cited by 12
Srivastava, Y., Tan, D. S., Malik, V., Weng, M., Javed, A., Cojocaru, V., Wu, G., Veerapandian, V., Cheung, L. W. T., & Jauch, R. (2019) · FEBS Journal · doi:10.1111/febs.15076 · Cited by 12
Rohr, M., Beardsley, J. M., Nakkina, S. P., Zhu, X., Aljabban, J., Hadley, D., & Altomare, D. A. (2021) · Scientific Data · doi:10.1038/s41597-021-00998-5 · Cited by 12
γδ T cell-derived IL-4 initiates CD8+ T cell immunity
Le, S., Dooley, N., Murphy, D., Liu, S., Gandolfo, L. C., Ge, Z., May, R., Cozijnsen, A. J., Burn, T. N., Jennison, C., et al. (2026) · Nature Immunology · doi:10.1038/s41590-025-02397-z · Cited by 12
Funa, N. S., Mjoseng, H. K., de Lichtenberg, K. H., Raineri, S., Esen, D., Egeskov-Madsen, A. L. R., Quaranta, R., Jørgensen, M. C., Hansen, M. S., Kuylenstierna, J. V. C., et al. (2024) · Stem Cell Reports · doi:10.1016/j.stemcr.2024.05.010 · Cited by 11
Holani, R., Bar‐Yoseph, H., Krekhno, Z., Serapio-Palacios, A., Moon, K., Stacey, R. G., Donald, K., Deng, W., Bressler, B. L., Magaña, A. A., et al. (2024) · Science Signaling · doi:10.1126/scisignal.adl1786 · Cited by 11
Characterizing Circulating microRNA Signatures of Type 2 Diabetes Subtypes
Sulaiman, F., Khyriem, C., Dsouza, S., Abdul, F., Alkhnbashi, O. S., Faraji, H., Farooqi, M. H., Alawadi, F., Hassanein, M., Ahmed, F. S., et al. (2025) · International Journal of Molecular Sciences · doi:10.3390/ijms26020637 · Cited by 11
Model-to-crop conserved NUE Regulons enhance machine learning predictions of nitrogen use efficiency
Huang, J., Cheng, C., Brooks, M. D., Jeffers, T. L., Doner, N. M., Shih, H.-J. S., Frangos, S., Katari, M. S., & Coruzzi, G. M. (2025) · The Plant Cell · doi:10.1093/plcell/koaf093 · Cited by 11
Strong down-regulation of glycophorin genes: A host defense mechanism against rotavirus infection
Salas, A., Marco-Puche, G., Triviño, J. C., Gómez‐Carballa, A., Cebey‐López, M., Calle, I. R., Vilanova‐Trillo, L., Rodrı́guez-Tenreiro, C., Rial, J. G., & Martinón‐Torres, F. (2016) · Infection Genetics and Evolution · doi:10.1016/j.meegid.2016.07.044 · Cited by 11
Non‐canonical expression patterns and evolutionary rates of sex‐biased genes in a seasonal fish
Machado, M. P., Matos, I., Grosso, A. R., Schartl, M., & Coelho, M. M. (2016) · Molecular Reproduction and Development · doi:10.1002/mrd.22752 · Cited by 11
Song, P.-C., Wu, T., Hong, M., & Chen, M. (2015) · Comparative Biochemistry and Physiology Part B Biochemistry and Molecular Biology · doi:10.1016/j.cbpb.2015.05.005 · Cited by 11
Renthal, N. E., Nakka, P., Baronas, J. M., Kronenberg, H. M., & Hirschhorn, J. N. (2020) · Journal of Bone and Mineral Research · doi:10.1002/jbmr.4408 · Cited by 11
A Vicenary Analysis of SARS-CoV-2 Genomes
Hassan, S. S., Rout, R. K., Sahoo, K. S., Jhanjhi, N. Z., Umer, S., Tabbakh, T., & Almusaylim, Z. A. (2021) · Computers, materials & continua/Computers, materials & continua (Print) · doi:10.32604/cmc.2021.017206 · Cited by 11
Hudson, J., Deshpande, N., Leblanc, C., & Egan, S. (2022) · Molecular Ecology · doi:10.1111/mec.16476 · Cited by 11
Depuydt, C., Goosens, V., Janky, R., D’Hondt, A., Bleecker, J. D., Noppe, N., Derveaux, S., Thal, D. R., & Claeys, K. G. (2022) · Cells · doi:10.3390/cells11091508 · Cited by 11
Oncogenic Role of miR-217 During Clear Cell Renal Carcinoma Progression
Zamora-Fuentes, J. M., Lemus, E. H., & Enríquez, J. E. (2022) · Frontiers in Oncology · doi:10.3389/fonc.2022.934711 · Cited by 11
Loubet, I., Meyer, L. S., Michel, S., Pernin, F., Carrère, S., Barrès, B., Corre, V. L., & Délye, C. (2023) · BMC Plant Biology · doi:10.1186/s12870-023-04524-0 · Cited by 11
CASTIN: a system for comprehensive analysis of cancer-stromal interactome
Komura, D., Isagawa, T., Kishi, K., Suzuki, R. H., Sato, R., Tanaka, M. H., Katoh, H., Yamamoto, S., Tatsuno, K., Fukayama, M., et al. (2016) · BMC Genomics · doi:10.1186/s12864-016-3207-z · Cited by 11
Walworth, N. G., Hutchins, D. A., Dolzhenko, E., Lee, M., Fu, F., Smith, A. D., & Webb, E. A. (2017) · Environmental Microbiology · doi:10.1111/1462-2920.13934 · Cited by 11
Metatranscriptomic dynamics after Verticillium dahliae infection and root damage in Olea europaea
Martí, J. M., Arias‐Giraldo, L. F., Dı́az-Villanueva, W., Arnau, V., Rodríguez-Franco, A., & Peña-Garay, C. (2020) · BMC Plant Biology · doi:10.1186/s12870-019-2185-0 · Cited by 11
Harrison, J. G., Randolph, G. D., & Buerkle, C. A. (2021) · mSystems · doi:10.1128/msystems.00294-21 · Cited by 12
The homeodomain of Oct4 is a dimeric binder of methylated CpG elements
Tan, D. S., Cheung, S. L., Gao, Y., Weinbuch, M., Hu, H., Shi, L., Ti, S.-C., Hutchins, A. P., Cojocaru, V., & Jauch, R. (2022) · Nucleic Acids Research · doi:10.1093/nar/gkac1262 · Cited by 11
Loss of long-range co-expression is a common feature in cancer
García-Cortés, D., Lemus, E. H., & Enríquez, J. E. (2026) · npj Systems Biology and Applications · doi:10.1038/s41540-026-00706-2 · Cited by 11
A Novel Dataset for Identifying Sex-Biased Genes in Drosophila
VanKuren, N. W., & Vibranovski, M. D. (2014) · Journal of Genomics · doi:10.7150/jgen.7955 · Cited by 11
Bogren, L. K., Grabek, K. R., Barsh, G. S., & Martin, S. L. (2017) · Journal of Comparative Physiology B · doi:10.1007/s00360-017-1073-x · Cited by 11
Realistic simulations reveal extensive sample-specificity of RNA-seq biasesPreprint
Sipos, B., Slodkowicz, G., Massingham, T., & Goldman, N. (2013) · arXiv (Cornell University) · doi:10.48550/arxiv.1308.3172 · Cited by 12
Development of Reference Genes for Horticultural Plants
Ahmed, U., Xie, Q., Shi, X., & Zheng, B. (2022) · Critical Reviews in Plant Sciences · doi:10.1080/07352689.2022.2084227 · Cited by 10
Ye, L., Dittlau, K. S., Sicart, A., Janky, R., Damme, P. V., & Bosch, L. V. D. (2025) · Neurobiology of Disease · doi:10.1016/j.nbd.2025.106815 · Cited by 10
Adaptive evolution of Candida albicans through modulating TOR signaling
Zhang, Y., Yang, L., Zhao, Y., Xiong, K., Cui, H., Wang, T., Liu, X., Su, C., & Lü, Y. (2025) · mBio · doi:10.1128/mbio.03947-24 · Cited by 10
Application of miRNA-seq in neuropsychiatry: A methodological perspective
Pérez-Rodríguez, D., López-Fernández, H., & Agís‐Balboa, R. C. (2021) · Computers in Biology and Medicine · doi:10.1016/j.compbiomed.2021.104603 · Cited by 10
MUREN: a robust and multi-reference approach of RNA-seq transcript normalization
Feng, Y., & Li, L. M. (2021) · BMC Bioinformatics · doi:10.1186/s12859-021-04288-0 · Cited by 10
Zandavi, S. M., Koch, F. C., Vijayan, A., Zanini, F., Valdés‐Mora, F., Gallego‐Ortega, D., & Vafaee, F. (2022) · Nucleic Acids Research · doi:10.1093/nar/gkac436 · Cited by 11
Zhao, S., Zhang, L., & Liu, X. (2022) · Frontiers of Computer Science · doi:10.1007/s11704-022-2011-y · Cited by 10
Myo1e overexpression in lung adenocarcinoma is associated with increased risk of mortality
Jusué-Torres, I., Tiv, R., Ricarte‐Filho, J. C., Mallisetty, A., Contreras-Vargas, L., Calderon, M. J. G., Khaddour, K., Kennedy, K. J., Valyi‐Nagy, K., David, O., et al. (2023) · Scientific Reports · doi:10.1038/s41598-023-30765-y · Cited by 11
Kim, H., Barua, A., Huang, L., Zhou, T., Bolaji, M., Zachariah, S., Mitra, A., Jung, S. Y., He, B., & Feng, Q. F. (2023) · Oncogene · doi:10.1038/s41388-023-02690-x · Cited by 10
Costa, M. C., Angelini, C., Franzese, M., Iside, C., Salvatore, M., Laezza, L., Napolitano, F., & Ceccarelli, M. (2024) · Journal of Translational Medicine · doi:10.1186/s12967-024-05006-z · Cited by 10
Pïcca, A., Stefano, A. L. D., Savatovsky, J., Ducray, F., Chinot, O. L., Moyal, E. C., Augereau, P., Rhun, É. L., Schmitt, Y., Rousseaux, N., et al. (2024) · Neuro-Oncology Advances · doi:10.1093/noajnl/vdae068 · Cited by 10
Wang, E., Ye, Y., Zhang, K., Yang, J., Gong, D., Zhang, J., Hong, R., Zhang, H., Li, L., Chen, G., et al. (2020) · Virology Journal · doi:10.1186/s12985-020-01344-8 · Cited by 10
Vandelle, E., Ariani, P., Regaiolo, A., Danzi, D., Lovato, A., Zadra, C., Vitulo, N., Gambino, G., & Polverari, A. (2021) · International Journal of Molecular Sciences · doi:10.3390/ijms22020940 · Cited by 10
Zhang, X., Chen, L., Huang, X., Chen, H., Cai, B., Qin, Y., Chen, Y., Ou, S., Li, X., Wu, Z., et al. (2022) · Stem Cell Reviews and Reports · doi:10.1007/s12015-022-10339-7 · Cited by 10
A transcriptional network of cell cycle dysregulation in noninvasive papillary urothelial carcinoma
Warrick, J. I., Knowles, M. A., Hurst, C. D., Shuman, L., Raman, J. D., Walter, V., Putt, J., Dyrskjøt, L., Groeneveld, C. S., Castro, M. A. A., et al. (2022) · Scientific Reports · doi:10.1038/s41598-022-20927-9 · Cited by 10
Leontovyč, R., Young, N. D., Korhonen, P. K., Hall, R. S., Bulantová, J., Jeřábková, V., Kašný, M., Gasser, R. B., & Horák, P. (2019) · Scientific Reports · doi:10.1038/s41598-018-37669-2 · Cited by 10
bigPint: A Bioconductor visualization package that makes big data pint-sized
Rutter, L. A., & Cook, D. (2020) · PLoS Computational Biology · doi:10.1371/journal.pcbi.1007912 · Cited by 10
Multifactorial Inheritance and Complex Diseases
Fialkowski, A., Beasley, T. M., & Tiwari, H. K. (2019) · Elsevier eBooks · doi:10.1016/b978-0-12-812537-3.00011-1 · Cited by 10
Byars, S., Prestes, P. R., Suphapimol, V., Takeuchi, F., Vries, N. D., Maier, M. C., Melo, M., Balding, D. J., Samani, N. J., Allen, A. M., et al. (2024) · Cardiovascular Research · doi:10.1093/cvr/cvae053 · Cited by 9
Effects of light regimes on circadian gene co‐expression networks in Arabidopsis thaliana
Rivière, Q., Raskin, V., de Melo, R., Boutet‐Mercey, S., Corso, M., Defrance, M., Webb, A. A. R., Verbruggen, N., & Anoman, A. D. (2024) · Plant Direct · doi:10.1002/pld3.70001 · Cited by 11
The nuclear matrix stabilizes primed-specific genes in human pluripotent stem cells
Ma, G., Fu, X., Zhou, L. B., Babarinde, I. A., Shi, L., Yang, W., Chen, J., Xiao, Z., Qiao, Y., Ma, L., et al. (2025) · Nature Cell Biology · doi:10.1038/s41556-024-01595-5 · Cited by 9
Ferrer-Bonsoms, J. A., Gimeno, M., Olaverri-Mendizabal, D., Sacristan, P., Lobato‐Fernández, C., Castilla, C., Carazo, F., & Rubio, Á. (2022) · NAR Genomics and Bioinformatics · doi:10.1093/nargab/lqac067 · Cited by 9
Functional impact of multi-omic interactions in breast cancer subtypes
Ochoa, S., & Lemus, E. H. (2023) · Frontiers in Genetics · doi:10.3389/fgene.2022.1078609 · Cited by 9
CK2β-regulated signaling controls B cell differentiation and function
Tubi, L. Q., Mandato, E., Nunes, S. C., Arjomand, A., Zaffino, F., Manni, S., Casellato, A., Macaccaro, P., Vitulo, N., Zumerle, S., et al. (2023) · Frontiers in Immunology · doi:10.3389/fimmu.2022.959138 · Cited by 9
NORMSEQ: a tool for evaluation, selection and visualization of RNA-Seq normalization methods
Scheepbouwer, C., Hackenberg, M., van Eijndhoven, M. A. J., Gerber, A., Pegtel, D. M., & Gómez‐Martín, C. (2023) · Nucleic Acids Research · doi:10.1093/nar/gkad429 · Cited by 9
Differential expression analysis for sequence count data via mixtures of negative binomials
Bonafede, E. (2015) · AMS Dottorato Institutional Doctoral Theses Repository (University of Bologna) · doi:10.6092/unibo/amsdottorato/6741 · Cited by 9
The Role of Copy Number Variants in Gene Co-Expression Patterns for Luminal B Breast Tumors
Hernández-Gómez, C., Lemus, E. H., & Enríquez, J. E. (2022) · Frontiers in Genetics · doi:10.3389/fgene.2022.806607 · Cited by 9
Sibilio, P., Conte, F., Huang, Y., Castaldi, P. J., Hersh, C. P., DeMeo, D. L., Silverman, E. K., & Paci, P. (2024) · Heliyon · doi:10.1016/j.heliyon.2024.e31301 · Cited by 8
Broumand, A., & Hu, T. (2015) · IEEE Global Conference on Signal and Information Processing · doi:10.1109/globalsip.2015.7418377 · Cited by 8
Arkas: Rapid reproducible RNAseq analysis
Colombo, A., Triche, T. J., Jr., & Ramsingh, G. (2017) · F1000Research · doi:10.12688/f1000research.11355.2 · Cited by 8
Single‐Cell Sequencing to Unveil the Mystery of Embryonic Development
Li, Z., Lin, F., Zhong, C., Wang, S., Xue, X., & Shao, Y. (2021) · Advanced Biology · doi:10.1002/adbi.202101151 · Cited by 8
Effect of insulin insufficiency on ultrastructure and function in skeletal muscle
Kopecky, C., Haug, M., Reischl, B., Deshpande, N., Manandhar, B., King, T. W., Lee, V., Wilkins, M. R., Morris, M. J., Polly, P., et al. (2023) · Journal of Cachexia Sarcopenia and Muscle · doi:10.1002/jcsm.13380 · Cited by 8
Mesenchymal plasticity of devil facial tumour cells during in vivo vaccine and immunotherapy trials
Patchett, A. L., Tovar, C., Blackburn, N. B., Woods, G. M., & Lyons, A. B. (2021) · Immunology and Cell Biology · doi:10.1111/imcb.12451 · Cited by 8
Alenda, C., Rojas, E., & Valor, L. M. (2021) · PLoS ONE · doi:10.1371/journal.pone.0255168 · Cited by 8
Rodriguez-Valbuena, H., González-Muñoz, A., & Cadavid, L. F. (2022) · Immunogenetics · doi:10.1007/s00251-022-01268-3 · Cited by 8
Zhang, J., Cheng, H. M., Narzo, A. D., Zhu, Y., Shan, M., Zhang, Z., Shao, X., Chen, J., Wang, C., & Hao, K. (2022) · The Science of The Total Environment · doi:10.1016/j.scitotenv.2022.157977 · Cited by 8
Özbek, M., Toy, H. I., Oktay, Y., Karakülah, G., Süner, A., & Pavlopoulou, A. (2023) · PeerJ · doi:10.7717/peerj.15096 · Cited by 8
The network structure of hematopoietic cancers
Nakamura-García, A. K., & Enríquez, J. E. (2023) · Scientific Reports · doi:10.1038/s41598-023-46655-2 · Cited by 8
Metadata
- Authors
- Risso, D., Schwartz, K., Sherlock, G., & Dudoit, S.
- Affiliations
- University of Padua (IT)
- Stanford University (US)
- University of California, Berkeley (US)
- Corresponding author
- Dudoit, Sandrine
- Venue
- BMC Bioinformatics
- Published
- 2011-12
- Volume
- 12
- Issue
- 1
- Pages
- 480-480
- ISSN
- 1471-2105 (ISSN-L)
- PMC
- PMC3315510
- OpenAlex
- W2168342464
- Cited by
- 867
- References
- 35
- Citations by year
- 2026: 29 · 2025: 58 · 2024: 83 · 2023: 80 · 2022: 89 · 2021: 97 · 2020: 74 · 2019: 55 · 2018: 60 · 2017: 49 · 2016: 59 · 2015: 38 · 2014: 48 · 2013: 30 · 2012: 18
- FWCI
- 12.48
- Type
- journal article
- Language
- en
- Open access
- gold
- doi.org
- Licence
- cc-by
- Locations
- BMC Bioinformatics (publishedVersion, cc-by)
- Europe PMC (PubMed Central) (publishedVersion, cc-by)
- PubMed Central (publishedVersion, cc-by)
- PubMed (publishedVersion)
- Collection of Biostatistics Research Archive (submittedVersion)
- DOAJ (DOAJ: Directory of Open Access Journals) (submittedVersion, cc-by-sa)
- eScholarship (California Digital Library) (submittedVersion)
- Padua Research Archive (University of Padova) (submittedVersion, cc-by)
- Funders
- Università degli Studi di Padova
- National Institutes of Health
- National Human Genome Research Institute (R01 HG03468, R01HG003468)
- National Institute of Allergy and Infectious Diseases (R01AI077737)
- Topics
- Life Sciences › Biochemistry, Genetics and Molecular Biology › Molecular Biology › Gene expression and cancer classification
- Life Sciences › Biochemistry, Genetics and Molecular Biology › Molecular Biology › Genomics and Phylogenetic Studies
- Life Sciences › Biochemistry, Genetics and Molecular Biology › Molecular Biology › Single-cell and spatial transcriptomics
- Keywords
- RNA-seq, differential gene expression, gene expression bias, transcriptome sequencing
- MeSH terms
- Base Composition, Saccharomyces cerevisiae, Sequence Analysis, RNA, Gene Expression Profiling, Transcriptome
About these checks
Registry, retraction, Cites and statistics results are computed, not judged, with one exception: a printed reference that no index lists is read once by a model before it counts as a citation error. Claims are extracted by a model and kept only when their quote appears verbatim in the text; each cited source is then checked, with a model’s help, for whether it says what the claim relies on. Those verdicts can be wrong — read the claim’s quote and the cited source before relying on one.
Statistics and arithmetic are recomputed, not judged.
Confidence bands are shown only for fields calibrated on our annotated test set. None is calibrated yet, so no band is shown.
What counts as a claim ›How we measure confidence ›How we check this ›
Are you an author, or do you see a problem with this page? Request a review
