

The DOI matches its Crossref record; 2 of the 2 references it cites were found in a registry or an index.
Integrating microRNA and mRNA expression profiles of neuronal progenitors to identify regulatory networks underlying the onset of cortical neurogenesis
Overview
The claims and statistics of this paper haven’t been checked yet.
Run the check — free, no account needed. It reads the open-access text and checks the sources it cites.
Integrity signals
Registry
Cites
Statistics
Figures
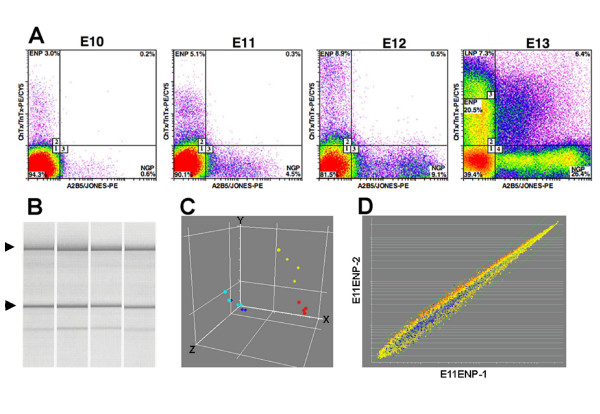
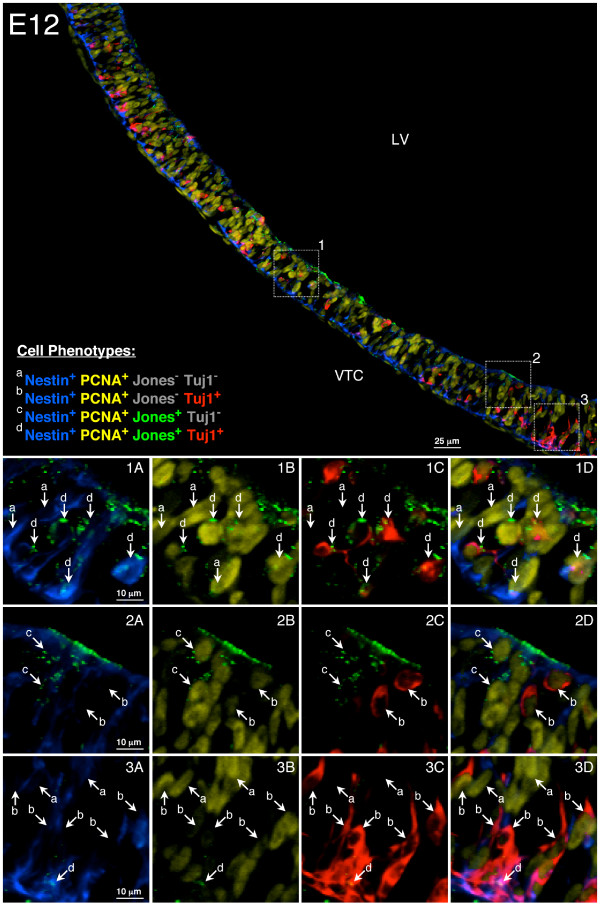
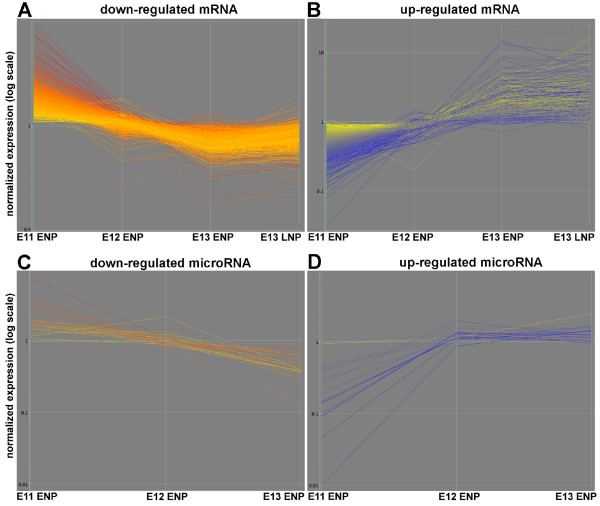
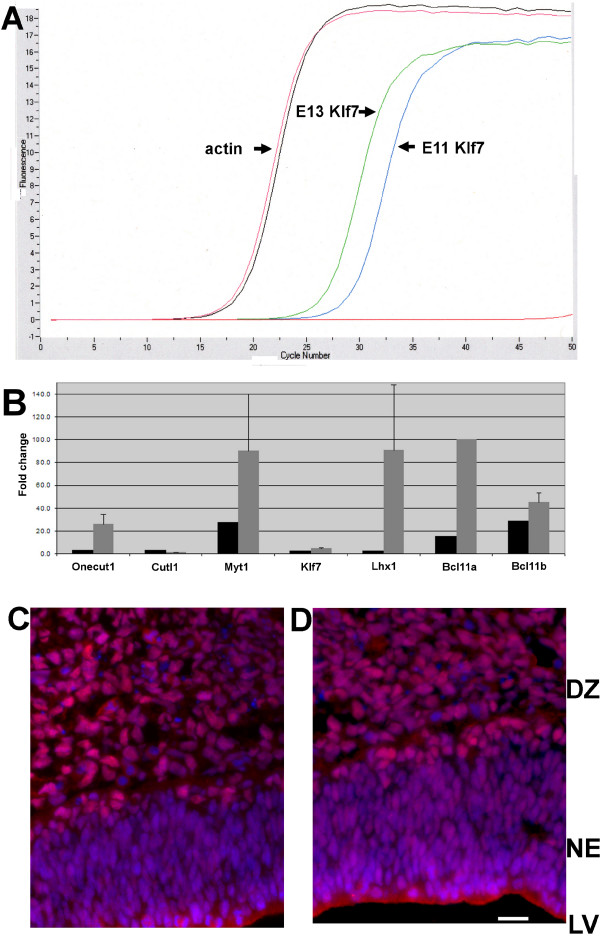
Verification
Claims the paper makes
The claims and statistics of this paper haven’t been checked yet.
Run the check — free, no account needed. It reads the open-access text and checks the sources it cites.
Claims other papers make about this one
Each is checked against this paper’s own text: does it say what the citing paper says it does?
The check wasn’t confident either way, so it gives no verdict — never disputed.
In the citing paper
“while it has been shown that miR-486a and miR-486b promote myoblast differentiation (48) and are involved in regulatory pathways of ectodermal-derived tissues (49,50)”
From MicroRNA profiling of mouse cortical progenitors and neurons reveals miR-486-5p as a regulator of neurogenesis (2020) · cites this paper as [48]
Experimental — accuracy not yet measured
Self-check
Percentages, sums and reported differences re-computed from the paper’s own numbers.
The self-check needs the paper’s full text.
Citations
Cites
The Widespread Impact of Mammalian MicroRNAs on mRNA Repression and Evolution
Farh, K. K.-H., Grimson, A., Jan, C., Lewis, B. P., Johnston, W. K., Lim, L. P., Burge, C. B., & Bartel, D. P. (2005) · Science · doi:10.1126/science.1121158 · Cited by 1,484
A microRNA array reveals extensive regulation of microRNAs during brain development
KRICHEVSKY, A. M., KING, K. S., DONAHUE, C. P., KHRAPKO, K., & KOSIK, K. S. (2003) · RNA · doi:10.1261/rna.5980303 · Cited by 1,040
Research works printed but not linked: 40
- Guillemot F, Molnar Z, Tarabykin V, Stoykova A: Molecular mechanisms of cortical differentiation. Eur J Neurosci. 2006, 23 (4): 857-868. 10.1111/j.1460-9568.2006.04626.x. · DOI
- Molyneaux BJ, Arlotta P, Menezes JR, Macklis JD: Neuronal subtype specification in the cerebral cortex. Nat Rev Neurosci. 2007, 8 (6): 427-437. 10.1038/nrn2151. · DOI
- Rash BG, Grove EA: Area and layer patterning in the developing cerebral cortex. Curr Opin Neurobiol. 2006, 16 (1): 25-34. 10.1016/j.conb.2006.01.004. · DOI
- Soria JM, Fairen A: Cellular mosaics in the rat marginal zone define an early neocortical territorialization. Cereb Cortex. 2000, 10 (4): 400-412. 10.1093/cercor/10.4.400. · DOI
- Stoykova A, Treichel D, Hallonet M, Gruss P: Pax6 modulates the dorsoventral patterning of the mammalian telencephalon. J Neurosci. 2000, 20 (21): 8042-8050. · DOI
- Xuan S, Baptista CA, Balas G, Tao W, Soares VC, Lai E: Winged helix transcription factor BF-1 is essential for the development of the cerebral hemispheres. Neuron. 1995, 14 (6): 1141-1152. 10.1016/0896-6273(95)90262-7. · DOI
- Abramova N, Charniga C, Goderie SK, Temple S: Stage-specific changes in gene expression in acutely isolated mouse CNS progenitor cells. Dev Biol. 2005, 283 (2): 269-281. 10.1016/j.ydbio.2005.03.040. · DOI
- Kudo LC, Karsten SL, Chen J, Levitt P, Geschwind DH: Genetic analysis of anterior posterior expression gradients in the developing mammalian forebrain. Cereb Cortex. 2007, 17 (9): 2108-2122. 10.1093/cercor/bhl118. · DOI
- Bartel DP: MicroRNAs: genomics, biogenesis, mechanism, and function. Cell. 2004, 116 (2): 281-297. 10.1016/S0092-8674(04)00045-5. · DOI
- Bushati N, Cohen SM: microRNA functions. Annu Rev Cell Dev Biol. 2007, 23: 175-205. 10.1146/annurev.cellbio.23.090506.123406. · DOI · Paper page
- Lee RC, Feinbaum RL, Ambros V: The C. elegans heterochronic gene lin-4 encodes small RNAs with antisense complementarity to lin-14. Cell. 1993, 75 (5): 843-854. 10.1016/0092-8674(93)90529-Y. · DOI · Paper page
- Thomson JM, Parker J, Perou CM, Hammond SM: A custom microarray platform for analysis of microRNA gene expression. Nat Methods. 2004, 1 (1): 47-53. 10.1038/nmeth704. · DOI
- Miska EA, Alvarez-Saavedra E, Townsend M, Yoshii A, Sestan N, Rakic P, Constantine-Paton M, Horvitz HR: Microarray analysis of microRNA expression in the developing mammalian brain. Genome Biol. 2004, 5 (9): R68-10.1186/gb-2004-5-9-r68. · DOI · Paper page
- Visvanathan J, Lee S, Lee B, Lee JW, Lee SK: The microRNA miR-124 antagonizes the anti-neural REST/SCP1 pathway during embryonic CNS development. Genes Dev. 2007, 21 (7): 744-749. 10.1101/gad.1519107. · DOI · Paper page
- Krichevsky AM, Sonntag KC, Isacson O, Kosik KS: Specific microRNAs modulate embryonic stem cell-derived neurogenesis. Stem Cells. 2006, 24 (4): 857-864. 10.1634/stemcells.2005-0441. · DOI · Paper page
- Sood P, Krek A, Zavolan M, Macino G, Rajewsky N: Cell-type-specific signatures of microRNAs on target mRNA expression. Proc Natl Acad Sci USA. 2006, 103 (8): 2746-2751. 10.1073/pnas.0511045103. · DOI · Paper page
- Maric D, Fiorio Pla A, Chang YH, Barker JL: Self-renewing and differentiating properties of cortical neural stem cells are selectively regulated by basic fibroblast growth factor (FGF) signaling via specific FGF receptors. J Neurosci. 2007, 27 (8): 1836-1852. 10.1523/JNEUROSCI.5141-06.2007. · DOI
- Maric D, Maric I, Chang YH, Barker JL: Stereotypical physiological properties emerge during early neuronal and glial lineage development in the embryonic rat neocortex. Cereb Cortex. 2000, 10 (8): 729-747. 10.1093/cercor/10.8.729. · DOI
- Gray PA, Fu H, Luo P, Zhao Q, Yu J, Ferrari A, Tenzen T, Yuk DI, Tsung EF, Cai Z, Alberta JA, Cheng LP, Liu Y, Stenman JM, Valerius MT, Billings N, Kim HA, Greenberg ME, McMahon AP, Rowitch DH, Stiles CD, Ma Q: Mouse brain organization revealed through direct genome-scale TF expression analysis. Science. 2004, 306 (5705): 2255-2257. 10.1126/science.1104935. · DOI
- Arlotta P, Molyneaux BJ, Chen J, Inoue J, Kominami R, Macklis JD: Neuronal subtype-specific genes that control corticospinal motor neuron development in vivo. Neuron. 2005, 45 (2): 207-221. 10.1016/j.neuron.2004.12.036. · DOI
- Anderson SA, Eisenstat DD, Shi L, Rubenstein JL: Interneuron migration from basal forebrain to neocortex: dependence on Dlx genes. Science. 1997, 278 (5337): 474-476. 10.1126/science.278.5337.474. · DOI · Paper page
- Laub F, Lei L, Sumiyoshi H, Kajimura D, Dragomir C, Smaldone S, Puche AC, Petros TJ, Mason C, Parada LF, Ramirez F: Transcription factor KLF7 is important for neuronal morphogenesis in selected regions of the nervous system. Mol Cell Biol. 2005, 25 (13): 5699-5711. 10.1128/MCB.25.13.5699-5711.2005. · DOI
- Tang F, Hajkova P, Barton SC, Lao K, Surani MA: MicroRNA expression profiling of single whole embryonic stem cells. Nucleic Acids Res. 2006, 34 (2): e9-10.1093/nar/gnj009. · DOI
- Houbaviy HB, Murray MF, Sharp PA: Embryonic stem cell-specific microRNAs. Dev Cell. 2003, 5 (2): 351-358. 10.1016/S1534-5807(03)00227-2. · DOI
- Tsang J, Zhu J, van Oudenaarden A: MicroRNA-mediated feedback and feedforward loops are recurrent network motifs in mammals. Mol Cell. 2007, 26 (5): 753-767. 10.1016/j.molcel.2007.05.018. · DOI · Paper page
- Hornstein E, Mansfield JH, Yekta S, Hu JK, Harfe BD, McManus MT, Baskerville S, Bartel DP, Tabin CJ: The microRNA miR-196 acts upstream of Hoxb8 and Shh in limb development. Nature. 2005, 438 (7068): 671-674. 10.1038/nature04138. · DOI
- Shyu AB, Wilkinson MF, van Hoof A: Messenger RNA regulation: to translate or to degrade. Embo J. 2008, 27 (3): 471-481. 10.1038/sj.emboj.7601977. · DOI
- Yekta S, Shih IH, Bartel DP: MicroRNA-directed cleavage of HOXB8 mRNA. Science. 2004, 304 (5670): 594-596. 10.1126/science.1097434. · DOI · Paper page
- Liapi A, Pritchett J, Jones O, Fujii N, Parnavelas JG, Nadarajah B: Stromal-derived factor 1 signalling regulates radial and tangential migration in the developing cerebral cortex. Dev Neurosci. 2008, 30 (1–3): 117-131. 10.1159/000109857. · DOI
- Bartel DP, Chen CZ: Micromanagers of gene expression: the potentially widespread influence of metazoan microRNAs. Nat Rev Genet. 2004, 5 (5): 396-400. 10.1038/nrg1328. · DOI
- Carey RG, Li B, DiCicco-Bloom E: Pituitary adenylate cyclase activating polypeptide anti-mitogenic signaling in cerebral cortical progenitors is regulated by p57Kip2-dependent CDK2 activity. J Neurosci. 2002, 22 (5): 1583-1591. · DOI
- Vasudevan S, Tong Y, Steitz JA: Switching from repression to activation: microRNAs can up-regulate translation. Science. 2007, 318 (5858): 1931-1934. 10.1126/science.1149460. · DOI
- Maric D, Maric I, Chang YH, Barker JL: Prospective cell sorting of embryonic rat neural stem cells and neuronal and glial progenitors reveals selective effects of basic fibroblast growth factor and epidermal growth factor on self-renewal and differentiation. J Neurosci. 2003, 23 (1): 240-251. · DOI
- Barrett T, Suzek TO, Troup DB, Wilhite SE, Ngau WC, Ledoux P, Rudnev D, Lash AE, Fujibuchi W, Edgar R: NCBI GEO: mining millions of expression profiles – database and tools. Nucleic Acids Res. 2005, D562-566. 33 Database · DOI
- Pfaffl MW, Horgan GW, Dempfle L: Relative expression software tool (REST) for group-wise comparison and statistical analysis of relative expression results in real-time PCR. Nucleic Acids Res. 2002, 30 (9): e36-10.1093/nar/30.9.e36. · DOI
- Maric D, Barker JL: Fluorescence-based sorting of neural stem cells and progenitors. Curr Protoc Neurosci. 2005, Chapter 3 (Unit 3): 18.
- Grimson A, Farh KK, Johnston WK, Garrett-Engele P, Lim LP, Bartel DP: MicroRNA targeting specificity in mammals: determinants beyond seed pairing. Mol Cell. 2007, 27 (1): 91-105. 10.1016/j.molcel.2007.06.017. · DOI · Paper page
- Liu G, Loraine AE, Shigeta R, Cline M, Cheng J, Valmeekam V, Sun S, Kulp D, Siani-Rose MA: NetAffx: Affymetrix probesets and annotations. Nucleic Acids Res. 2003, 31 (1): 82-86. 10.1093/nar/gkg121. · DOI
- Dennis G, Sherman BT, Hosack DA, Yang J, Gao W, Lane HC, Lempicki RA: DAVID: Database for Annotation, Visualization, and Integrated Discovery. Genome Biol. 2003, 4 (5): P3-10.1186/gb-2003-4-5-p3. · DOI · Paper page
- Breitkreutz BJ, Stark C, Tyers M: Osprey: a network visualization system. Genome Biol. 2003, 4 (3): R22-10.1186/gb-2003-4-3-r22. · DOI
Cited by
Sorted by citations
Zucchi, F. C. R., Yao, Y., Ward, I. D., Ilnytskyy, Y., Olson, D. M., Benzies, K., Kovalchuk, I., Kovalchuk, O., & Metz, G. A. S. (2013) · PLoS ONE · doi:10.1371/journal.pone.0056967 · Cited by 193
Dori, M., Cavalli, D., Lesche, M., Massalini, S., Alieh, L. H. A., de Toledo, B. C., Khudayberdiev, S., Schratt, G., Dahl, A., & Calegari, F. (2020) · Development · doi:10.1242/dev.190520 · Cited by 22
Metadata
- Authors
- Nielsen, J. A., Lau, P., Maric, D., Barker, J. L., & Hudson, L. D.
- Venue
- BMC Neuroscience
- Published
- 2009-08-19
- Volume
- 10
- Issue
- 1
- ISSN
- 1471-2202
- PMC
- PMC2736963
- Cited by
- 66
- References
- 2
- Language
- en
About these checks
Registry, retraction, Cites and statistics results are computed, not judged, with one exception: a printed reference that no index lists is read once by a model before it counts as a citation error. Claims are extracted by a model and kept only when their quote appears verbatim in the text; each cited source is then checked, with a model’s help, for whether it says what the claim relies on. Those verdicts can be wrong — read the claim’s quote and the cited source before relying on one.
Statistics and arithmetic are recomputed, not judged.
Confidence bands are shown only for fields calibrated on our annotated test set. None is calibrated yet, so no band is shown.
What counts as a claim ›How we measure confidence ›How we check this ›
Are you an author, or do you see a problem with this page? Request a review
