

The DOI matches its Crossref record; 60 of the 60 references it cites were found in a registry or an index.
Genome-wide identification of FoxO-dependent gene networks in skeletal muscle during C26 cancer cachexia
Open accessAbstract
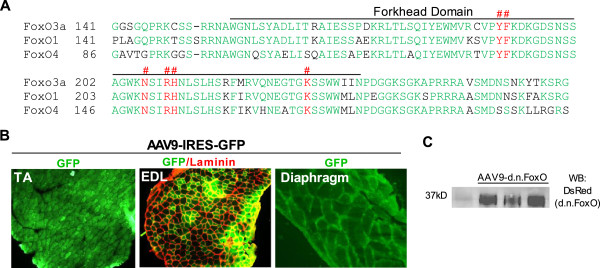
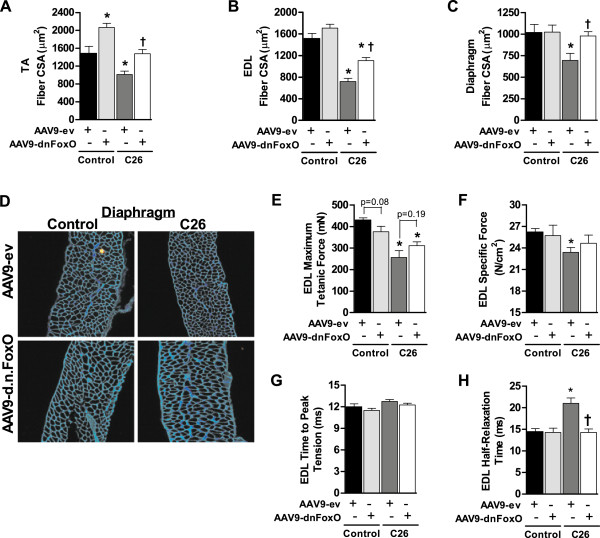
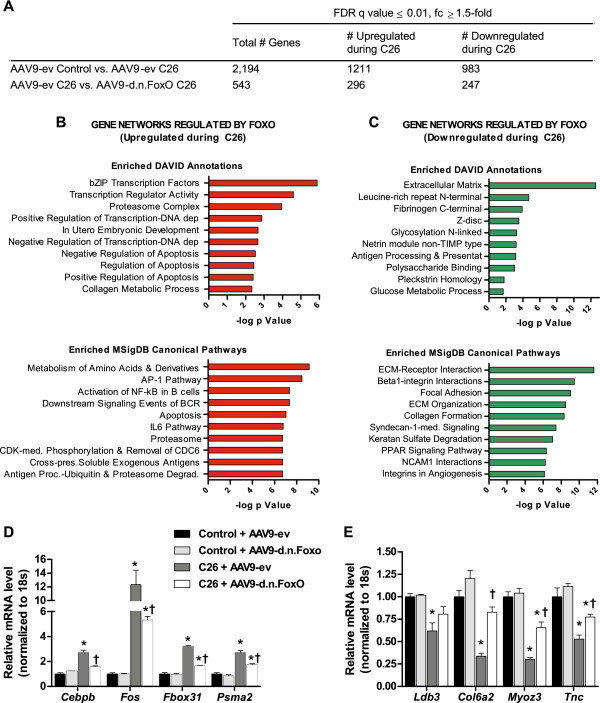
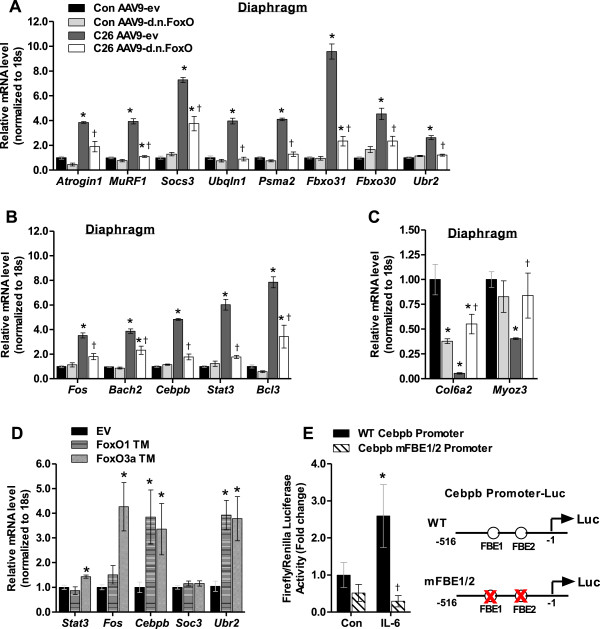
BACKGROUND: Evidence from cachectic cancer patients and animal models of cancer cachexia supports the involvement of Forkhead box O (FoxO) transcription factors in driving cancer-induced skeletal muscle wasting. However, the genome-wide gene networks and associated biological processes regulated by FoxO during cancer cachexia are unknown. We hypothesize that FoxO is a central upstream regulator of diverse gene networks in skeletal muscle during cancer that may act coordinately to promote the wasting phenotype. METHODS: To inhibit endogenous FoxO DNA-binding, we transduced limb and diaphragm muscles of mice with AAV9 containing the cDNA for a dominant negative (d.n.) FoxO protein (or GFP control). The d.n.FoxO construct consists of only the FoxO3a DNA-binding domain that is highly homologous to that of FoxO1 and FoxO4, and which outcompetes and blocks endogenous FoxO DNA binding. Mice were subsequently inoculated with Colon-26 (C26) cells and muscles harvested 26 days later. RESULTS: Blocking FoxO prevented C26-induced muscle fiber atrophy of both locomotor muscles and the diaphragm and significantly spared force deficits. This sparing of muscle size and function was associated with the differential regulation of 543 transcripts (out of 2,093) which changed in response to C26. Bioinformatics analysis of upregulated gene transcripts that required FoxO revealed enrichment of the proteasome, AP-1 and IL-6 pathways, and included several atrophy-related transcription factors, including Stat3, Fos, and Cebpb. FoxO was also necessary for the cancer-induced downregulation of several gene transcripts that were enriched for extracellular matrix and sarcomere protein-encoding genes. We validated these findings in limb muscles and the diaphragm through qRT-PCR, and further demonstrate that FoxO1 and/or FoxO3a are sufficient to increase Stat3, Fos, Cebpb, and the C/EBPβ target gene, Ubr2. Analysis of the Cebpb proximal promoter revealed two bona fide FoxO binding elements, which we further establish are necessary for Cebpb promoter activation in response to IL-6, a predominant cytokine in the C26 cancer model. CONCLUSIONS: These findings provide new evidence that FoxO-dependent transcription is a central node controlling diverse gene networks in skeletal muscle during cancer cachexia, and identifies novel candidate genes and networks for further investigation as causative factors in cancer-induced wasting.
Overview
The claims and statistics of this paper haven’t been checked yet.
Run the check — free, no account needed. It reads the open-access text and checks the sources it cites.
Integrity signals
Registry
Cites
Statistics
Figures
Verification
Claims the paper makes
The claims and statistics of this paper haven’t been checked yet.
Run the check — free, no account needed. It reads the open-access text and checks the sources it cites.
Claims other papers make about this one
Each is checked against this paper’s own text: does it say what the citing paper says it does?
In the citing paper
“Muscle-specific inhibition of FoxOs protects from cancer cachexia-, fasting-, hindlimb suspension- or denervation-induced atrophy [16–18].”
From The connection between the dynamic remodeling of the mitochondrial network and the regulation of muscle mass (2021) · cites this paper as [17]
Self-check
Percentages, sums and reported differences re-computed from the paper’s own numbers.
The self-check needs the paper’s full text.
Citations
Cites
Subramanian, A., Tamayo, P., Mootha, V. K., Mukherjee, S., Ebert, B. L., Gillette, M. A., Paulovich, A., Pomeroy, S. L., Golub, T. R., Lander, E. S., et al. (2005) · Proceedings of the National Academy of Sciences · doi:10.1073/pnas.0506580102 · Cited by 53,625
Systematic and integrative analysis of large gene lists using DAVID bioinformatics resources
Huang, D. W., Sherman, B. T., & Lempicki, R. A. (2009) · Nature Protocols · doi:10.1038/nprot.2008.211 · Cited by 35,890
Huang, D. W., Sherman, B. T., & Lempicki, R. A. (2009) · Nucleic Acids Research · doi:10.1093/nar/gkn923 · Cited by 14,108
Bolstad, B. M., Irizarry, R. A., Åstrand, M., & Speed, T. P. (2003) · Bioinformatics · doi:10.1093/bioinformatics/19.2.185 · Cited by 8,328
Sandri, M., Sandri, C., Gilbert, A., Skurk, C., Calabria, E., Picard, A., Walsh, K., Schiaffino, S., Lecker, S. H., & Goldberg, A. L. (2004) · Cell · doi:10.1016/s0092-8674(04)00400-3 · Cited by 3,012
FoxO3 Controls Autophagy in Skeletal Muscle In Vivo
Mammucari, C., Milan, G., Romanello, V., Masiero, E., Rudolf, R., Del Piccolo, P., Burden, S. J., Di Lisi, R., Sandri, C., Zhao, J., et al. (2007) · Cell Metabolism · doi:10.1016/j.cmet.2007.11.001 · Cited by 1,953
Evolving gene/transcript definitions significantly alter the interpretation of GeneChip data
Dai, M. (2005) · Nucleic Acids Research · doi:10.1093/nar/gni179 · Cited by 1,807
Multiple types of skeletal muscle atrophy involve a common program of changes in gene expression
Lecker, S. H., Jagoe, R. T., Gilbert, A., Gomes, M., Baracos, V., Bailey, J., Price, S. R., Mitch, W. E., & Goldberg, A. L. (2004) · The FASEB Journal · doi:10.1096/fj.03-0610com · Cited by 1,539 · cited 1×
“Many of the upregulated genes identified as downstream targets of FoxO in muscles of C26 tumor-bearing mice are involved in protein degradation, and are coordinately upregulated during multiple wasting conditions [48-50].”
Zhao, J., Brault, J. J., Schild, A., Cao, P., Sandri, M., Schiaffino, S., Lecker, S. H., & Goldberg, A. L. (2007) · Cell Metabolism · doi:10.1016/j.cmet.2007.11.004 · Cited by 1,489
IKKβ/NF-κB Activation Causes Severe Muscle Wasting in Mice
Cai, D., Frantz, J. D., Tawa, N. E., Melendez, P. A., Oh, B.-C., Lidov, H. G. W., Hasselgren, P.-O., Frontera, W. R., Lee, J., Glass, D. J., et al. (2004) · Cell · doi:10.1016/j.cell.2004.09.027 · Cited by 1,367
Tisdale, M. J. (2009) · Physiological Reviews · doi:10.1152/physrev.00016.2008 · Cited by 1,216
Andreyev, J. N., Norman, A. R., Oates, J. R., & Cunningham, D. (1998) · European Journal of Cancer · doi:10.1016/s0959-8049(97)10090-9 · Cited by 797
Sacheck, J. M., Hyatt, J. K., Raffaello, A., Thomas Jagoe, R., Roy, R. R., Reggie Edgerton, V., Lecker, S. H., & Goldberg, A. L. (2007) · The FASEB Journal · doi:10.1096/fj.06-6604com · Cited by 585 · cited 1×
“Many of the upregulated genes identified as downstream targets of FoxO in muscles of C26 tumor-bearing mice are involved in protein degradation, and are coordinately upregulated during multiple wasting conditions [48-50].”
Production and purification of serotype 1, 2, and 5 recombinant adeno-associated viral vectors
Zolotukhin, S., Potter, M., Zolotukhin, I., Sakai, Y., Loiler, S., Fraites, T. J., Chiodo, V. A., Philipsberg, T., Muzyczka, N., Hauswirth, W. W., et al. (2002) · Methods · doi:10.1016/s1046-2023(02)00220-7 · Cited by 564
Involvement of Foxo transcription factors in angiogenesis and postnatal neovascularization
Potente, M., Urbich, C., Sasaki, K., Hofmann, W. K., Heeschen, C., Aicher, A., Kollipara, R., DePinho, R. A., Zeiher, A. M., & Dimmeler, S. (2005) · Journal of Clinical Investigation · doi:10.1172/jci23126 · Cited by 527
Collagen VI regulates satellite cell self-renewal and muscle regeneration
Urciuolo, A., Quarta, M., Morbidoni, V., Gattazzo, F., Molon, S., Grumati, P., Montemurro, F., Tedesco, F. S., Blaauw, B., Cossu, G., et al. (2013) · Nature Communications · doi:10.1038/ncomms2964 · Cited by 511
Jen, Y., Weintraub, H., & Benezra, R. (1992) · Genes & Development · doi:10.1101/gad.6.8.1466 · Cited by 471
BMP signaling controls muscle mass
Sartori, R., Schirwis, E., Blaauw, B., Bortolanza, S., Zhao, J., Enzo, E., Stantzou, A., Mouisel, E., Toniolo, L., Ferry, A., et al. (2013) · Nature Genetics · doi:10.1038/ng.2772 · Cited by 467
Bonetto, A., Aydogdu, T., Jin, X., Zhang, Z., Zhan, R., Puzis, L., Koniaris, L. G., & Zimmers, T. A. (2012) · American Journal of Physiology-Endocrinology and Metabolism · doi:10.1152/ajpendo.00039.2012 · Cited by 463
Cachexia Worsens Prognosis in Patients with Resectable Pancreatic Cancer
Bachmann, J., Heiligensetzer, M., Krakowski‐Roosen, H., Büchler, M. W., Friess, H., & Martignoni, M. E. (2008) · Journal of Gastrointestinal Surgery · doi:10.1007/s11605-008-0505-z · Cited by 429
A novel mechanism of gene regulation and tumor suppression by the transcription factor FKHR
Ramaswamy, S., Nakamura, N., Sansal, I., Bergeron, L., & Sellers, W. R. (2002) · Cancer Cell · doi:10.1016/s1535-6108(02)00086-7 · Cited by 428
Roberts, E. W., Deonarine, A., Jones, J. O., Denton, A. E., Feig, C., Lyons, S. K., Espéli, M., Kraman, M., McKenna, B., Wells, R. J. B., et al. (2013) · The Journal of Experimental Medicine · doi:10.1084/jem.20122344 · Cited by 428
Waddell, D. S., Baehr, L. M., van den Brandt, J., Johnsen, S. A., Reichardt, H. M., Furlow, J. D., & Bodine, S. C. (2008) · American Journal of Physiology-Endocrinology and Metabolism · doi:10.1152/ajpendo.00646.2007 · Cited by 368
NF-κB–mediated Pax7 dysregulation in the muscle microenvironment promotes cancer cachexia
He, W. A., Berardi, E., Cardillo, V. M., Acharyya, S., Aulino, P., Thomas-Ahner, J., Wang, J., Bloomston, M., Muscarella, P., Nau, P., et al. (2013) · Journal of Clinical Investigation · doi:10.1172/jci68523 · Cited by 357
Bonetto, A., Aydogdu, T., Kunzevitzky, N., Guttridge, D. C., Khuri, S., Koniaris, L. G., & Zimmers, T. A. (2011) · PLoS ONE · doi:10.1371/journal.pone.0022538 · Cited by 348
Acharyya, S., Butchbach, M. E. R., Sahenk, Z., Wang, H., Saji, M., Carathers, M., Ringel, M. D., Skipworth, R. J. E., Fearon, K. C. H., Hollingsworth, M. A., et al. (2005) · Cancer Cell · doi:10.1016/j.ccr.2005.10.004 · Cited by 323
Ablation of Cypher, a PDZ-LIM domain Z-line protein, causes a severe form of congenital myopathy
Zhou, Q., Chu, P., Huang, C., Cheng, C., Martone, M. E., Knoll, G., Shelton, G. D., Evans, S. Μ., & Chen, J. (2001) · The Journal of Cell Biology · doi:10.1083/jcb.200107092 · Cited by 283
Global analysis of gene expression patterns during disuse atrophy in rat skeletal muscle
Stevenson, E. J., Giresi, P. G., Koncarevic, A., & Kandarian, S. C. (2003) · The Journal of Physiology · doi:10.1111/j.1469-7793.2003.00033.x · Cited by 278
Self-citationCancer Cachexia: Mechanisms and Clinical Implications
Donohoe, C. L., Ryan, A. M., & Reynolds, J. V. (2011) · Gastroenterology Research and Practice · doi:10.1155/2011/601434 · Cited by 273
Efficient transduction of skeletal muscle using vectors based on adeno-associated virus serotype 6
Blankinship, M. J., Gregorevic, P., Allen, J. M., Harper, S. Q., Harper, H. A., Halbert, C. L., Miller, A. D., & Chamberlain, J. S. (2004) · Molecular Therapy · doi:10.1016/j.ymthe.2004.07.016 · Cited by 259
Reed, S. A., Sandesara, P. B., Judge, S. M., & Judge, A. R. (2011) · The FASEB Journal · doi:10.1096/fj.11-189977 · Cited by 231
Self-citationGlobal analysis of gene expression patterns during disuse atrophy in rat skeletal muscle
Stevenson, E. J., Giresi, P. G., Koncarevic, A., et al. (2003) · The Journal of Physiology · doi:10.1113/jphysiol.2003.044701 · Cited by 212
FOXO signaling is required for disuse muscle atrophy and is directly regulated by Hsp70
Judge, S. M., DODD, S. L., & Judge, A. R. (2009) · American Journal of Physiology-Cell Physiology · doi:10.1152/ajpcell.00315.2009 · Cited by 202
Self-citationMuscle Wasting and Impaired Myogenesis in Tumor Bearing Mice Are Prevented by ERK Inhibition
Penna, F., Costamagna, D., Fanzani, A., Bonelli, G., Baccino, F. M., & Costelli, P. (2010) · PLoS ONE · doi:10.1371/journal.pone.0013604 · Cited by 191
Frey, N., & Olson, E. N. (2002) · Journal of Biological Chemistry · doi:10.1074/jbc.m200712200 · Cited by 189
Inflammation Based Regulation of Cancer Cachexia
Onesti, J. K., & Guttridge, D. C. (2014) · BioMed Research International · doi:10.1155/2014/168407 · Cited by 157
Zou, Y., Zhang, R.-Z., Sabatelli, P., Chu, M.-L., & Bönnemann, C. G. (2008) · Journal of Neuropathology & Experimental Neurology · doi:10.1097/nen.0b013e3181634ef7 · Cited by 155
Smith, K., & Tisdale, M. (1993) · British Journal of Cancer · doi:10.1038/bjc.1993.126 · Cited by 149
C/EBPβ mediates tumour‐induced ubiquitin ligase atrogin1/MAFbx upregulation and muscle wasting
Zhang, G., Jin, B., & Li, Y. (2011) · The EMBO Journal · doi:10.1038/emboj.2011.292 · Cited by 144
HDAC1 activates FoxO and is both sufficient and required for skeletal muscle atrophy
Beharry, A. W., Sandesara, P. B., Roberts, B. M., Ferreira, L. F., Senf, S. M., & Judge, A. R. (2014) · Journal of Cell Science · doi:10.1242/jcs.136390 · Cited by 128
Self-citationSuzuki, H., Chiba, T., Kobayashi, M., Takeuchi, M., Suzuki, T., Ichiyama, A., Ikenoue, T., Omata, M., Furuichi, K., & Tanaka, K. (1999) · Biochemical and Biophysical Research Communications · doi:10.1006/bbrc.1999.0289 · Cited by 122
Judge, S. M., Sandesara, P. B., Reed, S. A., & Judge, A. R. (2011) · American Journal of Physiology-Cell Physiology · doi:10.1152/ajpcell.00255.2010 · Cited by 114
Self-citationDiaphragm and ventilatory dysfunction during cancer cachexia
Roberts, B. M., Ahn, B., Smuder, A. J., Al‐Rajhi, M., Gill, L., Beharry, A. W., Powers, S. K., Fuller, D. D., Ferreira, L. F., & Judge, A. R. (2013) · The FASEB Journal · doi:10.1096/fj.12-222844 · Cited by 111
Self-citationMechano-regulated Tenascin-C orchestrates muscle repair
Flück, M., Mund, S. I., Schittny, J. C., Klossner, S., Durieux, A., & Giraud, M. (2008) · Proceedings of the National Academy of Sciences · doi:10.1073/pnas.0805365105 · Cited by 100
Stiber, J. A., Zhang, Z.-S., Burch, J. L., Eu, J. P., Zhang, S., Truskey, G. A., Seth, M., Yamaguchi, N., Meissner, G., Shah, R. N., et al. (2008) · Molecular and Cellular Biology · doi:10.1128/mcb.01601-07 · Cited by 98
Cancer cachexia decreases specific force and accelerates fatigue in limb muscle
Roberts, B. M., Frye, G. S., Ahn, B., Ferreira, L. F., & Judge, A. R. (2013) · Biochemical and Biophysical Research Communications · doi:10.1016/j.bbrc.2013.05.018 · Cited by 89
Self-citationUsing GenePattern for Gene Expression Analysis
Kuehn, H., Liberzon, A., Reich, M. M., & Mesirov, J. P. (2008) · Current Protocols in Bioinformatics · doi:10.1002/0471250953.bi0712s22 · Cited by 85
Birkenkamp, K. U., Essafi, A., van der Vos, K. E., Costa, M. D., Hui, R. C.-Y., Holstege, F. C. P., Koenderman, L., Lam, E. W. ‐., & Coffer, P. J. (2006) · Journal of Biological Chemistry · doi:10.1074/jbc.m606669200 · Cited by 83
Effect of RNA oligonucleotide targeting Foxo-1 on muscle growth in normal and cancer cachexia mice
Cm, L., Yang, Z., Liu, C.-W., Wang, R., Tien, P., Dale, R., & Sun, L.-Q. (2007) · Cancer Gene Therapy · doi:10.1038/sj.cgt.7701091 · Cited by 83
Dellett, M., Hu, W., Papadaki, V., & Ohnuma, S. (2012) · Development Growth & Differentiation · doi:10.1111/j.1440-169x.2012.01339.x · Cited by 80
Foxo1 increases pro-inflammatory gene expression by inducing C/EBPβ in TNF-α-treated adipocytes
Ito, Y., Daitoku, H., & Fukamizu, A. (2008) · Biochemical and Biophysical Research Communications · doi:10.1016/j.bbrc.2008.11.043 · Cited by 78
Shum, A. M. Y., Mahendradatta, T., Taylor, R., Painter, A., Moore, M. M., Tsoli, M., Tan, T. C., Clarke, S. J., Robertson, G. R., & Polly, P. (2012) · Aging · doi:10.18632/aging.100436 · Cited by 77
Intrapleural Administration of AAV9 Improves Neural and Cardiorespiratory Function in Pompe Disease
Falk, D. J., Mah, C. S., Soustek, M. S., Lee, K., ElMallah, M. K., Cloutier, D. A., Fuller, D. D., & Byrne, B. J. (2013) · Molecular Therapy · doi:10.1038/mt.2013.96 · Cited by 72
A Direct HDAC4-MAP Kinase Crosstalk Activates Muscle Atrophy Program
Choi, M.-C., Cohen, T. J., Barrientos, T., Wang, B., Li, M., Simmons, B. J., Yang, J. S., Cox, G. A., Zhao, Y., & Yao, T. (2012) · Molecular Cell · doi:10.1016/j.molcel.2012.04.025 · Cited by 72
Long-term Skeletal Muscle Protection After Gene Transfer in a Mouse Model of LGMD-2D
Pacak, C. A., Walter, G. A., Gaidosh, G., Bryant, N. D., Lewis, M. A., Germain, S. A., Mah, C. S., Campbell, K. P., & Byrne, B. J. (2007) · Molecular Therapy · doi:10.1038/sj.mt.6300246 · Cited by 53
C26 Cancer-Induced Muscle Wasting Is IKKβ-Dependent and NF-kappaB-Independent
Cornwell, E. W., Mirbod, A., Wu, C., Kandarian, S. C., & Jackman, R. W. (2014) · PLoS ONE · doi:10.1371/journal.pone.0087776 · Cited by 42
Self-citationUbiquilin at a crossroads in protein degradation pathways
Rothenberg, C., & Monteiro, M. J. (2010) · Autophagy · doi:10.4161/auto.6.7.13118 · Cited by 40
Moore‐Carrasco, R., Garcia‐Martínez, C., Busquets, S., Ametller, E., Barreiro, E., López-Soriano, F. J., & Argilés, J. M. A. (2006) · FEBS Letters · doi:10.1016/j.febslet.2005.12.084 · Cited by 34
Skorokhod, A., Bachmann, J., Giese, N. A., Martignoni, M. E., & Krakowski‐Roosen, H. (2012) · BMC Cancer · doi:10.1186/1471-2407-12-265 · Cited by 27
Elevated nuclear Foxo1 suppresses excitability of skeletal muscle fibers
Hernández‐Ochoa, E. O., Schachter, T. N., & Schneider, M. F. (2013) · American Journal of Physiology-Cell Physiology · doi:10.1152/ajpcell.00003.2013 · Cited by 8
Research works printed but not linked: 1
- NCBI Gene Expression Omnibus. http://www.ncbi.nlm.nih.gov/geo/query/acc.cgi?token=cbafomemplujfgp&acc=GSE56555 ,
Cited by
Sorted by citations
Mitochondrial quality control and muscle mass maintenance.
Romanello, V., & Sandri, M. (2016) · Frontiers in Physiology · doi:10.3389/fphys.2015.00422 · Cited by 434
Cancer cachexia: molecular mechanisms and treatment strategies
Setiawan, T., Sari, I. N., Wijaya, Y. T., Julianto, N. M., Muhammad, J. A., Lee, H., Chae, J. H., & Kwon, H. Y. (2023) · Journal of Hematology & Oncology · doi:10.1186/s13045-023-01454-0 · Cited by 342
Skeletal Muscle Wasting and Renewal: A Pivotal Role of Myokine IL-6
Belizário, J. E., Fontes-Oliveira, C. C., Borges, J. P., Kashiabara, J. A., & Vannier, E. (2016) · SpringerPlus · doi:10.1186/s40064-016-2197-2 · Cited by 244
STAT3 in the systemic inflammation of cancer cachexia
Zimmers, T. A., Fishel, M. L., & Bonetto, A. (2016) · Seminars in Cell and Developmental Biology · doi:10.1016/j.semcdb.2016.02.009 · Cited by 231
Signaling Pathways That Control Muscle Mass
Vainshtein, A., & Sandri, M. (2020) · International Journal of Molecular Sciences · doi:10.3390/ijms21134759 · Cited by 222
Metadata
- Authors
- Judge, S. M., Wu, C.-L., Beharry, A. W., Roberts, B. M., Ferreira, L. F., Kandarian, S. C., & Judge, A. R.
- Affiliations
- University of Florida Health (US)
- Boston University (US)
- University of Florida (US)
- Corresponding author
- Judge, Andrew R
- Venue
- BMC Cancer
- Published
- 2014-12
- Volume
- 14
- Issue
- 1
- Pages
- 997-997
- ISSN
- 1471-2407 (ISSN-L)
- PMC
- PMC4391468
- OpenAlex
- W1564746483
- Cited by
- 111
- References
- 59
- Citations by year
- 2026: 7 · 2025: 8 · 2024: 8 · 2023: 14 · 2022: 2 · 2021: 14 · 2020: 20 · 2019: 12 · 2018: 8 · 2017: 5 · 2016: 9 · 2015: 3
- FWCI
- 2.32
- Type
- journal article
- Language
- en
- Open access
- gold
- doi.org
- Licence
- Locations
- BMC Cancer (publishedVersion, cc-by)
- PubMed Central (publishedVersion, cc-by)
- PubMed (publishedVersion)
- University of Florida Digital Collections (University of Florida) (submittedVersion)
- OpenBU (Boston University) (submittedVersion, cc-by)
- Funders
- National Heart, Lung, and Blood Institute (R00HL098453)
- National Institute of Arthritis and Musculoskeletal and Skin Diseases (R01AR060217, R01AR060209)
- Eunice Kennedy Shriver National Institute of Child Health and Human Development (T32HD043730)
- Topics
- Life Sciences › Biochemistry, Genetics and Molecular Biology › Molecular Biology › Muscle Physiology and Disorders
- Life Sciences › Biochemistry, Genetics and Molecular Biology › Molecular Biology › FOXO transcription factor regulation
- Health Sciences › Medicine › Physiology (medical) › Nutrition and Health in Aging
- Keywords
- FOXO transcription factors, cancer cachexia, skeletal muscle atrophy, C26 colon carcinoma, FOXO1, FOXO3, gene regulatory networks, muscle fiber atrophy, diaphragm, limb muscles, STAT3, FOS, CEBPB, UBR2, IL-6 signaling, proteasome pathway, extracellular matrix genes, sarcomere proteins
- MeSH terms
- Dependovirus, Amino Acid Sequence, Animals, Cachexia, Colonic Neoplasms, Disease Models, Animal, Extracellular Matrix, Gene Expression Regulation, Genetic Vectors, Humans, Male, Molecular Sequence Data, Transcription Factors, Transduction, Genetic, Reproducibility of Results, Sequence Alignment, Muscle, Skeletal, Gene Expression Profiling, Proteasome Endopeptidase Complex, Mice, Forkhead Transcription Factors, Gene Regulatory Networks, Genome-Wide Association Study, Heterografts
About these checks
Registry, retraction, Cites and statistics results are computed, not judged, with one exception: a printed reference that no index lists is read once by a model before it counts as a citation error. Claims are extracted by a model and kept only when their quote appears verbatim in the text; each cited source is then checked, with a model’s help, for whether it says what the claim relies on. Those verdicts can be wrong — read the claim’s quote and the cited source before relying on one.
Statistics and arithmetic are recomputed, not judged.
Confidence bands are shown only for fields calibrated on our annotated test set. None is calibrated yet, so no band is shown.
What counts as a claim ›How we measure confidence ›How we check this ›
Are you an author, or do you see a problem with this page? Request a review
