

The DOI matches its Crossref record; 72 of the 72 references it cites were found in a registry or an index.
M-CSF increases proliferation and phagocytosis while modulating receptor and transcription factor expression in adult human microglia
Open accessAbstract
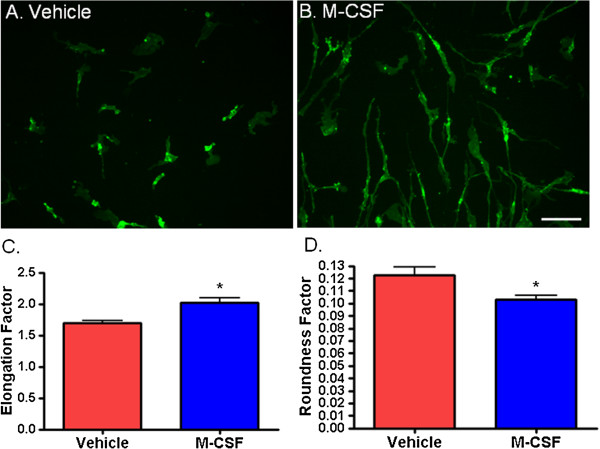
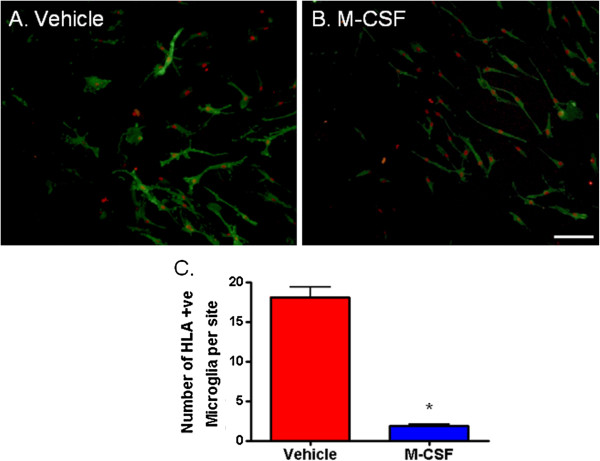
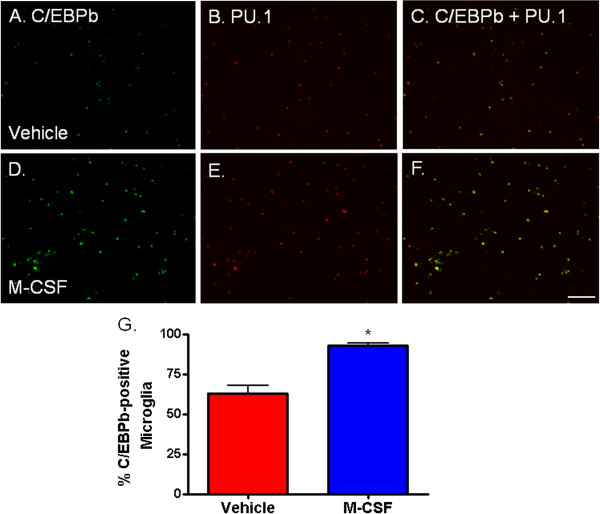
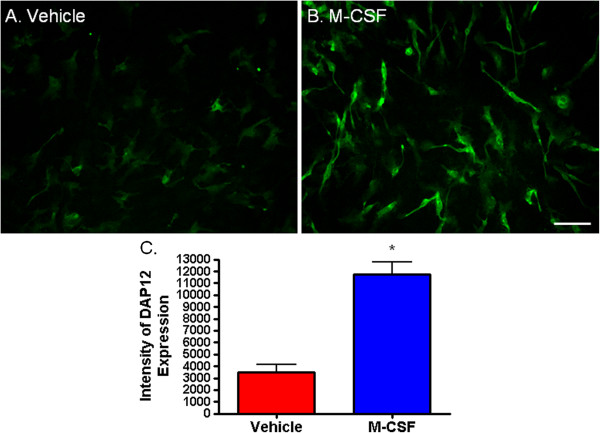
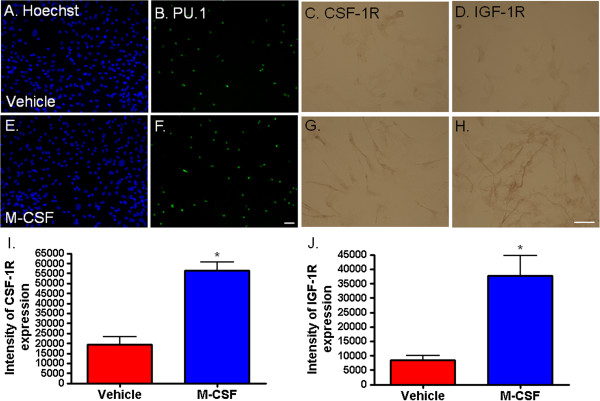
BACKGROUND: Microglia are the primary immune cells of the brain whose phenotype largely depends on their surrounding micro-environment. Microglia respond to a multitude of soluble molecules produced by a variety of brain cells. Macrophage colony-stimulating factor (M-CSF) is a cytokine found in the brain whose receptor is expressed by microglia. Previous studies suggest a critical role for M-CSF in brain development and normal functioning as well as in several disease processes involving neuroinflammation. METHODS: Using biopsy tissue from patients with intractable temporal epilepsy and autopsy tissue, we cultured primary adult human microglia to investigate their response to M-CSF. Mixed glial cultures were treated with 25 ng/ml M-CSF for 96 hours. Proliferation and phagocytosis assays, and high through-put immunocytochemistry, microscopy and image analysis were performed to investigate microglial phenotype and function. RESULTS: We found that the phenotype of primary adult human microglia was markedly changed following exposure to M-CSF. A greater number of microglia were present in the M-CSF- treated cultures as the percentage of proliferating (BrdU and Ki67-positive) microglia was greatly increased. A number of changes in protein expression occurred following M-CSF treatment, including increased transcription factors PU.1 and C/EBPβ, increased DAP12 adaptor protein, increased M-CSF receptor (CSF-1R) and IGF-1 receptor, and reduced HLA-DP, DQ, DR antigen presentation protein. Furthermore, a distinct morphological change was observed with elongation of microglial processes. These changes in phenotype were accompanied by a functional increase in phagocytosis of Aβ1-42 peptide. CONCLUSIONS: We show here that the cytokine M-CSF dramatically influences the phenotype of adult human microglia. These results pave the way for future investigation of M-CSF-related targets for human therapeutic benefit.
Overview
The claims and statistics of this paper haven’t been checked yet.
Run the check — free, no account needed. It reads the open-access text and checks the sources it cites.
Integrity signals
Registry
Cites
Statistics
Figures
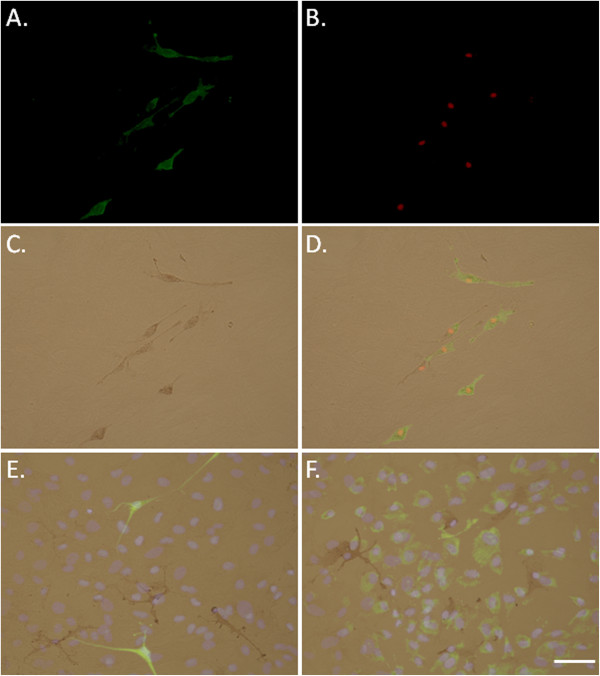
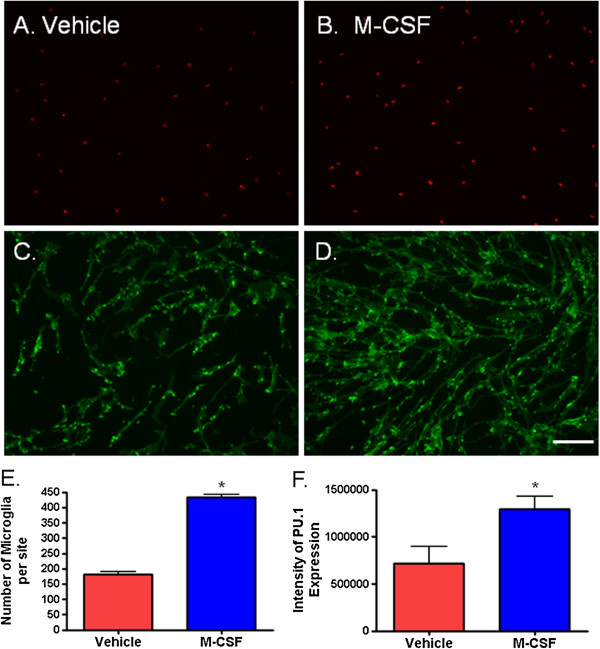
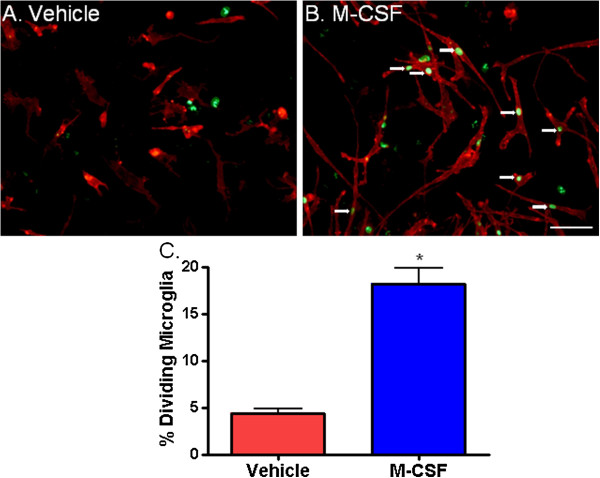
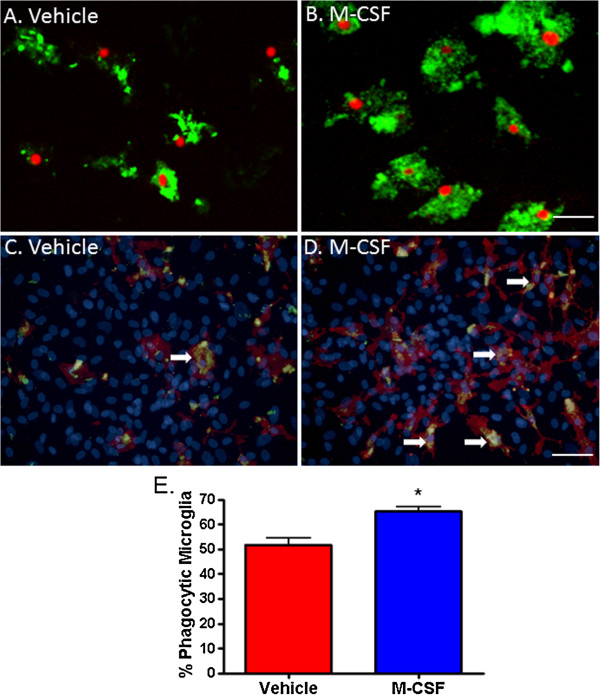
Verification
Claims the paper makes
The claims and statistics of this paper haven’t been checked yet.
Run the check — free, no account needed. It reads the open-access text and checks the sources it cites.
Claims other papers make about this one
Each is checked against this paper’s own text: does it say what the citing paper says it does?
In the citing paper
“However, the addition of key factors for microglial maintenance can hinder the interpretation of In vitro disease models, since factors such as CSF1 can promote microglia viability and increased PU.1 expression that can also influence microglial function in disease states [76].”
From Transcriptional and Epigenetic Regulation of Microglia in Health and Disease (2019) · cites this paper as [76]
In the citing paper
“Several groups have attempted different cell culture conditions to maintain homeostatic microglia signature and ramified morphology In vitro using a variety of cytokines, such as CSF1, GM-CSF, TGFβ, and IL-34 [73-76].”
From Transcriptional and Epigenetic Regulation of Microglia in Health and Disease (2019) · cites this paper as [76]
Self-check
Percentages, sums and reported differences re-computed from the paper’s own numbers.
The self-check needs the paper’s full text.
Citations
Cites
Fate Mapping Analysis Reveals That Adult Microglia Derive from Primitive Macrophages
Ginhoux, F., Greter, M., Leboeuf, M., Nandi, S., See, P., Gokhan, S., Mehler, M. F., Conway, S. J., Ng, L. G., Stanley, E. R., et al. (2010) · Science · doi:10.1126/science.1194637 · Cited by 5,175
Bard, F., Cannon, C., Barbour, R., Burke, R.-L., Games, D., Grajeda, H., Guido, T., Hu, K., Huang, J., Johnson-Wood, K., et al. (2000) · Nature Medicine · doi:10.1038/78682 · Cited by 2,012
CCAAT/enhancer-binding proteins: structure, function and regulation
Ramji, D. P., & Foka, P. (2002) · Biochemical Journal · doi:10.1042/bj20020508 · Cited by 1,404
Takahashi, K., Rochford, C. D. P., & Neumann, H. (2005) · The Journal of Experimental Medicine · doi:10.1084/jem.20041611 · Cited by 1,124
Microglial cell origin and phenotypes in health and disease
Saijo, K., & Glass, C. K. (2011) · Nature Reviews Immunology · doi:10.1038/nri3086 · Cited by 1,100
Tumor-Induced Tolerance and Immune Suppression Depend on the C/EBPβ Transcription Factor
Marigo, I., Bosio, E., Solito, S., Mesa, C., Fernández, A., Dolcetti, L., Ugel, S., Sonda, N., Bicciato, S., Falisi, E., et al. (2010) · Immunity · doi:10.1016/j.immuni.2010.05.010 · Cited by 854
Discovery of a Cytokine and Its Receptor by Functional Screening of the Extracellular Proteome
Lin, H., Lee, E., Hestir, K., Leo, C., Huang, M., Bosch, E., Halenbeck, R., Wu, G., Zhou, A. J., Behrens, D., et al. (2008) · Science · doi:10.1126/science.1154370 · Cited by 849
Ponomarev, E. D., Veremeyko, T., Barteneva, N., Krichevsky, A. M., & Weiner, H. L. (2011) · Nature Medicine · doi:10.1038/nm.2266 · Cited by 787
Graeber, M. B. (2010) · Science · doi:10.1126/science.1190929 · Cited by 608
Early and Progressive Accumulation of Reactive Microglia in the Huntington Disease Brain
Sapp, E., Kegel, K. B., D, N. A. M., Hashikawa, T., Uchiyama, Y., Tohyama, K., Bhide, P. G., Vonsattel, J., & DiFiglia, M. (2001) · Journal of Neuropathology & Experimental Neurology · doi:10.1093/jnen/60.2.161 · Cited by 558
Cited by
Sorted by citations
Emerging Roles for CSF-1 Receptor and its Ligands in the Nervous System
Chiţu, V., Gökhan, Ş., Nandi, S., Mehler, M. F., & Stanley, E. R. (2016) · Trends in Neurosciences · doi:10.1016/j.tins.2016.03.005 · Cited by 363
Microglia in Alzheimer Disease: Well-Known Targets and New Opportunities
Hemonnot, A.-L., Hua, J., Ulmann, L., & Hirbec, H. (2019) · Frontiers in Aging Neuroscience · doi:10.3389/fnagi.2019.00233 · Cited by 298
Smith, A. M., & Dragunow, M. (2014) · Trends in Neurosciences · doi:10.1016/j.tins.2013.12.001 · Cited by 256
Self-citationFunctional polarization of neuroglia: Implications in neuroinflammation and neurological disorders
Jha, M. K., Lee, W., & Suk, K. (2015) · Biochemical Pharmacology · doi:10.1016/j.bcp.2015.11.003 · Cited by 267
Microglial cell loss after ischemic stroke favors brain neutrophil accumulation
Otxoa-de-Amezaga, A., Miró-Mur, F., Pedragosa, J., Gallizioli, M., Justicia, C., Gaja-Capdevila, N., Ruíz-Jaen, F., Salas-Perdomo, A., Bosch, A., Calvo, M., et al. (2019) · Acta Neuropathologica · doi:10.1007/s00401-018-1954-4 · Cited by 258
Metadata
- Authors
- Smith, A. M., Gibbons, H. M., Oldfield, R. L., Bergin, P. M., Mee, E. W., Curtis, M. A., Faull, R. L. M., & Dragunow, M.
- Affiliations
- University of Auckland (NZ)
- Corresponding author
- Dragunow, Mike
- Venue
- Journal of Neuroinflammation
- Published
- 2013-07-17
- Volume
- 10
- Issue
- 1
- Pages
- 85-85
- ISSN
- 1742-2094 (ISSN-L)
- PMC
- PMC3729740
- OpenAlex
- W1973529716
- Cited by
- 107
- References
- 72
- Citations by year
- 2026: 2 · 2025: 14 · 2024: 10 · 2023: 7 · 2022: 7 · 2021: 10 · 2020: 7 · 2019: 8 · 2018: 10 · 2017: 6 · 2016: 7 · 2015: 7 · 2014: 9 · 2013: 3
- FWCI
- 4.86
- Type
- journal article
- Language
- en
- Open access
- gold
- doi.org
- Locations
- Journal of Neuroinflammation (publishedVersion, cc-by)
- Europe PMC (PubMed Central) (publishedVersion, cc-by)
- PubMed Central (publishedVersion, cc-by)
- PubMed (publishedVersion)
- Funders
- Tertiary Education Commission
- Hugh Green Foundation
- Neurological Foundation of New Zealand
- Health Research Council of New Zealand
- Topics
- Life Sciences › Neuroscience › Neurology › Neuroinflammation and Neurodegeneration Mechanisms
- Life Sciences › Neuroscience › Developmental Neuroscience › Neurogenesis and neuroplasticity mechanisms
- Life Sciences › Neuroscience › Cellular and Molecular Neuroscience › Neuroscience and Neuropharmacology Research
- Keywords
- macrophage colony-stimulating factor, microglia, microglial proliferation, phagocytosis, CSF-1 receptor, PU.1, C/EBPβ, DAP12, IGF-1 receptor, HLA antigen expression, microglial morphology, amyloid-beta, temporal lobe epilepsy, neuroinflammation, microglial phenotype
- MeSH terms
- Proto-Oncogene Protein Spi-1, Antimetabolites, Autopsy, Biopsy, Bromodeoxyuridine, Cells, Cultured, HLA Antigens, Humans, Image Processing, Computer-Assisted, Immunohistochemistry, Macrophage Activation, Membrane Proteins, Phagocytosis, Proto-Oncogene Proteins, Transcription Factors, Trans-Activators, Macrophage Colony-Stimulating Factor, Receptor, Macrophage Colony-Stimulating Factor, Microglia, Ki-67 Antigen, CCAAT-Enhancer-Binding Protein-beta, Adaptor Proteins, Signal Transducing, Cell Proliferation
About these checks
Registry, retraction, Cites and statistics results are computed, not judged, with one exception: a printed reference that no index lists is read once by a model before it counts as a citation error. Claims are extracted by a model and kept only when their quote appears verbatim in the text; each cited source is then checked, with a model’s help, for whether it says what the claim relies on. Those verdicts can be wrong — read the claim’s quote and the cited source before relying on one.
Statistics and arithmetic are recomputed, not judged.
Confidence bands are shown only for fields calibrated on our annotated test set. None is calibrated yet, so no band is shown.
What counts as a claim ›How we measure confidence ›How we check this ›
Are you an author, or do you see a problem with this page? Request a review
