

The DOI matches its Crossref record; 58 of the 58 references it cites were found in a registry or an index.
Macrophagic and microglial responses after focal traumatic brain injury in the female rat
Open accessAbstract
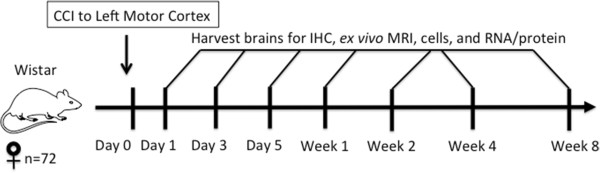
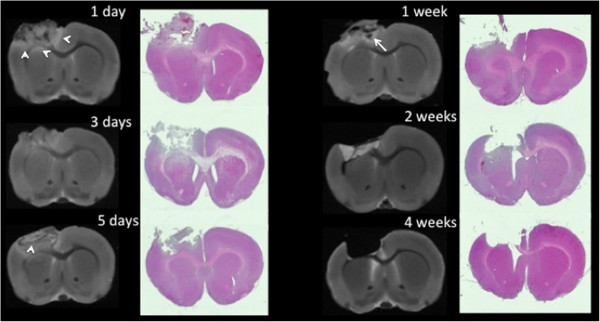
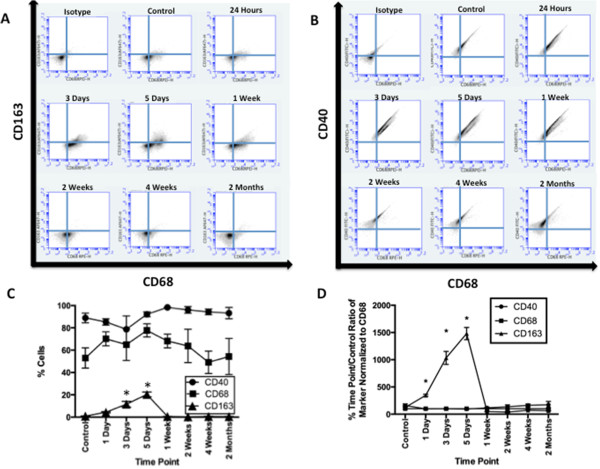
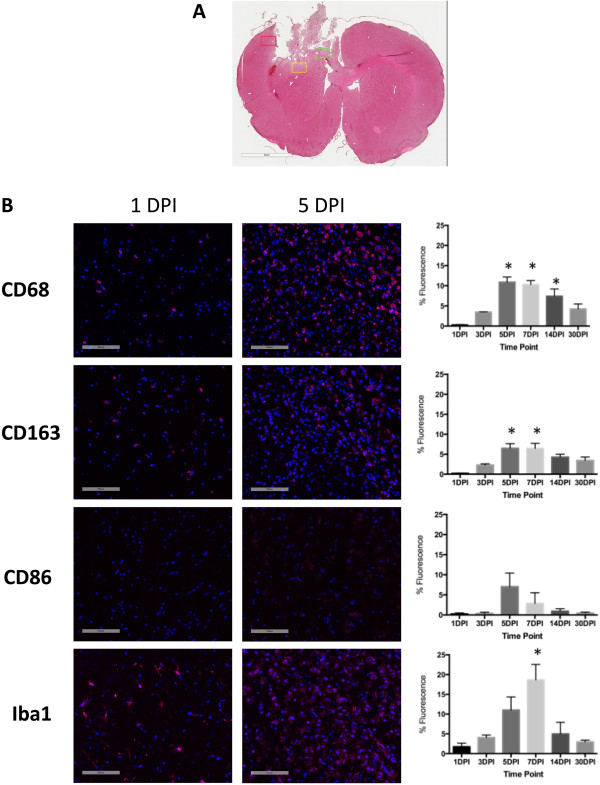
BACKGROUND: After central nervous system injury, inflammatory macrophages (M1) predominate over anti-inflammatory macrophages (M2). The temporal profile of M1/M2 phenotypes in macrophages and microglia after traumatic brain injury (TBI) in rats is unknown. We subjected female rats to severe controlled cortical impact (CCI) and examined the postinjury M1/M2 time course in their brains. METHODS: The motor cortex (2.5 mm left laterally and 1.0 mm anteriorly from the bregma) of anesthetized female Wistar rats (ages 8 to 10 weeks; N = 72) underwent histologically moderate to severe CCI with a 5-mm impactor tip. Separate cohorts of rats had their brains dissociated into cells for flow cytometry, perfusion-fixed for immunohistochemistry (IHC) and ex vivo magnetic resonance imaging or flash-frozen for RNA and protein analysis. For each analytical method used, separate postinjury times were included for 24 hours; 3 or 5 days; or 1, 2, 4 or 8 weeks. RESULTS: By IHC, we found that the macrophagic and microglial responses peaked at 5 to 7 days post-TBI with characteristics of mixed populations of M1 and M2 phenotypes. Upon flow cytometry examination of immunological cells isolated from brain tissue, we observed that peak M2-associated staining occurred at 5 days post-TBI. Chemokine analysis by multiplex assay showed statistically significant increases in macrophage inflammatory protein 1α and keratinocyte chemoattractant/growth-related oncogene on the ipsilateral side within the first 24 hours after injury relative to controls and to the contralateral side. Quantitative RT-PCR analysis demonstrated expression of both M1- and M2-associated markers, which peaked at 5 days post-TBI. CONCLUSIONS: The responses of macrophagic and microglial cells to histologically severe CCI in the female rat are maximal between days 3 and 7 postinjury. The response to injury is a mixture of M1 and M2 phenotypes.
Overview
The claims and statistics of this paper haven’t been checked yet.
Run the check — free, no account needed. It reads the open-access text and checks the sources it cites.
Integrity signals
Registry
Cites
Statistics
Figures
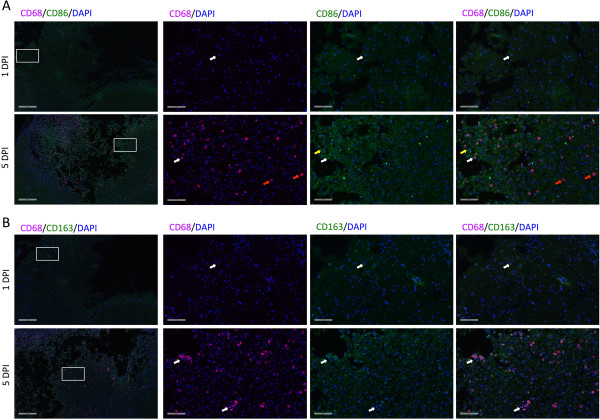
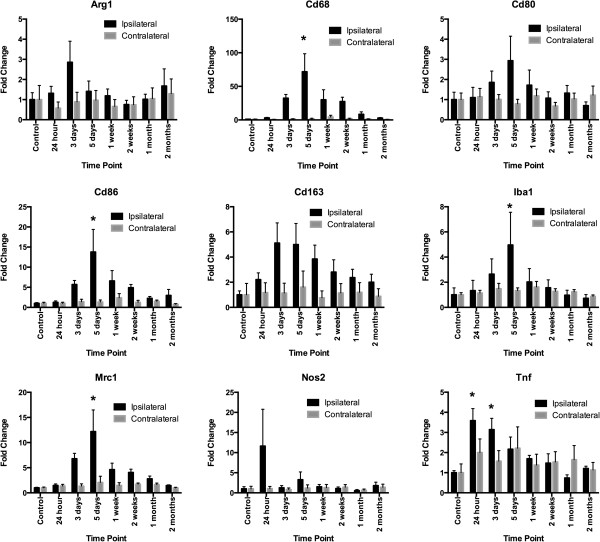
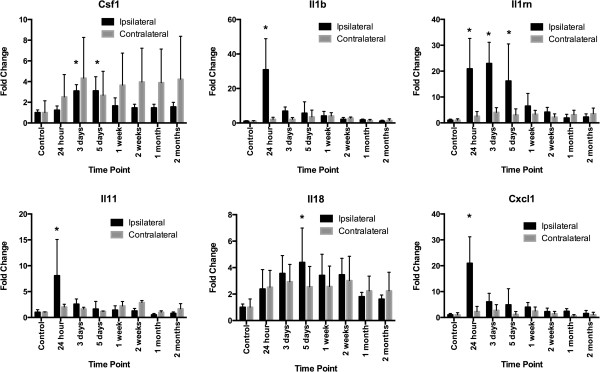
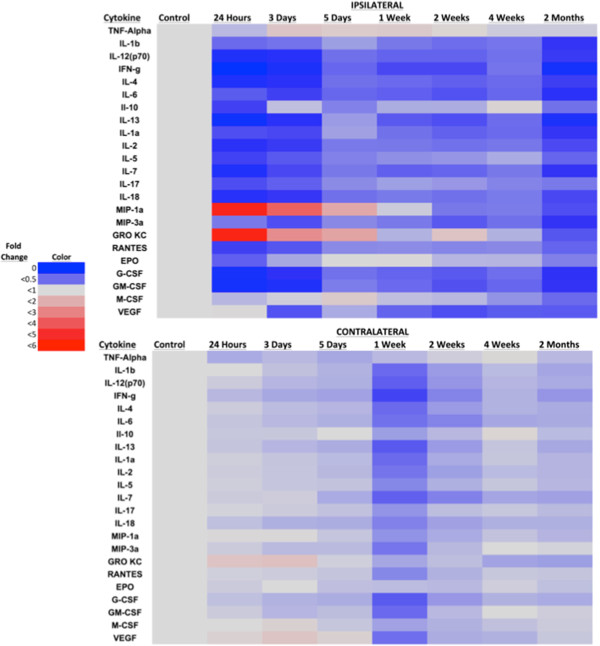
Verification
Claims the paper makes
The claims and statistics of this paper haven’t been checked yet.
Run the check — free, no account needed. It reads the open-access text and checks the sources it cites.
Claims other papers make about this one
Each is checked against this paper’s own text: does it say what the citing paper says it does?
In the citing paper
“In the initial week following injury, the microglia population adopts a balanced distribution between pro- and anti-inflammatory states to promote neurogenesis and enhance the immune response to injury [89,110,111].”
From Untangling senescent and damage‐associated microglia in the aging and diseased brain (2023) · cites this paper as [110]
Self-check
Percentages, sums and reported differences re-computed from the paper’s own numbers.
The self-check needs the paper’s full text.
Citations
Cites
The chemokine system in diverse forms of macrophage activation and polarization
MANTOVANI, A., SICA, A., SOZZANI, S., ALLAVENA, P., VECCHI, A., & LOCATI, M. (2004) · Trends in Immunology · doi:10.1016/j.it.2004.09.015 · Cited by 6,534
MANTOVANI, A., SOZZANI, S., LOCATI, M., ALLAVENA, P., & SICA, A. (2002) · Trends in Immunology · doi:10.1016/s1471-4906(02)02302-5 · Cited by 5,528
National Center for Injury Prevention and Control (U.S.). Division of Injury Response., Faul, M., Wald, M. M., Wu, L., & Coronado, V. G. (2010) · doi:10.15620/cdc.5571 · Cited by 3,494
Ding, A. H., Nathan, C., & Stuehr, D. J. (1988) · The Journal of Immunology · doi:10.4049/jimmunol.141.7.2407 · Cited by 2,840
Kigerl, K. A., Gensel, J. C., Ankeny, D. P., Alexander, J. K., Donnelly, D. J., & Popovich, P. G. (2009) · The Journal of Neuroscience · doi:10.1523/jneurosci.3257-09.2009 · Cited by 2,130
Stein, M., Keshav, S., Harris, N., & Gordon, S. (1992) · The Journal of experimental medicine · doi:10.1084/jem.176.1.287 · Cited by 1,960
Sica, A., Schioppa, T., Mantovani, A., & Allavena, P. (2006) · European Journal of Cancer · doi:10.1016/j.ejca.2006.01.003 · Cited by 1,483
Butcher, R. L., COLLINS, W. E., & FUGO, N. W. (1974) · Endocrinology · doi:10.1210/endo-94-6-1704 · Cited by 1,313
A controlled cortical impact model of traumatic brain injury in the rat
Edward Dixon, C., Clifton, G. L., Lighthall, J. W., Yaghmai, A. A., & Hayes, R. L. (1991) · Journal of Neuroscience Methods · doi:10.1016/0165-0270(91)90104-8 · Cited by 1,141
Donnelly, D. J., & Popovich, P. G. (2008) · Experimental Neurology · doi:10.1016/j.expneurol.2007.06.009 · Cited by 995
Cited by
Sorted by citations
Items 101–165 of 165
The contribution of the meningeal immune interface to neuroinflammation in traumatic brain injury
Mokbel, A. Y., Burns, M. P., & Main, B. S. (2024) · Journal of Neuroinflammation · doi:10.1186/s12974-024-03122-7 · Cited by 25
Barakat, R., & Redzic, Z. B. (2015) · Fluids and Barriers of the CNS · doi:10.1186/s12987-015-0002-1 · Cited by 22
Dickerson, M. R., Bailey, Z. S., Murphy, S. F., Urban, M. J., & VandeVord, P. J. (2020) · Frontiers in Neurology · doi:10.3389/fneur.2020.00618 · Cited by 23
Turtzo, L. C., Budde, M. D., Dean, D. D., Gold, E. M., Lewis, B. K., Janes, L. E., Lescher, J. D., Coppola, T., Yarnell, A. M., Grunberg, N. E., et al. (2015) · PLoS ONE · doi:10.1371/journal.pone.0126551 · Cited by 21
Self-citationHuang, A. P., Lai, D., Hsu, Y.-H., Kung, Y., Lan, C., Yeh, C.-S., Tsai, H.-H., Lin, C., & Chen, W. (2019) · Scientific Reports · doi:10.1038/s41598-019-52117-5 · Cited by 19
Inoue, M., Matsumoto, C., Nakajima, K., Kuroshima, S., & Sawase, T. (2021) · Bone · doi:10.1016/j.bone.2021.115942 · Cited by 19
Wang, A., Zhu, G., Qian, P., & Zhu, T. (2017) · Experimental and Therapeutic Medicine · doi:10.3892/etm.2017.4754 · Cited by 19
Controlled Cortical Impact in the Rat
Dean, D. D., Frank, J. A., & Turtzo, L. C. (2017) · Current Protocols in Neuroscience · doi:10.1002/cpns.37 · Cited by 18
Self-citationIrvine, K., Bishop, R. K., Won, S. J., Xu, J., Hamel, K. A., Coppes, V. G., Singh, P., Sondag, A., Rome, E., Basu, J., et al. (2017) · Journal of Neurotrauma · doi:10.1089/neu.2017.5044 · Cited by 17
Mao, L., Gao, W., Chen, S., Song, Y., Song, C., Zhou, Z., Zhao, H., Zhou, K., Wang, W., Zhu, K., et al. (2017) · Cell Death and Disease · doi:10.1038/cddis.2017.542 · Cited by 17
Adenosine A1 Receptor mRNA Expression by Neurons and Glia in the Auditory Forebrain
Hackett, T. A. (2018) · The Anatomical Record · doi:10.1002/ar.23907 · Cited by 17
Wang, S., Weyer, M.-P., Hummel, R., Wilken‐Schmitz, A., Tegeder, I., & Schäfer, M. K. E. (2024) · Journal of Neuroinflammation · doi:10.1186/s12974-024-03249-7 · Cited by 16
Characterization of Inflammation in Delayed Cortical Transplantation
Ballout, N., Rochelle, T., Brot, S., Bonnet, M., Francheteau, M., Prestoz, L., Zibara, K., & Gaillard, A. (2019) · Frontiers in Molecular Neuroscience · doi:10.3389/fnmol.2019.00160 · Cited by 14
Lv, M., Jiang, Y., Zhang, D., Yao, D., Cheng, Y., Zhang, W., & Zeng, Y. (2022) · European Journal of Neuroscience · doi:10.1111/ejn.15749 · Cited by 14
Lin, C., Lin, W., Su, Y.-C., Hsuan, Y. C.-Y., Chen, Y., Chang, C., Chou, W., & Lin, K. (2019) · Journal of the Formosan Medical Association · doi:10.1016/j.jfma.2019.01.008 · Cited by 14
Shin, H. E., Lee, W., Park, K., Yu, Y., Kim, G., Roh, E. J., Song, B. G., Jung, J.-H., Cho, K., Ha, Y.-H., et al. (2024) · Stem Cell Research & Therapy · doi:10.1186/s13287-024-03874-2 · Cited by 12
Yusuying, S., Yusuyin, S., & Cheng, X. (2021) · Neuroscience · doi:10.1016/j.neuroscience.2021.09.024 · Cited by 14
Li, J., Zhao, C., Rao, J., Yang, F.-X., Wang, Z., Lei, J., Yang, Z., & Li, X. (2017) · Neuroradiology · doi:10.1007/s00234-017-1915-y · Cited by 12
Zhao, J., Zhao, G., Lang, J., Sun, B., Feng, S., Li, D., & Sun, G. (2024) · Journal of Investigative Medicine · doi:10.1177/10815589241261293 · Cited by 11
Криштоп, В. В., Nikonorova, V. G., & Rumyantseva, T. А. (2019) · Journal of Anatomy and Histopathology · doi:10.18499/2225-7357-2019-8-4-22-29 · Cited by 11
Cao, Q., Gu, L., Wang, L., Sun, G., Ying, T., Su, H., Wang, W., & Sun, Z. (2024) · Journal of Applied Biomedicine · doi:10.32725/jab.2024.008 · Cited by 9
The potential of gene delivery for the treatment of traumatic brain injury
Dooley, J., Hughes, J. G., Needham, E., Palios, K. A., & Liston, A. (2024) · Journal of Neuroinflammation · doi:10.1186/s12974-024-03156-x · Cited by 9
Anderson, J., Patel, M., Forenzo, D., Ai, X., Cai, C., Wade, Q. W., Risman, R. A., & Cai, L. (2019) · Experimental Neurology · doi:10.1016/j.expneurol.2019.113119 · Cited by 10
Blood Biomarkers Predict Future Cognitive Decline after Military-Related Traumatic Brain Injury
Lippa, S. M., Gill, J., Brickell, T. A., Guedes, V. A., French, L. M., & Lange, R. T. (2022) · Current Alzheimer Research · doi:10.2174/1567205019666220330144432 · Cited by 8
Mild Traumatic Brain Injury Contributes to the Development of Delayed Neuroinflammation
Ponomarenko, A. I., Tyrtyshnaia, A. A., Ivashkevich, D., & Manzhulo, I. (2021) · NeuroImmunoModulation · doi:10.1159/000519011 · Cited by 8
The protective effects of statins in traumatic brain injury
Pordel, S., McCloskey, A. P., Almahmeed, W. A., & Sahebkar, A. (2024) · Pharmacological Reports · doi:10.1007/s43440-024-00582-9 · Cited by 7
Martín‐Segura, A., Casadomé‐Perales, Á., Fazzari, P., Mas, J. M., Artigas, L., Valls, R., Nebreda, Á. R., & Dotti, C. G. (2019) · Frontiers in Neurology · doi:10.3389/fneur.2019.00675 · Cited by 7
Turtzo, L. C., Chapagain, N. Y., Peterkin, N. L., Cota, M. R., Vorn, R., Devoto, C., O'Keefe, J., Emanuel, O. M., Parikh, G. Y., Diaz-Arrastia, R. R., et al. (2025) · Neurology · doi:10.1212/wnl.0000000000213448 · Cited by 5
Self-citationOuyang, L., Si, Z., Zheng, G., & Lu, G. (2016) · BioMed Research International · doi:10.1155/2016/8431987 · Cited by 5
Immune-Based Therapies for Traumatic Brain Injury: Insights from Pre-Clinical Studies
Machado, C. A., Silva, A. C. S. E., de Miranda, A. S., Cordeiro, T. M. E., Ferreira, R. N., de Souza, L. C., Teixeira, A. L., & de Miranda, A. S. (2019) · Current Medicinal Chemistry · doi:10.2174/0929867326666190710173234 · Cited by 5
Radenza, N., Mangione, R., Barbati, S. A., Bellia, F., Caruso, G., Belli, A., Lazzarino, G., Tavazzi, B., Lazzarino, G., Amorini, A. M., et al. (2025) · Frontiers in Neurology · doi:10.3389/fneur.2025.1667381 · Cited by 4
Vilela, W. R., Platt, N., Bechara, L. R. G., de Paula, G. C., Ferreira, J. C. B., de Oliveira, J., Duarte, J. M. N., & Bem, A. F. D. (2025) · Molecular Neurobiology · doi:10.1007/s12035-025-05455-7 · Cited by 4
Chu, E., Mychasiuk, R., Green, T. R. F., Zamani, A., Dill, L. K., Sharma, R., Raftery, A. L., Tsantikos, E., Hibbs, M. L., & Semple, B. D. (2023) · Frontiers in Neuroscience · doi:10.3389/fnins.2023.1276495 · Cited by 4
Role of Nanoparticles in Neurological Regeneration and Repair
Thangaleela, S., Suganya, T., Ali, A., Wang, C., Sivamaruthi, B. S., & Chaiyasut, C. (2025) · Nanotechnology in the life sciences · doi:10.1007/978-3-031-80185-3_5 · Cited by 4
Kurniawan, V. R., Islam, A. A., Adhimarta, W., Zainuddin, A. A., Widodo, D., NASRULLAH, N., Ihwan, A., Wahyudi, W., & Faruk, M. (2022) · Annals of Medicine and Surgery · doi:10.1016/j.amsu.2022.104399 · Cited by 5
Neonatal Rats Exhibit a Predominantly Anti-Inflammatory Response following Spinal Cord Injury
Sutherland, T. C., Ricafrente, A., Gomola, K., O’Brien, B. A., & Gorrie, C. A. (2021) · Developmental Neuroscience · doi:10.1159/000514612 · Cited by 4
Activation of Microglia and Astroglia in Unilateral Focal Traumatic Brain Injury in Rats
Genrikhs, E. E., Shedenkova, M. O., Воронков, Д. Н., Исаев, Н. К., & Stelmashook, E. V. (2024) · Bulletin of Experimental Biology and Medicine · doi:10.1007/s10517-025-06306-0 · Cited by 3
Distinct phenotypic expression levels of macrophages in neonatal lungs
Fang, S., Chen, J.-L., Chiu, M.-H., Huang, C.-C., Lin, M., & Lam, C.-F. (2021) · Experimental and Therapeutic Medicine · doi:10.3892/etm.2021.9800 · Cited by 4
Temporal and Spatial Patterns of Glial Activation After Unilateral Cortical Injury in Rats
Rich, K. K., Hjæresen, S., Andersen, M. S., Hansen, L. B., Mohammad, A. S., Gopinathan, N., Mogensen, T. C., Svenningsen, Å. F., & Zhang, M. (2026) · Life · doi:10.3390/life16010142 · Cited by 2
Xu, H., Wang, Q., Chen, X., Huang, Q., Xu, S., & Wu, Z. (2025) · Computational and Structural Biotechnology Journal · doi:10.1016/j.csbj.2025.08.019 · Cited by 2
Guignet, M. A., Schmuck, M., Harvey, D. J., Nguyen, D. V., Bruun, D. A., Echeverri, A., Gurkoff, G. G., & Lein, P. J. (2023) · Heliyon · doi:10.1016/j.heliyon.2023.e13449 · Cited by 3
Hutchinson, E. B., Osting, S., Rutecki, P. A., & Sutula, T. P. (2021) · Journal of Neuropathology & Experimental Neurology · doi:10.1093/jnen/nlab123 · Cited by 2
Roy, P. M. D., Cuba, J., Milligan, K., Shi, W., Wang, D., & LaPlaca, M. C. (2025) · Neurotrauma Reports · doi:10.1177/2689288x251377030 · Cited by 1
Carey, S. D., Gibbons, A. J., Craig, J. A., Zhoba, H. B., Babb, J. A., Kaplan, G. B., & Zielinski, M. R. (2025) · Neuroscience · doi:10.1016/j.neuroscience.2025.12.057 · Cited by 1
Taylor, M. A., Boland, R., Houle, S., Tapp, Z. M., Davis, A. C., Cotter, C., Sheridan, J. F., Godbout, J., & Kokiko‐Cochran, O. N. (2026) · Frontiers in Immunology · doi:10.3389/fimmu.2025.1689773 · Cited by 1
Криштоп, В. В., Rumyantseva, T. А., & Nikonorova, V. G. (2021) · Journal of Anatomy and Histopathology · doi:10.18499/2225-7357-2020-9-4-45-54 · Cited by 1
Editorial: Traumatic Brain Injury: From Bench to Bedside
de Miranda, A. S., de Souza, L. C., & Teixeira, A. L. (2019) · Frontiers in Neurology · doi:10.3389/fneur.2019.01214 · Cited by 1
Neuroinflammation and psychosis; antipsychotic medication.
Bloomfield, P. S. (2015) · Spiral (Imperial College London) · doi:10.25560/39588
Interleukin 33 Initiates CNS Inflammation Following Traumatic Injury
Gadani, S. P. (2016) · doi:10.18130/v3xw3s
Lam, D. (2017) · TSpace (University of Toronto)
Engineering Cytokine and Macrophage Enrichment at Sites of Injury
Enam, S. F. (2019)
Gao, W., Jin, W., Xu, X. J., Yin, D., Zhou, S., Li, F., Zhou, Z., & Zhang, J. (2021) · Research Square · doi:10.21203/rs.3.rs-898507/v1
Nyanzu, M. K., Sun, Z., Siaw-Debrah, F., Zhang, Y., Zhu, X., Yang, S., Ni, H., Lin, X., Zhuge, Q., & Huang, L. (2022) · SCIREA journal of biology. · doi:10.54647/biology18214
Inahara, Y., Otaki, R., Kajiwara, R., Kamiya, K., Kobayashi, M., Kumagaw, T., Shijo, K., Moro, N., Ikeda, T., Maeda, T., et al. (2023) · Journal of Nihon University Medical Association · doi:10.4264/numa.82.4_227
Gold, L., Barci, E., Brendel, M., Orth, M., Cheng, J., Kirchleitner, S. V., Bartos, L. M., Pötter, D., Kirchner, M. A., Unterrainer, L. M., et al. (2024) · Biomedicines · doi:10.3390/biomedicines12010188 · Cited by 1
Rao, R., & Babu, P. P. (2025) · SSRN Electronic Journal · doi:10.2139/ssrn.5137707
Lindblad, C., Pin, E., Just, D., Nimer, F. A., Nilsson, P., Bellander, B.-M., Svensson, M. A., 50, F. P. 4., & Thelin, E. P. (2021) · Figshare · doi:10.6084/m9.figshare.14211648
Lindblad, C., Pin, E., Just, D., Nimer, F. A., Nilsson, P., Bellander, B.-M., Svensson, M. A., 50, F. P. 4., & Thelin, E. P. (2021) · Figshare · doi:10.6084/m9.figshare.14211651
Roy, A., Millen, K. J., & Kapur, R. P. (2020) · Figshare · doi:10.6084/m9.figshare.12171903
Danelon, V., Garrett-Thomson, S. C., Morano, N. C., Constanza, R., Kermani, P., Smith, R. S., Almo, S. C., Lee, F. S., & Hempstead, B. L. (2025) · bioRxiv (Cold Spring Harbor Laboratory) · doi:10.64898/2025.12.30.697078
Temporal Dynamics of Neuroinflammation after Cortical Injury in Mice
Manzhulo, I., Tyrtyshnaia, A. A., Avgustinovich, F. K., Manzhulo, O. S., Gromova, E., & Ivashkevich, D. (2025) · Neurochemical Journal · doi:10.1134/s1819712425700862
赵, 威. (2026) · Journal of Clinical Personalized Medicine · doi:10.12677/jcpm.2026.51092
Jafarabadi, F., Datta, M., & Holland, M. A. (2026) · Biomechanics and Modeling in Mechanobiology · doi:10.1007/s10237-026-02074-6
Bjørnholm, K. D., Li, H., Gaudio, F. D., Mocci, G., Shao, W., Baldisseri, E., Rao, S. B., Lindblad, C., Fletcher‐Sandersjöö, A., Vázquez-Liébanas, E., et al. (2026) · Nature Communications · doi:10.1038/s41467-026-75367-0
Metadata
- Authors
- Turtzo, L., Lescher, J., Janes, L., Dean, D. D., Budde, M. D., & Frank, J. A.
- Affiliations
- Uniformed Services University of the Health Sciences (US)
- National Institutes of Health (US)
- Corresponding author
- Turtzo, L
- Venue
- Journal of Neuroinflammation
- Published
- 2014
- Volume
- 11
- Issue
- 1
- Pages
- 82
- ISSN
- 1742-2094 (ISSN-L)
- PMC
- PMC4022366
- OpenAlex
- W2157968665
- Cited by
- 167
- References
- 58
- Citations by year
- 2026: 5 · 2025: 11 · 2024: 9 · 2023: 6 · 2022: 8 · 2021: 16 · 2020: 16 · 2019: 20 · 2018: 12 · 2017: 24 · 2016: 16 · 2015: 20 · 2014: 3
- FWCI
- 13.69
- Type
- journal article
- Language
- en
- Open access
- gold
- doi.org
- Licence
- cc-by
- Locations
- Journal of Neuroinflammation (publishedVersion, cc-by)
- Europe PMC (PubMed Central) (publishedVersion, cc-by)
- PubMed Central (publishedVersion, cc-by)
- PubMed (publishedVersion)
- Funders
- U.S. Department of Defense
- Henry M. Jackson Foundation
- National Institutes of Health
- U.S. Public Health Service (01-60855)
- Center for Neuroscience and Regenerative Medicine (60855)
- Topics
- Health Sciences › Medicine › Clinical Neurology › Traumatic Brain Injury and Neurovascular Disturbances
- Life Sciences › Neuroscience › Neurology › Neuroinflammation and Neurodegeneration Mechanisms
- Health Sciences › Medicine › Clinical Neurology › Traumatic Brain Injury Research
- Keywords
- traumatic brain injury, macrophage polarization, M1/M2 macrophages, microglia, controlled cortical impact, female rats, neuroinflammation, chemokines, CCL17, CCL22, motor cortex
- MeSH terms
- Analysis of Variance, Animals, Brain, Brain Injuries, Calcium-Binding Proteins, Disease Models, Animal, Female, Flow Cytometry, Gene Expression Regulation, Macrophages, Magnetic Resonance Imaging, Microfilament Proteins, Microscopy, Fluorescence, Time Factors, Cytokines, Rats, Wistar, Microglia, Rats
About these checks
Registry, retraction, Cites and statistics results are computed, not judged, with one exception: a printed reference that no index lists is read once by a model before it counts as a citation error. Claims are extracted by a model and kept only when their quote appears verbatim in the text; each cited source is then checked, with a model’s help, for whether it says what the claim relies on. Those verdicts can be wrong — read the claim’s quote and the cited source before relying on one.
Statistics and arithmetic are recomputed, not judged.
Confidence bands are shown only for fields calibrated on our annotated test set. None is calibrated yet, so no band is shown.
What counts as a claim ›How we measure confidence ›How we check this ›
Are you an author, or do you see a problem with this page? Request a review
