

The DOI matches its Crossref record; 83 of the 85 references it cites were found in a registry or an index.
CD200-CD200R dysfunction exacerbates microglial activation and dopaminergic neurodegeneration in a rat model of Parkinson's disease
Open accessAbstract
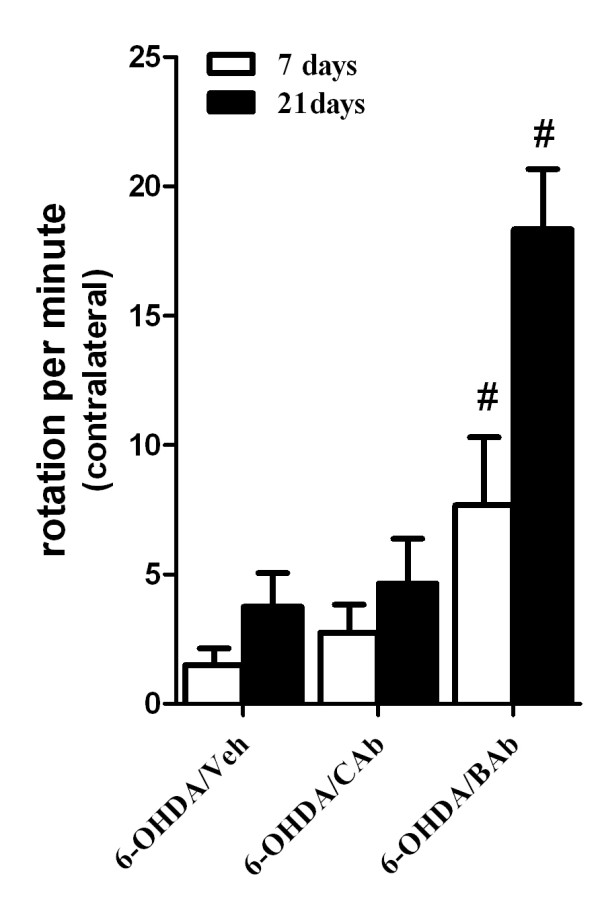
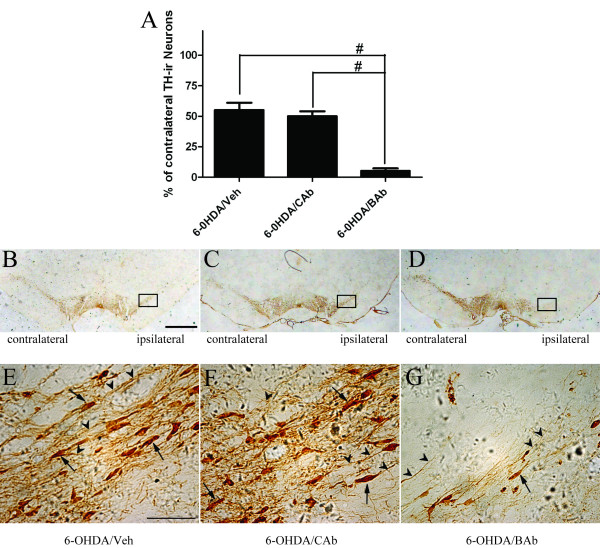
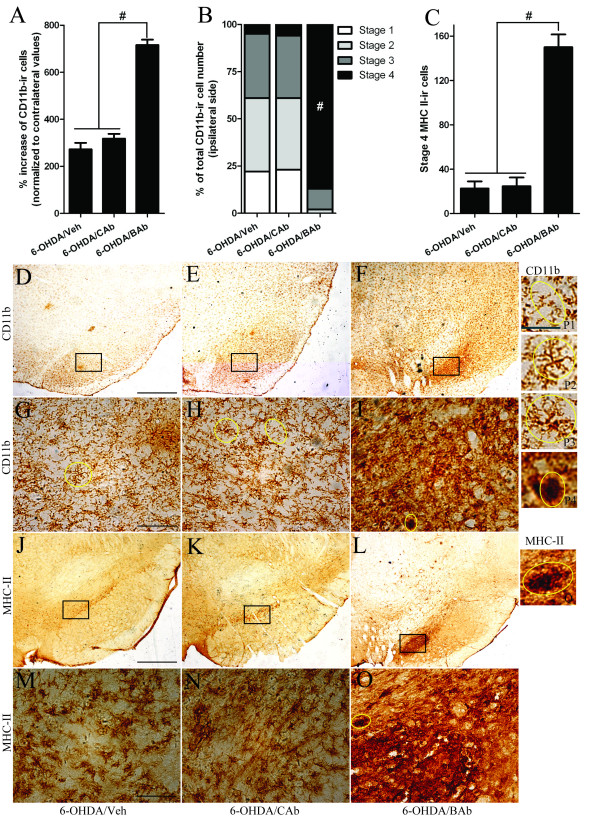
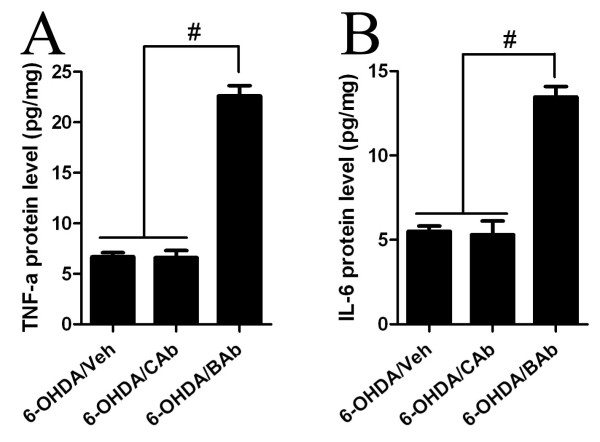
BACKGROUND: Increasing evidence suggests that microglial activation may participate in the aetiology and pathogenesis of Parkinson's disease (PD). CD200-CD200R signalling has been shown to be critical for restraining microglial activation. We have previously shown that expression of CD200R in monocyte-derived macrophages, induced by various stimuli, is impaired in PD patients, implying an intrinsic abnormality of CD200-CD200R signalling in PD brain. Thus, further in vivo evidence is needed to elucidate the role of malfunction of CD200-CD200R signalling in the pathogenesis of PD. METHODS: 6-hydroxydopamine (6-OHDA)-lesioned rats were used as an animal model of PD. CD200R-blocking antibody (BAb) was injected into striatum to block the engagement of CD200 and CD200R. The animals were divided into three groups, which were treated with 6-OHDA/Veh (PBS), 6-OHDA/CAb (isotype control antibody) or 6-OHDA/BAb, respectively. Rotational tests and immunohistochemistry were employed to evaluate motor deficits and dopaminergic neurodegeneration in animals from each group. HPLC analysis was used to measure monoamine levels in striatum. Morphological analysis and quantification of CD11b- (or MHC II-) immunoreactive cells were performed to investigate microglial activation and possible neuroinflammation in the substantia nigra (SN). Finally, ELISA was employed to assay protein levels of proinflammatory cytokines. RESULTS: Compared with 6-OHDA/CAb or 6-OHDA/Veh groups, rats treated with 6-OHDA/BAb showed a significant increase in counts of contralateral rotation and a significant decrease in TH-immunoreactive (TH-ir) neurons in SN. A marked decrease in monoamine levels was also detected in 6-OHDA/BAb-treated rats, in comparison to 6-OHDA/Veh-treated ones. Furthermore, remarkably increased activation of microglia as well as up-regulation of proinflammatory cytokines was found concomitant with dopaminergic neurodegeneration in 6-OHDA/BAb-treated rats. CONCLUSIONS: This study shows that deficits in the CD200-CD200R system exacerbate microglial activation and dopaminergic neurodegeneration in a 6-OHDA-induced rat model of PD. Our results suggest that dysfunction of CD200-CD200R signalling may be involved in the aetiopathogenesis of PD.
Overview
The claims and statistics of this paper haven’t been checked yet.
Run the check — free, no account needed. It reads the open-access text and checks the sources it cites.
Integrity signals
Registry
Cites
Statistics
Figures
Verification
Claims the paper makes
The claims and statistics of this paper haven’t been checked yet.
Run the check — free, no account needed. It reads the open-access text and checks the sources it cites.
Claims other papers make about this one
Each is checked against this paper’s own text: does it say what the citing paper says it does?
In the citing paper
“In rat PD models, both deficiency CX3CL1 or CX3CR1 as well as the dysfunction of CD200-CD200R signaling have been shown to increase microglial activation and the degeneration of DA neurons (Wang et al., 2011; Zhang et al., 2011).”
From The role of microglia in retinal neurodegeneration: Alzheimer’s disease, parkinson, and glaucoma. (2017) · cites this paper as Zhang et al., 2011
Self-check
Percentages, sums and reported differences re-computed from the paper’s own numbers.
The self-check needs the paper’s full text.
Citations
Cites
PROTEIN MEASUREMENT WITH THE FOLIN PHENOL REAGENT
Lowry, O. H., Rosebrough, N., Farr, A. L., & Randall, R. (1951) · Journal of Biological Chemistry · doi:10.1016/s0021-9258(19)52451-6 · Cited by 316,394 · cited 2×
“The protein contents were determined in pellet fractions by the method described by Lowry [45], and expressed as ng/g wet weight of tissue (ng/g WW).”
MethodStaging of brain pathology related to sporadic Parkinson’s disease
Braak, H., Tredici, K. D., Rüb, U., de Vos, R. A. I., Jansen Steur, E. N. H., & Braak, E. (2003) · Neurobiology of Aging · doi:10.1016/s0197-4580(02)00065-9 · Cited by 10,777 · cited 1×
“Parkinson’s disease (PD) is the second most common neurodegenerative disease in the world, and is characterized by dopaminergic neuron loss in the substantia nigra pars compacta (SNpc) [1].”
BackgroundMicroglia: a sensor for pathological events in the CNS
Kreutzberg, G. W. (1996) · Trends in Neurosciences · doi:10.1016/0166-2236(96)10049-7 · Cited by 4,396 · cited 7×
“Kyrkanides S, O’Banion MK, Whiteley PE, Daeschner JC, Olschowka JA: Enhanced glial activation and expression of specific CNS inflammationrelated molecules in aged versus young rats following cortical stab injury.”
BackgroundMethodInfluentialWest, M. J., Slomianka, L., & Gundersen, H. J. G. (1991) · The Anatomical Record · doi:10.1002/ar.1092310411 · Cited by 2,994 · cited 1×
“Unbiased stereological estimates of DA (TH-positive cell) neuron numbers were performed using StereoInvestigator analysis software (MicroBrightField, Williston, VT), combined with a Nikon Eclipse E600 microscope, and the optical fractionator method according to previously published reports [42,43].”
MethodMcGeer, P. L., Itagaki, S., Boyes, B. E., & McGeer, E. G. (1988) · Neurology · doi:10.1212/wnl.38.8.1285 · Cited by 2,990 · cited 2×
“Molecules related to neuroinflammation, such as tumor necrosis factor-alpha (TNF-a), IL-6, IL-1b, interferongamma (IFN-g), and superoxide, have been found colocalized with microglia in brain, and in cerebrospinal fluid and serum of PD patients as well [6,7,14-22].”
BackgroundUngerstedt, U., & Arbuthnott, G. W. (1970) · Brain Research · doi:10.1016/0006-8993(70)90187-3 · Cited by 1,995 · cited 1×
“Rotational behaviour was tested in rotometer bowls [47].”
MethodNeuroinflammation in Parkinson’s disease: A target for neuroprotection?
Hirsch, E. C., & Hunot, S. (2009) · The Lancet Neurology · doi:10.1016/s1474-4422(09)70062-6 · Cited by 1,984 · cited 1×
“To further confirm a relationship between CD200CD200R signalling and neuroinflammation in PD, we assayed several molecules that would be secreted by activated microglia in the proinflammatory stage [10,55-59].”
MethodThe role of inflammation in CNS injury and disease
Lucas, S., Rothwell, N. J., & Gibson, R. M. (2006) · British Journal of Pharmacology · doi:10.1038/sj.bjp.0706400 · Cited by 1,272 · cited 1×
“To further confirm a relationship between CD200CD200R signalling and neuroinflammation in PD, we assayed several molecules that would be secreted by activated microglia in the proinflammatory stage [10,55-59].”
MethodIn vivo imaging of microglial activation with [11C](R)-PK11195 PET in idiopathic Parkinson's disease
Gerhard, A., Pavese, N., Hotton, G., Turkheimer, F., Es, M., Hammers, A., Eggert, K., Oertel, W., Banati, R. B., & Brooks, D. J. (2006) · Neurobiology of Disease · doi:10.1016/j.nbd.2005.08.002 · Cited by 1,200 · cited 1×
“Activated microglia are found in the SN of mesencephalon in the brain of PD patients [5-8] and of parkinsonian animal models [9-13].”
BackgroundDown-Regulation of the Macrophage Lineage Through Interaction with OX2 (CD200)
Hoek, R. M., Ruuls, S. R., Murphy, C. A., Wright, G. J., Goddard, R., Zurawski, S. M., Blom, B., Homola, M. E., Streit, W. J., Brown, M. H., et al. (2000) · Science · doi:10.1126/science.290.5497.1768 · Cited by 1,022 · cited 7×
“In addition, preventing CD200CD200R interactions with CD200R-blocking antibodies also induces augmented microglial activation in EAE rats [32,33].”
BackgroundInfluential
Cited by
Sorted by citations
Items 101–154 of 154
Bal‐Price, A., Leist, M., Schildknecht, S., Monnet‐Tschudi, F., Paini, A., & Terron, A. (2018) · OECD series on adverse outcome pathways · doi:10.1787/b46c3c00-en · Cited by 22
Ultrasound and neuroinflammation: immune modulation via the heat shock response
Seasons, G. M., Pellow, C., Kuipers, H. F., & Pike, G. B. (2024) · Theranostics · doi:10.7150/thno.96270 · Cited by 19
“Due to its anti-inflammatory function, and dysregulation in inflammation [40,100– 103], targeting CD200 has been proposed as a potential treatment for neurodegenerative diseases.”
BackgroundRabaneda‐Lombarte, N., Vidal-Taboada, J. M., Valente, T., Ezquerra, M., Fernández‐Santiago, R., Martı́, M. J., Compta, Y., Saura, J., & Solà, C. (2022) · npj Parkinson s Disease · doi:10.1038/s41531-022-00290-2 · Cited by 19
Wang, L., Gong, X., Liu, Y., Du, T., Zhang, Z., Zhang, T., & Wang, X. (2020) · Glia · doi:10.1002/glia.23811 · Cited by 15
“As a result, in a PD model of 6-hydroxydopamie (6-OHDA) lesions, a CD200R-blocking antibody significantly promoted behavioral deficits and a decrease in DA neurons in the SN, which were accompanied by an increase in microglia activation and cytokine release (S. Zhang et al., 2011).”
BackgroundSelf-citationSingh, V., Kushwaha, S., Ansari, J. A., Gangopadhyay, S., Mishra, S. K., Dey, R. K., Giri, A. K., Patnaik, S., & Ghosh, D. (2021) · Journal of Biological Chemistry · doi:10.1016/j.jbc.2021.101521 · Cited by 14
“MPTP and 6-OHDA-induced models of Parkinson’s disease show decreased CD200R1 expression, higher microglial activation, and increased TNF-α and IL-1β secretion with progressive degeneration of dopaminergic neurons (12, 13).”
BackgroundPranski, E. L., Dalal, N. V., Sanford, C. V., Herskowitz, J. H., Gearing, M., Lazo, C. R., Miller, G. W., Lah, J. J., Levey, A. I., & Betarbet, R. S. (2013) · Neurobiology of Disease · doi:10.1016/j.nbd.2012.12.018 · Cited by 14
Kang, X., Tian, J., Shu, Q., Cheng, T., Wang, S., & Hu, Y. (2025) · Neuroscience · doi:10.1016/j.neuroscience.2025.07.019 · Cited by 12
“Disruption of this interaction triggers microglial activation, promoting pro-inflammatory responses that exacerbate disease pathology (Sun et al., 2020; Zhang et al., 2011).”
The interplay between monocytes, α-synuclein and LRRK2 in Parkinson's disease
Strader, S., & West, A. B. (2023) · Biochemical Society Transactions · doi:10.1042/bst20201091 · Cited by 13
Simchovitz, A., Soreq, L., & Soreq, H. (2015) · Current Opinion in Pharmacology · doi:10.1016/j.coph.2015.10.007 · Cited by 12
Jensen, S. K., & Yong, V. W. (2014) · Clinical and Experimental Neuroimmunology · doi:10.1111/cen3.12093 · Cited by 14
Augusto‐Oliveira, M., Tremblay, M., & Verkhratsky, A. (2024) · Advances in neurobiology · doi:10.1007/978-3-031-55529-9_6 · Cited by 10
Tissue-specific features of microglial innate immune responses
Timmerman, R., Burm, S. M., & Bajramovic, J. J. (2020) · Neurochemistry International · doi:10.1016/j.neuint.2020.104924 · Cited by 10
Tang, Y., & Le, W. (2014) · Springer eBooks · doi:10.1007/978-3-319-08046-8_4 · Cited by 10
“CD200–CD200R [ 113 – 115 ]”
Mousavinezhad-Moghaddam, M., Amin, A. A., Rafatpanah, H., & Rezaee, S. A. (2016) · Europe PMC (PubMed Central) · Cited by 9
The regulation of NFKB1 on CD200R1 expression and their potential roles in Parkinson’s disease
Lin, S., Shu, Y., Shen, R., Zhou, Y., Pan, H., He, L., Fang, F., Zhu, X., Wang, X., Wang, Y., et al. (2024) · Journal of Neuroinflammation · doi:10.1186/s12974-024-03231-3 · Cited by 9
“These biochemical and histological changes could be exacerbated by blocking CD200R1 in rats with peripheral lipopolysaccharide (LPS) treatment [14] and our group got similar findings in 6-hydroxydopamine (OHDA) -injected rats [15].”
BackgroundResultSelf-citationMaheu, M. G., James, N., Clark, Z., Yang, A. J. T., Patel, R., Beaudette, S. M., MacPherson, R. E. K., & Duarte‐Guterman, P. (2025) · Behavioural Brain Research · doi:10.1016/j.bbr.2025.115478 · Cited by 9
Systemic changes in neovascular age-related macular degeneration.
Singh, A. (2014) · PubMed · Cited by 7
Lin, S., He, L., Shen, R., Fang, F., Pan, H., Zhu, X., Wang, M., Zhou, Z., Liu, Z., Wang, X., et al. (2020) · European Journal of Neurology · doi:10.1111/ene.14224 · Cited by 5
“Other research in our group [17] identified that a sub-pathological dose of 6-hydroxydopamine caused very severe abnormal activation of microglia and more loss of dopaminergic neurons in rats treated with CD200R1 blocking antibodies than in those in the vehicle-treatment group.”
BackgroundSelf-citationLeveraging machine learning to predict Parkinson's disease using pre-symptomatic proteomics data
Nieves‐Rodriguez, S., Hou, L., Whelan, C. D., Li, S., & Torshizi, A. D. (2025) · Brain · doi:10.1093/brain/awaf303 · Cited by 4
Single-cell transcriptome and surfaceome profiling of the adult human retinal pigment epithelium
Farjood, F., Nandakumar, S., Bertucci, T. B., Kiehl, T. R., Lotz, S., Wang, Y., Black, J., Sai, S., Kozak, J. A., Arduini, B. L., et al. (2025) · Stem Cell Reports · doi:10.1016/j.stemcr.2025.102611 · Cited by 5
Co-signaling Molecules in Neurological Diseases
Kivisäkk, P., & Khoury, S. J. (2019) · Advances in experimental medicine and biology · doi:10.1007/978-981-32-9717-3_9 · Cited by 4
The application of iPSCs in Parkinson’s disease
Nielsen, J. J. J., Lillethorup, T. P., Glud, A. N., Sørensen, J. C. H., & Orłowski, D. (2020) · Acta Neurobiologiae Experimentalis · doi:10.21307/ane-2020-024 · Cited by 3
“Furthermore, cell replacement therapy of DA neurons alone might be suboptimal as glia cells are important to PD pathogenesis and DA neuronal death as well (Gu et al., 2010; Zhang et al., 2011).”
BackgroundPeripheral CD200R signaling: A critical regulator of post-stroke inflammation in aged mice
Ngwa, C., Misrani, A., Xu, Y., Wang, J., Ritzel, R. M., & Liu, F. (2025) · Brain Research Bulletin · doi:10.1016/j.brainresbull.2025.111686 · Cited by 2
Wang, Q.-Q., Sun, Q.-Q., Guo, Y.-S., Yin, S., & Zhou, J. (2026) · Translational Neurodegeneration · doi:10.1186/s40035-026-00571-3 · Cited by 2
“Its expression is reduced in AD brains and in the midbrain of PD mice [252, 253], and disruption of this pathway enhances microglial reactivity and promotes DA neuron loss in PD [254].”
Upcoming diagnostic biomarkers with promising prospects in neurological disorders
Ahmad, W., Ali, A., Ali, A., Khan, S. I., Khan, S., & Husain, I. (2019) · Clinical and Experimental Pharmacology and Physiology · doi:10.1111/1440-1681.13216 · Cited by 2
Parkinson's Disease Involving Glial Cell Dysfunction
Oukhrib, M., Tamegart, L., Ghachi, H. E., Haj-Khlifa, A., Hamdan, Y. A., Maloui, A. B., Gamrani, H., & Chraa, M. (2023) · Advances in bioinformatics and biomedical engineering book series · doi:10.4018/978-1-6684-9675-6.ch009 · Cited by 1
Microglial state transitions are constrained by developmental and metabolic checkpoints
Mesaoudi, A. E., & Kim, D. W. (2026) · Frontiers in Cellular Neuroscience · doi:10.3389/fncel.2026.1852176 · Cited by 1
“One well-studied gate is neuronal inhibitory signaling (Lyons et al., 2007; Zhang et al., 2011; Lehrman et al., 2018).”
Marshall, S. A. (2013) · UKnowledge (University of Kentucky) · Cited by 1
The role of microglia–lymphocyte interaction in PD neuropathology
Carta, A. R. (2012) · Basal Ganglia · doi:10.1016/j.baga.2012.07.003 · Cited by 1
TREM-2 expression and regulation in inflammation and ischaemia
Bradley, J. (2014) · UEA Digital Repository (University of East Anglia)
Host responses to human neural cell therapy in spinal cord injury
Liu, J. S. (2013) · Figshare
Gomes, C. A., George, J., Chen, J., & Cunha, R. A. (2015) · Current topics in neurotoxicity · doi:10.1007/978-3-319-20273-0_5
Microglia: A Double-Sided Sword in Stroke
Shi, H., Xu, M., Shi, Y., Gao, Y., Chen, J., & Hu, X. (2016) · Springer series in translational stroke research · doi:10.1007/978-3-319-32337-4_7
The Role of Chronic Inflammation in the Etiology of Parkinson’s Disease
Nash, Y., & Frenkel, D. (2016) · Springer eBooks · doi:10.1007/978-3-319-42139-1_4
Prodeus, A. (2018) · TSpace (University of Toronto)
Macrophages and the Art of Controlling Pain in Inflammation and Osteoarthritis
Raoof, R. (2020) · Utrecht University Repository (Utrecht University) · doi:10.33540/424
Bellini, M. J. (2020) · Open Access Journal of Biomedical Science · doi:10.38125/oajbs.000238
“On the other hand, any insult that affects neuronal integrity and interrupts these signals, or even the lack of expression of these ligands in neurons is recognized by the microglia as a “eat me” signal and, therefore, triggers the activation of the microglia and promoting phagocytosis of neurons [54-56].”
BackgroundLin, S., Shen, R., Pan, H., He, L., Fang, F., Su, Y., Zhu, X., Wang, X., Zhou, Y., Sun, X., et al. (2021) · Research Square · doi:10.21203/rs.3.rs-1064241/v1
Self-citationTimmerman, R. (2022) · Utrecht University Repository (Utrecht University) · doi:10.33540/1603
The protective effect of CD200 on hemorrhage/sepsis-associated acute kidney injuryPreprint
Geng, Y., Sun, L., Tang, W., Zhang, Y., Hu, B., & Pan, M. (2023) · Research Square · doi:10.21203/rs.3.rs-2469358/v1
Self-citationMorton, L., Arndt, P., Garza, A. P., Henneicke, S., Mattern, H., Gonzalez, M., Dityatev, A. E., Yilmazer‐Hanke, D., Schreiber, S., & Dunay, I. R. (2023) · bioRxiv (Cold Spring Harbor Laboratory) · doi:10.1101/2023.08.15.553403
Morton, L., Arndt, P., Garza, A. P., Henneicke, S., Mattern, H., Gonzalez, M., Dityatev, A. E., Yilmazer‐Hanke, D., Schreiber, S., & Dunay, I. R. (2024) · Figshare · doi:10.6084/m9.figshare.26656204
Morton, L., Arndt, P., Garza, A. P., Henneicke, S., Mattern, H., Gonzalez, M., Dityatev, A. E., Yilmazer‐Hanke, D., Schreiber, S., & Dunay, I. R. (2024) · Figshare · doi:10.6084/m9.figshare.26656192
Morton, L., Arndt, P., Garza, A. P., Henneicke, S., Mattern, H., Gonzalez, M., Dityatev, A. E., Yilmazer‐Hanke, D., Schreiber, S., & Dunay, I. R. (2024) · Figshare · doi:10.6084/m9.figshare.26656183
Morton, L., Arndt, P., Garza, A. P., Henneicke, S., Mattern, H., Gonzalez, M., Dityatev, A. E., Yilmazer‐Hanke, D., Schreiber, S., & Dunay, I. R. (2023) · Figshare · doi:10.6084/m9.figshare.26656186
Chen, X., Cui, Q.-Q., Hu, X.-H., Ye, J., Liu, Z.-C., Mei, Y.-X., Wang, F., Hu, Z.-L., & Chen, J.-G. (2023) · Figshare · doi:10.6084/m9.figshare.23612412
Morton, L., Arndt, P., Garza, A. P., Henneicke, S., Mattern, H., Gonzalez, M., Dityatev, A. E., Yilmazer‐Hanke, D., Schreiber, S., & Dunay, I. R. (2024) · Figshare · doi:10.6084/m9.figshare.26656189
Morton, L., Arndt, P., Garza, A. P., Henneicke, S., Mattern, H., Gonzalez, M., Dityatev, A. E., Yilmazer‐Hanke, D., Schreiber, S., & Dunay, I. R. (2024) · Figshare · doi:10.6084/m9.figshare.26656201
Morton, L., Arndt, P., Garza, A. P., Henneicke, S., Mattern, H., Gonzalez, M., Dityatev, A. E., Yilmazer‐Hanke, D., Schreiber, S., & Dunay, I. R. (2024) · Figshare · doi:10.6084/m9.figshare.26656198
Morton, L., Arndt, P., Garza, A. P., Henneicke, S., Mattern, H., Gonzalez, M., Dityatev, A. E., Yilmazer‐Hanke, D., Schreiber, S., & Dunay, I. R. (2024) · Figshare · doi:10.6084/m9.figshare.26656195
Exploring the complex role of protein glycosylation in the pathogenesis of Parkinson’s disease
Carvalho, A. N., Nunes, M. J., Gama, M. J., Rodrigues, E., Videira, P. A., & Castro‐Caldas, M. (2025) · Royal Society of Chemistry eBooks · doi:10.1039/9781837676101-00062
In vitro and in vivo study of the effects of Levetiracetam on activated microglia during sepsis
Fleurance, R. (2021) · theses.fr (ABES) · doi:10.70675/0a82ed6ez6595z4366z832fz70cbe839c7ff
Role of glial cells during rabies virus infection
Feige, L. (2021) · theses.fr (ABES) · doi:10.70675/c423b214z3cc0z4976za6fazc5bc61c40274
Jernigan, J. E., Menees, K. B., & Tansey, M. G. (2026) · Journal of Neuroinflammation · doi:10.1186/s12974-026-03858-4
“…on microglia, multiple studies have investigated the CD200-CD200R1 axis in the context of neuroinflammatory diseases like PD and have identified that CD200R1 inhibition augmented dopaminergic loss and neuroinflammation in the MPTP and 6-hydroxydo-pamine (6-OHDA) rodent models of PD [148, 156].”
Metadata
- Authors
- Zhang, S., Wang, X.-J., Tian, L.-P., Pan, J., Lu, G.-Q., Zhang, Y.-J., Ding, J.-Q., & Chen, S.-D.
- Affiliations
- Shanghai Jiao Tong University (CN)
- ORCID
- Pan, Jing
- Venue
- Journal of Neuroinflammation
- Published
- 2011-11-06
- Volume
- 8
- Issue
- 1
- Pages
- 154-154
- ISSN
- 1742-2094 (ISSN-L)
- PMC
- PMC3226566
- OpenAlex
- W2033271712
- Cited by
- 154
- References
- 85
- Citations by year
- 2026: 3 · 2025: 7 · 2024: 13 · 2023: 12 · 2022: 8 · 2021: 11 · 2020: 10 · 2019: 13 · 2018: 10 · 2017: 8 · 2016: 10 · 2015: 8 · 2014: 16 · 2013: 16 · 2012: 8
- FWCI
- 7.24
- Type
- journal article
- Language
- en
- Open access
- gold
- doi.org
- Licence
- cc-by
- Locations
- Journal of Neuroinflammation (publishedVersion, cc-by)
- PubMed Central (publishedVersion, cc-by)
- PubMed (publishedVersion)
- DOAJ (DOAJ: Directory of Open Access Journals) (submittedVersion, cc-by-sa)
- Topics
- Life Sciences › Neuroscience › Neurology › Neuroinflammation and Neurodegeneration Mechanisms
- Health Sciences › Medicine › Clinical Neurology › Parkinson's Disease Mechanisms and Treatments
- Life Sciences › Biochemistry, Genetics and Molecular Biology › Molecular Biology › Nuclear Receptors and Signaling
- Keywords
- Parkinson's disease, microglial activation, dopaminergic neuron loss, 6-hydroxydopamine lesion, substantia nigra, neuroinflammation, inflammatory cytokines, monoamine levels, motor impairment, striatum, neuroprotection, rat model
- MeSH terms
- Animals, Behavior, Animal, Disease Models, Animal, Dopamine, Humans, Male, Nerve Degeneration, Receptors, Immunologic, Antigens, CD, Oxidopamine, Rats, Sprague-Dawley, Microglia, Antibodies, Blocking, Parkinsonian Disorders, Rats, Dopaminergic Neurons
About these checks
Registry, retraction, Cites and statistics results are computed, not judged, with one exception: a printed reference that no index lists is read once by a model before it counts as a citation error. Claims are extracted by a model and kept only when their quote appears verbatim in the text; each cited source is then checked, with a model’s help, for whether it says what the claim relies on. Those verdicts can be wrong — read the claim’s quote and the cited source before relying on one.
Statistics and arithmetic are recomputed, not judged.
Confidence bands are shown only for fields calibrated on our annotated test set. None is calibrated yet, so no band is shown.
What counts as a claim ›How we measure confidence ›How we check this ›
Are you an author, or do you see a problem with this page? Request a review
