

The DOI matches its Crossref record; 12 of the 12 references it cites were found in a registry or an index.
Transcript length bias in RNA-seq data confounds systems biology
Open accessAbstract
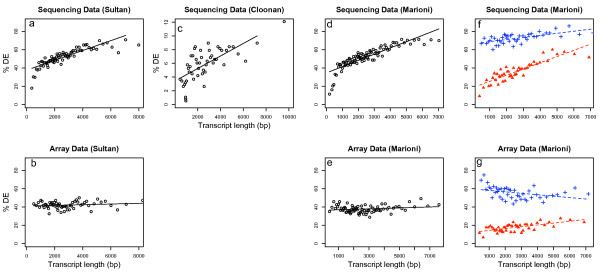
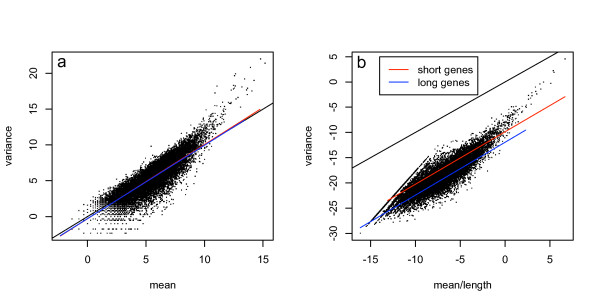
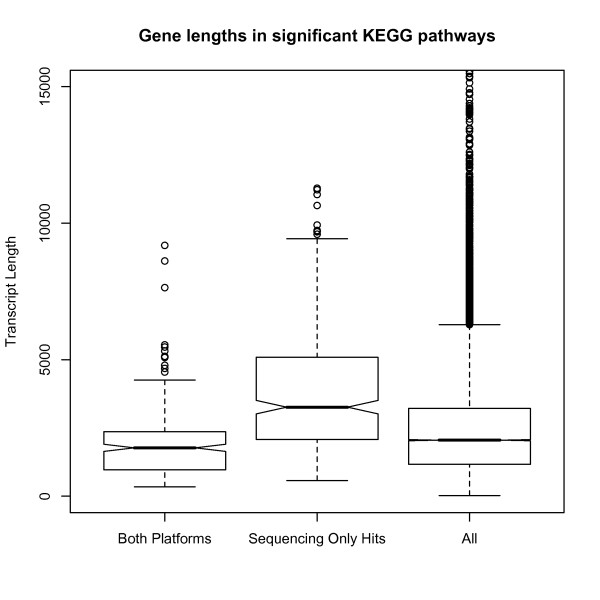
BACKGROUND: Several recent studies have demonstrated the effectiveness of deep sequencing for transcriptome analysis (RNA-seq) in mammals. As RNA-seq becomes more affordable, whole genome transcriptional profiling is likely to become the platform of choice for species with good genomic sequences. As yet, a rigorous analysis methodology has not been developed and we are still in the stages of exploring the features of the data. RESULTS: We investigated the effect of transcript length bias in RNA-seq data using three different published data sets. For standard analyses using aggregated tag counts for each gene, the ability to call differentially expressed genes between samples is strongly associated with the length of the transcript. CONCLUSION: Transcript length bias for calling differentially expressed genes is a general feature of current protocols for RNA-seq technology. This has implications for the ranking of differentially expressed genes, and in particular may introduce bias in gene set testing for pathway analysis and other multi-gene systems biology analyses. REVIEWERS: This article was reviewed by Rohan Williams (nominated by Gavin Huttley), Nicole Cloonan (nominated by Mark Ragan) and James Bullard (nominated by Sandrine Dudoit).
Overview
The claims and statistics of this paper haven’t been checked yet.
Run the check — free, no account needed. It reads the open-access text and checks the sources it cites.
Integrity signals
Registry
Cites
Statistics
Figures
Verification
Claims the paper makes
The claims and statistics of this paper haven’t been checked yet.
Run the check — free, no account needed. It reads the open-access text and checks the sources it cites.
Claims other papers make about this one
Each is checked against this paper’s own text: does it say what the citing paper says it does?
In the citing paper
“It should be noted that these estimates apply to the average gene expression level, but as dynamic ranges in RNA-seq data are large, the probability that highly expressed genes will be detected as differentially expressed is greater than that for low-count genes [192].”
From A survey of best practices for RNA-seq data analysis (2016) · cites this paper as [192]
Self-check
Percentages, sums and reported differences re-computed from the paper’s own numbers.
The self-check needs the paper’s full text.
Citations
Cites
Systematic and integrative analysis of large gene lists using DAVID bioinformatics resources
Huang, D. W., Sherman, B. T., & Lempicki, R. A. (2009) · Nature Protocols · doi:10.1038/nprot.2008.211 · Cited by 35,890 · cited 1×
“In each analysis we only used genes found on both platforms and then performed a pathway analysis using the DAVID software [7,8].”
MethodHuang, D. W., Sherman, B. T., & Lempicki, R. A. (2009) · Nucleic Acids Research · doi:10.1093/nar/gkn923 · Cited by 14,108 · cited 1×
“In each analysis we only used genes found on both platforms and then performed a pathway analysis using the DAVID software [7,8].”
MethodSmyth, G. K. (2004) · Statistical Applications in Genetics and Molecular Biology · doi:10.2202/1544-6115.1027 · Cited by 11,829
Exploration, normalization, and summaries of high density oligonucleotide array probe level data
Irizarry, R. A. (2003) · Biostatistics · doi:10.1093/biostatistics/4.2.249 · Cited by 10,603 · cited 1×
“array algorithm [9] but this suggestion requires further exploration and analysis.”
MethodAlternative isoform regulation in human tissue transcriptomes
Wang, E. T., Sandberg, R., Luo, S., Khrebtukova, I., Zhang, L., Mayr, C., Kingsmore, S. F., Schroth, G. P., & Burge, C. B. (2008) · Nature · doi:10.1038/nature07509 · Cited by 5,181
The Significance of Digital Gene Expression ProfilesPreprint
Audic, S., & Claverie, J. (1997) · Genome Research · doi:10.1101/gr.7.10.986 · Cited by 2,787 · cited 1×
“They then used a method based on the proportion of counts from each library proposed by Audic and Claverie [11] to determine the significant of differential expression.”
MethodRNA-seq: An assessment of technical reproducibility and comparison with gene expression arrays
Marioni, J. C., Mason, C. E., Mane, S. M., Stephens, M., & Gilad, Y. (2008) · Genome Research · doi:10.1101/gr.079558.108 · Cited by 2,771 · cited 7×
“For the data from Marioni et al (2008) genes were matched between the RNA-seq platform and the microarray platform.”
BackgroundMethodInfluentialSultan, M., Schulz, M. H., Richard, H., Magen, A., Klingenhoff, A., Scherf, M., Seifert, M., Borodina, T., Soldatov, A., Parkhomchuk, D., et al. (2008) · Science · doi:10.1126/science.1160342 · Cited by 1,293 · cited 3×
“The first data set compares sequencing from the Illumina Genome Analyzer with Illumina microarrays and looks for differential expression between a human embryonic kidney and B cell line [4].”
BackgroundMethodStem cell transcriptome profiling via massive-scale mRNA sequencing
Cloonan, N., Forrest, A. R. R., Kolle, G., Gardiner, B. B. A., Faulkner, G. J., Brown, M. K., Taylor, D. F., Steptoe, A. L., Wani, S., Bethel, G., et al. (2008) · Nature Methods · doi:10.1038/nmeth.1223 · Cited by 1,035 · cited 4×
“…a predictable consequence of the sampling process and cannot be corrected by dividing by length of the transcript (e.g. the statistical methods in Cloonan et al (2008) or Sultan et al. Differential expression as a function of transcript lengthFigu 1 Differential expression as a function of…”
MethodInfluentialStochastic Models Inspired by Hybridization Theory for Short Oligonucleotide Arrays
Wu, Z. J., & Irizarry, R. A. (2005) · Journal of Computational Biology · doi:10.1089/cmb.2005.12.882 · Cited by 266 · cited 1×
“By contrast, intensity measurements from microarrays are proportional only to the expression level of the transcript plus any features intrinsic to the probe itself such as GC content [2,3].”
BackgroundStatistical issues in the analysis of Illumina data
Dunning, M., Barbosa‐Morais, N. L., Lynch, A. G., Tavaré, S., & Ritchie, M. E. (2008) · BMC Bioinformatics · doi:10.1186/1471-2105-9-85 · Cited by 106 · cited 1×
“By contrast, intensity measurements from microarrays are proportional only to the expression level of the transcript plus any features intrinsic to the probe itself such as GC content [2,3].”
BackgroundStochastic models inspired by hybridization theory for short oligonucleotide arrays
Wu, Z. J., & Irizarry, R. A. (2004) · Research in Computational Molecular Biology · doi:10.1145/974614.974628 · Cited by 55
Cited by
Sorted by citations
A scaling normalization method for differential expression analysis of RNA-seq data
Robinson, M. D., & Oshlack, A. (2010) · Genome Biology · doi:10.1186/gb-2010-11-3-r25 · Cited by 7,876
“However, it has been well established that gene length biases are prominent in the analysis of gene expression [15].”
Self-citationGene ontology analysis for RNA-seq: accounting for selection bias
Young, M. D., Wakefield, M. J., Smyth, G. K., & Oshlack, A. (2010) · Genome Biology · doi:10.1186/gb-2010-11-2-r14 · Cited by 7,107
Self-citationA survey of best practices for RNA-seq data analysis
Conesa, A., Madrigal, P., Tarazona, S., Gomez-Cabrero, D., Cervera, A., McPherson, A., Szcześniak, M. W., Gaffney, D. J., Elo, L. L., Zhang, X., et al. (2016) · Genome Biology · doi:10.1186/s13059-016-0881-8 · Cited by 2,794
“It should be noted that these estimates apply to the average gene expression level, but as dynamic ranges in RNA-seq data are large, the probability that highly expressed genes will be detected as differentially expressed is greater than that for low-count genes [192].”
BackgroundRNA sequencing: advances, challenges and opportunities
Ozsolak, F., & Milos, P. M. (2011) · Nature Reviews Genetics · doi:10.1038/nrg2934 · Cited by 2,135
“Second, commonly used RNA-seq strategies can result in transcript-length bias because of the multiple fragmentation and RNA or cDNA size-selection steps they us”
MethodBullard, J. H., Purdom, E., Hansen, K. D., & Dudoit, S. (2010) · BMC Bioinformatics · doi:10.1186/1471-2105-11-94 · Cited by 1,680
“Under the assumptions presented in [11], with the unweighted t-statistics and using the same cutoff across genes, power increases with gene length for a given level of DE.”
BackgroundMethodInfluential
Metadata
- Authors
- Oshlack, A., & Wakefield, M. J.
- Affiliations
- Walter and Eliza Hall Institute of Medical Research (AU)
- Corresponding author
- Oshlack, Alicia
- Venue
- Biology Direct
- Published
- 2009
- Volume
- 4
- Issue
- 1
- Pages
- 14
- ISSN
- 1745-6150 (ISSN-L)
- PMC
- PMC2678084
- OpenAlex
- W2114504176
- Cited by
- 497
- References
- 12
- Citations by year
- 2026: 6 · 2025: 8 · 2024: 16 · 2023: 14 · 2022: 24 · 2021: 35 · 2020: 12 · 2019: 29 · 2018: 30 · 2017: 36 · 2016: 33 · 2015: 39 · 2014: 39 · 2013: 37 · 2012: 44
- FWCI
- 18.63
- Type
- journal article
- Language
- en
- Open access
- gold
- doi.org
- Licence
- cc-by
- Locations
- Biology Direct (publishedVersion, cc-by)
- PubMed Central (publishedVersion, cc-by)
- PubMed (publishedVersion)
- Minerva Access (University of Melbourne) (submittedVersion, cc-by)
- DOAJ (DOAJ: Directory of Open Access Journals) (submittedVersion)
- Topics
- Life Sciences › Biochemistry, Genetics and Molecular Biology › Molecular Biology › Genomics and Phylogenetic Studies
- Life Sciences › Biochemistry, Genetics and Molecular Biology › Molecular Biology › Gene expression and cancer classification
- Life Sciences › Biochemistry, Genetics and Molecular Biology › Molecular Biology › Bioinformatics and Genomic Networks
- Keywords
- RNA-seq, differentially expressed genes, gene expression profiling, pathway analysis, systems biology
- MeSH terms
- Base Sequence, Humans, RNA, Messenger, Transcription, Genetic, Bias, Oligonucleotide Array Sequence Analysis, Gene Expression Profiling, Systems Biology
About these checks
Registry, retraction, Cites and statistics results are computed, not judged, with one exception: a printed reference that no index lists is read once by a model before it counts as a citation error. Claims are extracted by a model and kept only when their quote appears verbatim in the text; each cited source is then checked, with a model’s help, for whether it says what the claim relies on. Those verdicts can be wrong — read the claim’s quote and the cited source before relying on one.
Statistics and arithmetic are recomputed, not judged.
Confidence bands are shown only for fields calibrated on our annotated test set. None is calibrated yet, so no band is shown.
What counts as a claim ›How we measure confidence ›How we check this ›
Are you an author, or do you see a problem with this page? Request a review
