

The DOI matches its Crossref record; 12 of the 12 references it cites were found in a registry or an index.
Transcript length bias in RNA-seq data confounds systems biology
Open accessAbstract
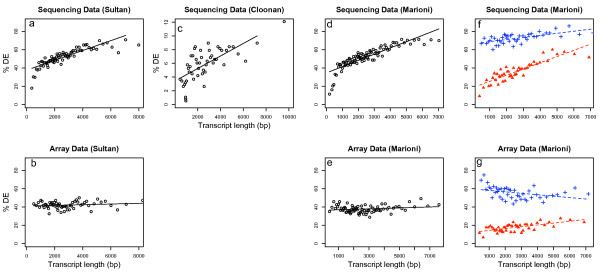
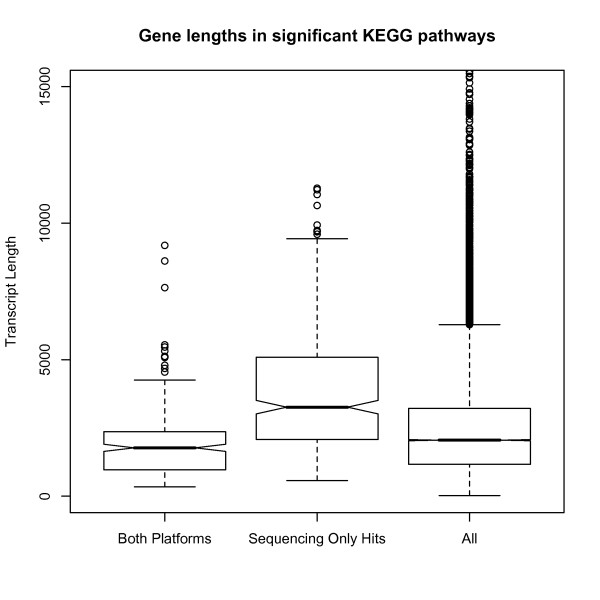
BACKGROUND: Several recent studies have demonstrated the effectiveness of deep sequencing for transcriptome analysis (RNA-seq) in mammals. As RNA-seq becomes more affordable, whole genome transcriptional profiling is likely to become the platform of choice for species with good genomic sequences. As yet, a rigorous analysis methodology has not been developed and we are still in the stages of exploring the features of the data. RESULTS: We investigated the effect of transcript length bias in RNA-seq data using three different published data sets. For standard analyses using aggregated tag counts for each gene, the ability to call differentially expressed genes between samples is strongly associated with the length of the transcript. CONCLUSION: Transcript length bias for calling differentially expressed genes is a general feature of current protocols for RNA-seq technology. This has implications for the ranking of differentially expressed genes, and in particular may introduce bias in gene set testing for pathway analysis and other multi-gene systems biology analyses. REVIEWERS: This article was reviewed by Rohan Williams (nominated by Gavin Huttley), Nicole Cloonan (nominated by Mark Ragan) and James Bullard (nominated by Sandrine Dudoit).
Overview
The claims and statistics of this paper haven’t been checked yet.
Run the check — free, no account needed. It reads the open-access text and checks the sources it cites.
Integrity signals
Registry
Cites
Statistics
Figures
Verification
Claims the paper makes
The claims and statistics of this paper haven’t been checked yet.
Run the check — free, no account needed. It reads the open-access text and checks the sources it cites.
Claims other papers make about this one
Each is checked against this paper’s own text: does it say what the citing paper says it does?
In the citing paper
“It should be noted that these estimates apply to the average gene expression level, but as dynamic ranges in RNA-seq data are large, the probability that highly expressed genes will be detected as differentially expressed is greater than that for low-count genes [192].”
From A survey of best practices for RNA-seq data analysis (2016) · cites this paper as [192]
Self-check
Percentages, sums and reported differences re-computed from the paper’s own numbers.
The self-check needs the paper’s full text.
Citations
Cites
Systematic and integrative analysis of large gene lists using DAVID bioinformatics resources
Huang, D. W., Sherman, B. T., & Lempicki, R. A. (2009) · Nature Protocols · doi:10.1038/nprot.2008.211 · Cited by 35,890 · cited 1×
“In each analysis we only used genes found on both platforms and then performed a pathway analysis using the DAVID software [7,8].”
MethodHuang, D. W., Sherman, B. T., & Lempicki, R. A. (2009) · Nucleic Acids Research · doi:10.1093/nar/gkn923 · Cited by 14,108 · cited 1×
“In each analysis we only used genes found on both platforms and then performed a pathway analysis using the DAVID software [7,8].”
MethodSmyth, G. K. (2004) · Statistical Applications in Genetics and Molecular Biology · doi:10.2202/1544-6115.1027 · Cited by 11,829
Exploration, normalization, and summaries of high density oligonucleotide array probe level data
Irizarry, R. A. (2003) · Biostatistics · doi:10.1093/biostatistics/4.2.249 · Cited by 10,603 · cited 1×
“array algorithm [9] but this suggestion requires further exploration and analysis.”
MethodAlternative isoform regulation in human tissue transcriptomes
Wang, E. T., Sandberg, R., Luo, S., Khrebtukova, I., Zhang, L., Mayr, C., Kingsmore, S. F., Schroth, G. P., & Burge, C. B. (2008) · Nature · doi:10.1038/nature07509 · Cited by 5,181
The Significance of Digital Gene Expression ProfilesPreprint
Audic, S., & Claverie, J. (1997) · Genome Research · doi:10.1101/gr.7.10.986 · Cited by 2,787 · cited 1×
“They then used a method based on the proportion of counts from each library proposed by Audic and Claverie [11] to determine the significant of differential expression.”
MethodRNA-seq: An assessment of technical reproducibility and comparison with gene expression arrays
Marioni, J. C., Mason, C. E., Mane, S. M., Stephens, M., & Gilad, Y. (2008) · Genome Research · doi:10.1101/gr.079558.108 · Cited by 2,771 · cited 7×
“For the data from Marioni et al (2008) genes were matched between the RNA-seq platform and the microarray platform.”
BackgroundMethodInfluentialSultan, M., Schulz, M. H., Richard, H., Magen, A., Klingenhoff, A., Scherf, M., Seifert, M., Borodina, T., Soldatov, A., Parkhomchuk, D., et al. (2008) · Science · doi:10.1126/science.1160342 · Cited by 1,293 · cited 3×
“The first data set compares sequencing from the Illumina Genome Analyzer with Illumina microarrays and looks for differential expression between a human embryonic kidney and B cell line [4].”
BackgroundMethodStem cell transcriptome profiling via massive-scale mRNA sequencing
Cloonan, N., Forrest, A. R. R., Kolle, G., Gardiner, B. B. A., Faulkner, G. J., Brown, M. K., Taylor, D. F., Steptoe, A. L., Wani, S., Bethel, G., et al. (2008) · Nature Methods · doi:10.1038/nmeth.1223 · Cited by 1,035 · cited 4×
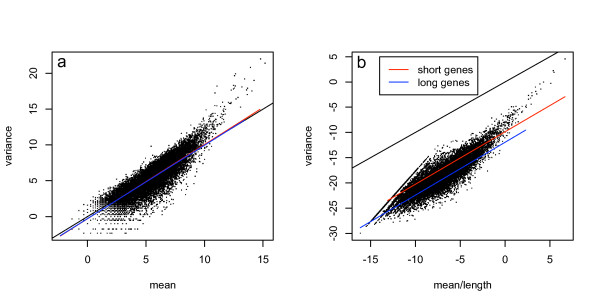
“…a predictable consequence of the sampling process and cannot be corrected by dividing by length of the transcript (e.g. the statistical methods in Cloonan et al (2008) or Sultan et al. Differential expression as a function of transcript lengthFigu 1 Differential expression as a function of…”
MethodInfluentialStochastic Models Inspired by Hybridization Theory for Short Oligonucleotide Arrays
Wu, Z. J., & Irizarry, R. A. (2005) · Journal of Computational Biology · doi:10.1089/cmb.2005.12.882 · Cited by 266 · cited 1×
“By contrast, intensity measurements from microarrays are proportional only to the expression level of the transcript plus any features intrinsic to the probe itself such as GC content [2,3].”
Background
Cited by
Sorted by citations
A scaling normalization method for differential expression analysis of RNA-seq data
Robinson, M. D., & Oshlack, A. (2010) · Genome Biology · doi:10.1186/gb-2010-11-3-r25 · Cited by 7,876
“However, it has been well established that gene length biases are prominent in the analysis of gene expression [15].”
Self-citationGene ontology analysis for RNA-seq: accounting for selection bias
Young, M. D., Wakefield, M. J., Smyth, G. K., & Oshlack, A. (2010) · Genome Biology · doi:10.1186/gb-2010-11-2-r14 · Cited by 7,107
Self-citationA survey of best practices for RNA-seq data analysis
Conesa, A., Madrigal, P., Tarazona, S., Gomez-Cabrero, D., Cervera, A., McPherson, A., Szcześniak, M. W., Gaffney, D. J., Elo, L. L., Zhang, X., et al. (2016) · Genome Biology · doi:10.1186/s13059-016-0881-8 · Cited by 2,794
“It should be noted that these estimates apply to the average gene expression level, but as dynamic ranges in RNA-seq data are large, the probability that highly expressed genes will be detected as differentially expressed is greater than that for low-count genes [192].”
BackgroundRNA sequencing: advances, challenges and opportunities
Ozsolak, F., & Milos, P. M. (2011) · Nature Reviews Genetics · doi:10.1038/nrg2934 · Cited by 2,135
“Second, commonly used RNA-seq strategies can result in transcript-length bias because of the multiple fragmentation and RNA or cDNA size-selection steps they us”
MethodBullard, J. H., Purdom, E., Hansen, K. D., & Dudoit, S. (2010) · BMC Bioinformatics · doi:10.1186/1471-2105-11-94 · Cited by 1,680
“Under the assumptions presented in [11], with the unweighted t-statistics and using the same cutoff across genes, power increases with gene length for a given level of DE.”
BackgroundMethodInfluentialDifferential expression in RNA-seq: A matter of depth
Tarazona, S., García-Alcalde, F., Dopazo, J., Ferrer, A., & Conesa, A. (2011) · Genome Research · doi:10.1101/gr.124321.111 · Cited by 1,632
“The nature of the short read procedure makes it inevitable that longer transcripts will be preferentially detected over shorter ones, and this has been shown to have implications in the biological interpretation of the data (Oshlack and Wakefield 2009; Young et al. 2010).”
BackgroundDillies, M., Rau, A., Aubert, J., Hennequet‐Antier, C., Jeanmougin, M., Servant, N., Keime, C., Marot, G., Castel, D., Estellé, J., et al. (2012) · Briefings in Bioinformatics · doi:10.1093/bib/bbs046 · Cited by 1,363
“Even in cases where a strong positive association between gene counts and length is observed, scaling counts by gene length with RPKM is not sufficient for removing this bias [16, 20].”
BackgroundHost Biology in Light of the Microbiome: Ten Principles of Holobionts and Hologenomes
Bordenstein, S. R., & Theis, K. R. (2015) · PLOS Biology · doi:10.1371/journal.pbio.1002226 · Cited by 1,240
Computational methods for transcriptome annotation and quantification using RNA-seq
Garber, M., Grabherr, M. G., Guttman, M., & Trapnell, C. (2011) · Nature Methods · doi:10.1038/nmeth.1613 · Cited by 1,042
“Note: Supplementary information is available on the Nature Methods website. aCKnowLedGments expression depends on the sequencing depth of the sample, the expression of the gene, and even the length of the gene 64,68 .”
BackgroundKukurba, K. R., & Montgomery, S. B. (2015) · Cold Spring Harbor Protocols · doi:10.1101/pdb.top084970 · Cited by 924
“To accurately estimate gene expression, read counts must be normalized to correct for systematic variability, such as library fragment size, sequence composition bias, and read depth (Oshlack and Wake fi eld 2009; Roberts et al. 2011b).”
GC-Content Normalization for RNA-Seq Data
Risso, D., Schwartz, K., Sherlock, G., & Dudoit, S. (2011) · BMC Bioinformatics · doi:10.1186/1471-2105-12-480 · Cited by 867
“Another well-known selection bias in RNA-Seq is due to gene length [3,14].”
BackgroundComprehensive evaluation of differential gene expression analysis methods for RNA-seq data
Rapaport, F., Khanin, R., Liang, Y., Pirun, M., Krek, A., Zumbo, P., Mason, C. E., Socci, N. D., & Betel, D. (2013) · Genome Biology · doi:10.1186/gb-2013-14-9-r95 · Cited by 733
“Hence there is a clear length bias when measuring gene expression by RNA-seq [20].”
BackgroundTranscriptome genetics using second generation sequencing in a Caucasian population
Montgomery, S. B., Sammeth, M., Gutierrez-Arcelus, M., Lach, R. P., Ingle, C., Nisbett, J., Guigo, R., & Dermitzakis, E. T. (2010) · Nature · doi:10.1038/nature08903 · Cited by 797
Data quality aware analysis of differential expression in RNA-seq with NOISeq R/Bioc package
Tarazona, S., Furió‐Tarí, P., Turrà, D., Pietro, A. D., Nueda, M. J., Ferrer, A., & Conesa, A. (2015) · Nucleic Acids Research · doi:10.1093/nar/gkv711 · Cited by 787
“Technology biases, such as the transcript length (12), GC content (13), PCR artifacts, uneven transcript read coverage, contamination by off-target transcripts, or large differences in transcript distributions (14), are factors that interfere in the linear relationship between transcript abundance and the number of ma…”
BackgroundMethodFrom RNA-seq reads to differential expression results
Oshlack, A., Robinson, M. D., & Young, M. D. (2010) · Genome biology · doi:10.1186/gb-2010-11-12-220 · Cited by 733
“For example, gene length bias is an issue in RNA-seq data, in which longer genes have higher counts (at the same expression level) [66].”
BackgroundSelf-citationSingle sample scoring of molecular phenotypes
Foroutan, M., Bhuva, D. D., Horan, K., Lyu, R., Cursons, J., & Davis, M. J. (2018) · BMC Bioinformatics · doi:10.1186/s12859-018-2435-4 · Cited by 561
Computation for ChIP-seq and RNA-seq studies
Pepke, S., Wold, B. J., & Mortazavi, A. (2009) · Nature Methods · doi:10.1038/nmeth.1371 · Cited by 568
“For example, RNA fragmentation and size selection steps of 200-base-pair fragments in current RNA-seq protocols will likely result in under-representation of the shortest transcripts, as has already been note”
BackgroundHowe, E., Sinha, R., Schlauch, D., & Quackenbush, J. F. (2011) · Bioinformatics · doi:10.1093/bioinformatics/btr490 · Cited by 518
Miller, R., Wu, G., Deshpande, R. R., Vieler, A., Gärtner, K., Li, X., Moellering, E. R., Zäuner, S., Cornish, A. J., Liu, B., et al. (2010) · PLANT PHYSIOLOGY · doi:10.1104/pp.110.165159 · Cited by 511
“Because of this length bias, longer transcripts may have more significant differences in differential gene expression studies and in some cases will lead to false-positive differential expression calls (Oshlack and Wakefield, 2009; Bullard et al., 2010).”
BackgroundUncovering the Complexity of Transcriptomes with RNA-Seq
Costa, V., Angelini, C., Feis, I. D., & Ciccodicola, A. (2010) · BioMed Research International · doi:10.1155/2010/853916 · Cited by 460
“Regarding this point in [92] it is illustrated the inherent bias in transcript length that affect RNA-Seq experiments.”
BackgroundNormalization, testing, and false discovery rate estimation for RNA-sequencing data
Li, J., Witten, D. M., Johnstone, I. M., & Tibshirani, R. (2012) · Biostatistics · doi:10.1093/biostatistics/kxr031 · Cited by 369
Benayoun, B. A., Pollina, E. A., Singh, P. P., Mahmoudi, S., Harel, I., Casey, K. M., Dulken, B. W., Kundaje, A., & Brunet, A. (2019) · Genome Research · doi:10.1101/gr.240093.118 · Cited by 360
Selecting between-sample RNA-Seq normalization methods from the perspective of their assumptions
Evans, C., Hardin, J., & Stoebel, D. M. (2017) · Briefings in Bioinformatics · doi:10.1093/bib/bbx008 · Cited by 368
“To convert raw read counts into informative measures of gene expression, normalization is needed to account for factors that affect the number of reads mapped to a gene, like length [5], GC-content [6] and sequencing depth [7].”
MethodMeyer, E., Aglyamova, G. V., & Matz, M. V. (2011) · Molecular Ecology · doi:10.1111/j.1365-294x.2011.05205.x · Cited by 379
“3c), because this bias stems from oversampling longer genes in approaches that cover the entire mRNA (Oshlack & Wakefield 2009).”
BackgroundCalculating Sample Size Estimates for RNA Sequencing Data
Hart, S. N., Therneau, T. M., Zhang, Y., Poland, G. A., & Kocher, J.-P. (2013) · Journal of Computational Biology · doi:10.1089/cmb.2012.0283 · Cited by 341
“Normalization by gene length removes information about the original count value and decreases power to detect many genes (Oshlack and Wakefield, 2009).”
Cloud-scale RNA-sequencing differential expression analysis with Myrna
Langmead, B., Hansen, K. D., & Leek, J. T. (2010) · Genome biology · doi:10.1186/gb-2010-11-8-r83 · Cited by 320
“This bias is substantially reduced, again by including the normalization constant as a term; however, some slight read length bias is still apparent (Figure 3f), as previously described [27].”
BackgroundResultChIP-seq analysis reveals distinct H3K27me3 profiles that correlate with transcriptional activity
Young, M. D., Willson, T. A., Wakefield, M. J., Trounson, E., Hilton, D. J., Blewitt, M. E., Oshlack, A., & Majewski, I. J. (2011) · Nucleic Acids Research · doi:10.1093/nar/gkr416 · Cited by 312
“However, it should be noted that the Poisson test suffers from gene length bias in a similar way to RNA-seq data (37).”
ResultSelf-citationRNA-seq: technical variability and sampling
McIntyre, L. M., Lopiano, K. K., Morse, A. M., Amin, V., Oberg, A. L., Young, L. J., & Nuzhdin, S. V. (2011) · BMC Genomics · doi:10.1186/1471-2164-12-293 · Cited by 285
“In addition, technical variance, sequencing bias and mapping bias have been reported [9-11].”
BackgroundRNA sequencing reveals two major classes of gene expression levels in metazoan cells
Hebenstreit, D., Fang, M., Gu, M., Charoensawan, V., van Oudenaarden, A., & Teichmann, S. A. (2011) · Molecular Systems Biology · doi:10.1038/msb.2011.28 · Cited by 289
“…2011 & 2011 EMBO and Macmillan Publishers Limited The accuracy of RNA-seq is biased toward longer and more highly expressed genes, e.g., 5% of all genes account for 50% of all reads in our data as well as in other data sets (Mortazavi et al, 2008; Oshlack and Wakefield, 2009; Bullard et al, 2010).”
Advanced Applications of RNA Sequencing and Challenges
Han, Y., Gao, S., Muegge, K., Zhang, W., & Zhou, B. (2015) · Bioinformatics and Biology Insights · doi:10.4137/bbi.s28991 · Cited by 303
“72,77,78 Since the RPKM method handles all the RNA-seq reads almost equally, for example, without concern for isoforms, it has been criticized.”
MethodData-based filtering for replicated high-throughput transcriptome sequencing experiments
Rau, A., Gallopin, M., Celeux, G., & Jaffrézic, F. (2013) · Bioinformatics · doi:10.1093/bioinformatics/btt350 · Cited by 262
“However, we note that it has been shown that counts, rather than RPKM values, are preferable for the differential analysis of RNA-seq data (Oshlack and Wakefield, 2009).”
BackgroundSex-specific and lineage-specific alternative splicing in primatesPreprint
Blekhman, R., Marioni, J. C., Zumbo, P., Stephens, M., & Gilad, Y. (2009) · Genome Research · doi:10.1101/gr.099226.109 · Cited by 270
“Of the identified junctions, a larger number of exon skipping events are shared between human and chimpanzee (950) than between either human (808) or chimpanzee (783) and rhesus macaque, as might be expected given the known phylogeny of these species.”
BackgroundResultInfluentialPathway Analysis: State of the Art
García-Campos, M. A., Enríquez, J. E., & Lemus, E. H. (2015) · Frontiers in Physiology · doi:10.3389/fphys.2015.00383 · Cited by 292
“Using standard PA methods to analyze RNA-seq data may give biased results due to over detection of differential expression for long and highly expressed transcripts (Oshlack and Wakefield, 2009).”
MethodComparing Bioinformatic Gene Expression Profiling Methods: Microarray and RNA-Seq
Mantione, K. J., Kream, R. M., Kuželová, H., Ptáček, R., Raboch, J., Samuel, J. M., & Stefano, G. B. (2014) · Medical science monitor basic research/Medical science monitor. Basic research · doi:10.12659/msmbr.892101 · Cited by 264
“The RNA-Seq method to determine differentially expressed genes does have an inherent bias towards longer transcripts [16,17].”
MethodChen, S., Yang, P., Jiang, F., Wei, Y., Ma, Z., & Kang, L. (2010) · PLoS ONE · doi:10.1371/journal.pone.0015633 · Cited by 257
“However, for the reason that in RNA-seq experiments the expected read counts of a given transcript is proportional to its abundance multiplied by its length [21,71,72], x, y represented by the mapped read counts of a transcript can not reflect the real expression level of transcripts.”
BackgroundReproducibility of high-throughput mRNA and small RNA sequencing across laboratories
The GEUVADIS Consortium, 't Hoen, P. A. C., Friedländer, M. R., Almlöf, J., Sammeth, M., Pulyakhina, I., Anvar, S. Y., Laros, J. F. J., Buermans, H. P. J., Karlberg, O., et al. (2013) · Nature Biotechnology · doi:10.1038/nbt.2702 · Cited by 250
Measuring differential gene expression with RNA-seq: challenges and strategies for data analysis
Finotello, F., & Camillo, B. D. (2014) · Briefings in Functional Genomics · doi:10.1093/bfgp/elu035 · Cited by 253
“In DE analysis, as methods that correct counts for length bias can introduce additional biases [9, 44, 56, 61], normalizations that apply to DE test statistics while leaving gene counts unchanged have been proposed [9, 64].”
MethodEvaluating Gene Expression in C57BL/6J and DBA/2J Mouse Striatum Using RNA-Seq and Microarrays
Bottomly, D., Walter, N. A. R., Hunter, J. E., Darakjian, P., Kawane, S., Buck, K. J., Searles, R. P., Mooney, M. A., McWeeney, S. K., & HITZEMANN, R. J. (2011) · PLoS ONE · doi:10.1371/journal.pone.0017820 · Cited by 229
“contrary to what had been seen previously [19,43].”
ResultDesign and validation issues in RNA-seq experiments
Fang, Z., & Cui, X. (2011) · Briefings in Bioinformatics · doi:10.1093/bib/bbr004 · Cited by 243
“This nature makes the comparison across samples more efficient for longer transcripts than shorter ones [40, 53].”
BackgroundEpigenome-wide association studies: current knowledge, strategies and recommendations
Campagna, M. P., Xavier, A., Lechner‐Scott, J., Maltby, V., Scott, R. J., Butzkueven, H., Jokubaitis, V., & Lea, R. A. (2021) · Clinical Epigenetics · doi:10.1186/s13148-021-01200-8 · Cited by 245
“Of these three algorithms, the Fisher exact test is the only one that fails to account for gene length bias; a phenomenon where longer genes are overrepresented in GSEA results, as they contain more CpGs than shorter genes [79].”
Backgroundon behalf of the MATCH study group, Smid, M., van den Braak, R. R. J. C., van de Werken, H. J. G., van Riet, J., van Galen, A., de Weerd, V., van der Vlugt‐Daane, M., Bril, S. I., Lalmahomed, Z. S., et al. (2018) · BMC Bioinformatics · doi:10.1186/s12859-018-2246-7 · Cited by 217
“The most commonly used normalization method that includes gene length correction is TPM (Transcripts Per kilobase Million) [9], as other methods like RPKM [1]/ FPKM [10] (Reads/Fragments Per Kilobase per Million reads, respectively, proved to be inadequate and biased [5, 6, 11, 12].”
MethodFunctional Enrichment Analysis of Regulatory Elements
García-Moreno, A., López-Domínguez, R., Villatoro-García, J. A., Ramírez‐Mena, A., Aparicio‐Puerta, E., Hackenberg, M., Pascual-Montano, A., & Carmona‐Sáez, P. (2022) · Biomedicines · doi:10.3390/biomedicines10030590 · Cited by 222
Next generation sequencing of microbial transcriptomes: challenges and opportunities
van Vliet, A. H. M. (2009) · FEMS Microbiology Letters · doi:10.1111/j.1574-6968.2009.01767.x · Cited by 204
Promoters maintain their relative activity levels under different growth conditions
Keren, L., Zackay, O., Lotan‐Pompan, M., Barenholz, U., Dekel, E., Sasson, V., Aidelberg, G., Bren, A., Zeevi, D., Weinberger, A., et al. (2013) · Molecular Systems Biology · doi:10.1038/msb.2013.59 · Cited by 198
“required by other high-throughput measurement systems, such as microarrays or sequencing (Churchill, 2002; Marshall, 2004; Frantz, 2005; Bammler et al, 2005; Tang et al, 2007; Balázsi and Oltvai, 2007; Oshlack and Wakefield, 2009).”
MethodRobles, J. A., Qureshi, S. E., Stephen, S. J., Wilson, S. R., Burden, C. J., & Taylor, J. M. (2012) · BMC Genomics · doi:10.1186/1471-2164-13-484 · Cited by 198
“It has been shown that these abundance measures are prone to biases correlated with the nucleotide composition [14,17] and length of the transcript [1,18].”
Estimation of alternative splicing isoform frequencies from RNA-Seq data
Nicolae, M., Mangul, S., Măndoiu, I. I., & Zelikovsky, A. (2011) · Algorithms for Molecular Biology · doi:10.1186/1748-7188-6-9 · Cited by 178
“Estimating isoform expression levels based solely on unambiguous reads, as suggested, e.g., in [2], results in splicing-depen-dent biases similar to the transcript-length bias noted in [11], further complicating the design of unbiased differential expression tests based on RNA-Seq data.”
BackgroundClassification and clustering of sequencing data using a Poisson model
Witten, D. (2011) · The Annals of Applied Statistics · doi:10.1214/11-aoas493 · Cited by 186
“It is known that RNA-sequencing data suffer from transcript length bias—that is, longer transcripts tend to result in a greater number of reads, resulting in an increased tendency to call such transcripts differentially expressed [Oshlack and Wakefield (2009)].”
BackgroundQuantification of the yeast transcriptome by single-molecule sequencing
Lipson, D., Raz, T., Kieu, A., Jones, D. R., Giladi, E., Thayer, E. C., Thompson, J. F., Letovsky, S., Milos, P. M., & Causey, M. (2009) · Nature Biotechnology · doi:10.1038/nbt.1551 · Cited by 187
“, and quantification accuracy for shorter transcripts is lowe”
BackgroundCreating reference gene annotation for the mouse C57BL6/J genome assembly
Mudge, J. M., & Harrow, J. (2015) · Mammalian Genome · doi:10.1007/s00335-015-9583-x · Cited by 173
“However, while the number of RNAseq reads available already runs into the hundreds of millions, concerns have been raised about the power of this technique to find transcripts with very low expression levels (Oshlack and Wakefield 2009).”
BackgroundCieslik, M. P., Chugh, R. K., Wu, Y.-M., Wu, M., Brennan, C. A., Lonigro, R. J., Su, F., Wang, R., Siddiqui, J., Mehra, R., et al. (2015) · Genome Research · doi:10.1101/gr.189621.115 · Cited by 174
Cell‐type specific analysis of translating RNAs in developing flowers reveals new levels of control
Jiao, Y., & Meyerowitz, E. M. (2010) · Molecular Systems Biology · doi:10.1038/msb.2010.76 · Cited by 176
“To alleviate the bias in the detection of differential expression influenced by the transcript length (Oshlack and Wakefield, 2009; Young et al, 2010), we added the expression ratio cutoff (two-fold).”
Transforming RNA-Seq Data to Improve the Performance of Prognostic Gene Signatures
Zwiener, I., Frisch, B., & Binder, H. (2014) · PLoS ONE · doi:10.1371/journal.pone.0085150 · Cited by 165
“Genes with unknown gene length were excluded (n = 680), because there might be gene length effects [25] and we need them later in the simulation study.”
BackgroundBias detection and correction in RNA-Sequencing data
Zheng, W., Chung, L. M., & Zhao, H. (2011) · BMC Bioinformatics · doi:10.1186/1471-2105-12-290 · Cited by 169
“found transcript length biases in RNA-Seq data [9].”
BackgroundZouari, I., Salvioli, A., Chialva, M., Novero, M., Miozzi, L., Tenore, G. C., Bagnaresi, P., & Bonfante, P. (2014) · BMC Genomics · doi:10.1186/1471-2164-15-221 · Cited by 161
“As in all RNASeq experiments, the variable length of transcripts may produce biases in the data [23]; therefore, we analyzed GO enrichment via the Goseq R package, which was specifically designed to limit bias in the data [24].”
MethodNext-generation sequencing technologies for gene expression profiling in plants
Jain, M. (2011) · Briefings in Functional Genomics · doi:10.1093/bfgp/elr038 · Cited by 166
“a completely unbiased measure of the expression level due to different transcript length and/or overrepresentation of 50- or 30-ends of the transcripts [13, 40].”
BackgroundRNA-seq and microarray complement each other in transcriptome profiling
Kogenaru, S., Yan, Q., Guo, Y., & Wang, N. (2012) · BMC Genomics · doi:10.1186/1471-2164-13-629 · Cited by 157
“Several studies have begun to investigate on the parameters like sequencing depth, precision, GC bias, length bias, lane effects, and processing artifacts [16,29,48,75-77].”
BackgroundFoley, J. W., Zhu, C., Jolivet, P., Zhu, S., Lu, P., Meaney, M. J., & West, R. B. (2019) · Genome Research · doi:10.1101/gr.234807.118 · Cited by 146
RNA-Seq: revelation of the messengers
Verk, M. C. V., Hickman, R. J., Pieterse, C. M. J., & Wees, S. C. M. V. (2013) · Trends in Plant Science · doi:10.1016/j.tplants.2013.02.001 · Cited by 156
“Although RPKM/FPKM is a popular normalization strategy, it has been demonstrated to bias subsequent calls for differential expression in favor of longer transcripts [11].”
RNA Sequencing Data: Hitchhiker's Guide to Expression Analysis
den Berge, K. V., Hembach, K., Soneson, C., Tiberi, S., Clement, L., Love, M. I., Patro, R., & Robinson, M. D. (2019) · Annual Review of Biomedical Data Science · doi:10.1146/annurev-biodatasci-072018-021255 · Cited by 153
“Figure 3 highlights that more than 80% of reads are attributed to the 10% most expressed genes, acknowledging that transcript length also plays a role [22] .”
BackgroundŁabaj, P. P., Leparc, G. G., Linggi, B. E., Markillie, L. M., Wiley, H. S., & Kreil, D. P. (2011) · Bioinformatics · doi:10.1093/bioinformatics/btr247 · Cited by 141
“While systemic deviations due to length bias, lane effects, and processing artefacts are increasingly being investigated (Bullard et al., 2010; Marioni et al., 2008; Oshlack and Wakefield, 2009), reproducibility has in general received much less attention.”
Liu, S., Lin, L., Jiang, P., Wang, D., & Xing, Y. (2011) · Nucleic Acids Research · doi:10.1093/nar/gkq817 · Cited by 146
“Recent work on RNA-Seq has revealed a potential detection bias toward differential expression of genes with long transcripts (36).”
BackgroundBradford, J. R., Hey, Y., Yates, T., Li, Y., Pepper, S. D. V., & Miller, C. J. (2010) · BMC Genomics · doi:10.1186/1471-2164-11-282 · Cited by 145
“Simply dividing read counts by exon length does not correct for this [26], and the use of AC would then be inappropriate since the data would no longer be Poisson-distributed.”
RNA-seq data science: From raw data to effective interpretation
Deshpande, D., Chhugani, K., Chang, Y., Karlsberg, A., Loeffler, C., Zhang, J., Muszyńska, A., Munteanu, V., Yang, H. T., Rotman, J., et al. (2023) · Frontiers in Genetics · doi:10.3389/fgene.2023.997383 · Cited by 158
“RNA-seq analysis requires specialized computational tools that can account for the shortcomings of sequencing technologies, including the generation of sequencing errors (Le et al., 2013), length biases (Oshlack and Wake fi eld, 2009), and fragmentation (Tuerk et al., 2017).”
MethodPredictability of human differential gene expression
Crow, M., Lim, N., Ballouz, S., Pavlidis, P., & Gillis, J. (2019) · Proceedings of the National Academy of Sciences · doi:10.1073/pnas.1802973116 · Cited by 117
“Clusters of similar DE hit lists were defined by first performing hierarchical clustering of Euclidean distances with average linkage, then using the cutreeDynamicmethod (22) with the following parameter settings: deepsplit= 2, minClusterSize = 10, and pamRespectsDendro = FALSE.”
BackgroundMethodComparison of normalization methods for differential gene expression analysis in RNA-Seq experiments
Maza, É., Frasse, P., Senin, P., Bouzayen, M., & Zouine, M. (2013) · Communicative & Integrative Biology · doi:10.4161/cib.25849 · Cited by 145
Using metagenomics to investigate human and environmental resistomes
Bengtsson‐Palme, J., Larsson, D. G. J., & Kristiansson, E. (2017) · Journal of Antimicrobial Chemotherapy · doi:10.1093/jac/dkx199 · Cited by 140
goseq: Gene Ontology testing for RNA-seq datasets
Young, M. D., Davidson, N., Wakeeld, M. J., Smyth, G. K., & Oshlack, A. (2014) · Cited by 132
Self-citationGene-set analysis is severely biased when applied to genome-wide methylation data
Geeleher, P., Hartnett, L., Egan, L. J., Golden, A., Ali, R. A. R., & Seoighe, C. (2013) · Bioinformatics · doi:10.1093/bioinformatics/btt311 · Cited by 128
“The application of GSA to lists of genes found to be differentially expressed between groups of samples using RNA-seq is known to be affected by such a bias (Oshlack and Wakefield, 2009).”
MethodCharacterizing natural variation using next-generation sequencing technologies
Gilad, Y., Pritchard, J. K., & Thornton, K. (2009) · Trends in Genetics · doi:10.1016/j.tig.2009.09.003 · Cited by 130
A protocol to evaluate RNA sequencing normalization methods
Abrams, Z. B., Johnson, T. S., Huang, K., Payne, P., & Coombes, K. R. (2019) · BMC Bioinformatics · doi:10.1186/s12859-019-3247-x · Cited by 129
3′-End Sequencing for Expression Quantification (3SEQ) from Archival Tumor Samples
Beck, A. H., Weng, Z., Witten, D., Zhu, S., Foley, J. W., Lacroute, P., Smith, C. L., Tibshirani, R. J., van de Rijn, M., Sidow, A., et al. (2010) · PLoS ONE · doi:10.1371/journal.pone.0008768 · Cited by 126
“Standard RNA-Seq has been applied to mutation identification and transcriptional profiling.”
MethodInfluentialMaking the most of drought and salinity transcriptomics
Deyholos, M. K. (2009) · Plant Cell & Environment · doi:10.1111/j.1365-3040.2009.02092.x · Cited by 124
“For example, an unexplained bias towards increased variance in RNA-Seq quantification of smaller transcripts was recently reported (Oshlack &Wakefield 2009).”
Exploring plant transcriptomes using ultra high-throughput sequencing
Wang, L., Li, P., & Brutnell, T. P. (2010) · Briefings in Functional Genomics · doi:10.1093/bfgp/elp057 · Cited by 125
“Oshlack and colleagues [85] have reevaluated some published data, which demonstrated that the differences in statistical power rely on the chances of a read to hit a certain gene.”
BackgroundMethodAnalysis and correction of compositional bias in sparse sequencing count data
Kumar, M. S. B., SLUD, E. V., Okrah, K., Hicks, S. C., Hannenhalli, S. S., & Bravo, H. C. (2018) · BMC Genomics · doi:10.1186/s12864-018-5160-5 · Cited by 123
“As noted previously in the literature [11, 12, 13, 14] (illustrated in Fig.”
BackgroundAging is associated with a systemic length-associated transcriptome imbalance
Stoeger, T., Grant, R. A., McQuattie‐Pimentel, A. C., Anekalla, K. R., Liu, S. S., Navarro, H. T., Singer, B. D., Abdala‐Valencia, H., Schwake, M., Tétreault, M., et al. (2022) · Nature Aging · doi:10.1038/s43587-022-00317-6 · Cited by 129
Comparison and calibration of transcriptome data from RNA-Seq and tiling arrays
Agarwal, A., Koppstein, D., Rozowsky, J. S., Sboner, A., Habegger, L., Hillier, L., Sasidharan, R., Reinke, V., Waterston, R., & Gerstein, M. (2010) · BMC Genomics · doi:10.1186/1471-2164-11-383 · Cited by 127
“However, it has recently been demonstrated that transcript length affects differential expression analysis [47].”
A powerful and flexible approach to the analysis of RNA sequence count data
Zhou, Y., Xia, K., & Wright, F. A. (2011) · Bioinformatics · doi:10.1093/bioinformatics/btr449 · Cited by 124
Probabilistic error correction for RNA sequencing
Le, H.-S., Schulz, M. H., McCauley, B. S., Hinman, V. F., & Bar‐Joseph, Z. (2013) · Nucleic Acids Research · doi:10.1093/nar/gkt215 · Cited by 125
“One class of errors concerns biases in the abundance of read sequences due to RNA priming preferences (12,13), fragment size selection (14,15) and GC-content (16).”
Kogelman, L. J. A., Cirera, S., Zhernakova, D. V., Fredholm, M., Franke, L., & Kadarmideen, H. N. (2014) · BMC Medical Genomics · doi:10.1186/1755-8794-7-57 · Cited by 106
“Gene length bias has been shown to be an important bias in RNA-Seq, as longer genes will be sequenced deeper than shorter genes [31].”
BackgroundMethodThe Impact of Normalization Methods on RNA-Seq Data Analysis
Zyprych-Walczak, J., Szabelska‐Beręsewicz, A., Handschuh, L., Górczak, K., Klamecka, K., Figlerowicz, M., & Siatkowski, I. (2015) · BioMed Research International · doi:10.1155/2015/621690 · Cited by 125
“In particular, these variations include between-sample differences such as library size (sequencing depth) [5] or within-sample differences, for example, in gene length [6], guanine-cytosine (GC) content [7, 8], or unwanted variation introduced by batch effect [9].”
BackgroundHuang, R., Jaritz, M., Guenzl, P. M., Vlatkovic, I., Sommer, A., Tamir, I., Marks, H., Klampfl, T., Královics, R., Stunnenberg, H. G., et al. (2011) · PLoS ONE · doi:10.1371/journal.pone.0027288 · Cited by 112
“It is becoming clear now that differences in template preparation protocols create biases in the detection of gene expression and several bioinformatic applications have been developed to compensate for this bias [16,17].”
BackgroundPROPER: comprehensive power evaluation for differential expression using RNA-seq
Wu, H., Wang, C., & Wu, Z. J. (2014) · Bioinformatics · doi:10.1093/bioinformatics/btu640 · Cited by 114
Schmid, M. W., Schmidt, A., Klostermeier, U. C., Barann, M., Rosenstiel, P. C., & Grossniklaus, U. (2012) · PLoS ONE · doi:10.1371/journal.pone.0029685 · Cited by 108
“However, this would exclude a certain proportion of the data [20].”
BackgroundA normalization strategy for comparing tag count data
Kadota, K., Nishiyama, T., & Shimizu, K. (2012) · Algorithms for Molecular Biology · doi:10.1186/1748-7188-7-5 · Cited by 108
“Normalization by gene length is important for comparing different genes within a sample because longer genes tend to have more reads to be sequenced [6].”
BackgroundLamarre, S., Frasse, P., Zouine, M., Labourdette, D., Sainderichin, E., Hu, G., Berre, V. L., Bouzayen, M., & Maza, É. (2018) · Frontiers in Plant Science · doi:10.3389/fpls.2018.00108 · Cited by 106
“…lengths and sequencing depths, non-uniformity of read distributions along transcripts and strong sample-specific GC-content effect (Mortazavi et al., 2008; Oshlack and Wakefield, 2009; Zenoni et al., 2010; Risso et al., 2011; Roberts et al., 2011; Tarazona et al., 2011; Hansen et al., 2012).”
BackgroundJohnson, K. A., & Krishnan, A. (2022) · Genome biology · doi:10.1186/s13059-021-02568-9 · Cited by 111
“As gene length biases both gene counts and their downstream analysis [26], it is not very surprising that TPM usually outperforms CPM, as CPM only corrects for library size”
BackgroundEvaluation of normalization methods in mammalian microRNA-Seq data
Garmire, L. X., & Subramaniam, S. (2012) · RNA · doi:10.1261/rna.030916.111 · Cited by 108
“Additionally, mRNA-Seq is known to have gene-length bias toward genes of larger lengths, and the within-library normalization to normalize individual genes within the same libarary was proposed (Oshlack and Wakefield 2009).”
BackgroundMa, F., Fuqua, B. K., Hasin-Brumshtein, Y., Yukhtman, C., Vulpe, C. D., Lusis, A. J., & Pellegrini, M. A. (2019) · BMC Genomics · doi:10.1186/s12864-018-5393-3 · Cited by 104
Buschmann, D., Haberberger, A., Kirchner, B., Spornraft, M., Riedmaier, I., Schelling, G., & Pfaffl, M. W. (2016) · Nucleic Acids Research · doi:10.1093/nar/gkw545 · Cited by 102
“Variation introduced by different gene lengths (195), as is frequently encountered in sequencings of longer RNAs, has a negligible effect.”
BackgroundGeneral lack of global dosage compensation in ZZ/ZW systems? Broadening the perspective with RNA-seq
Wolf, J. B. W., & Bryk, J. (2011) · BMC Genomics · doi:10.1186/1471-2164-12-91 · Cited by 101
“[28]] and that accuracy depends on proper mapping and coverage, and that GC”
BackgroundIdentification and characterization of microRNAs in Phaseolus vulgaris by high-throughput sequencing
Peláez, P., Trejo, M. S., Iñiguez, L., Estrada‐Navarrete, G., Covarrubias, A. A., Reyes, J. L., & Sánchez, F. (2012) · BMC Genomics · doi:10.1186/1471-2164-13-83 · Cited by 101
“Although deep-sequencing experiments have become the major source supporting microRNA annotations, technical variations, transcript length bias and mapping bias have been reported with this approach for transcriptome analysis of coding RNAs (mRNAs) [17,55,56].”
BackgroundSequencing and characterization of the guppy (Poecilia reticulata) transcriptome
Fraser, B. A., Weadick, C. J., Janowitz, I., Rodd, F. H., & Hughes, K. A. (2011) · BMC Genomics · doi:10.1186/1471-2164-12-202 · Cited by 101
“We also found little bias in favour of detecting differential expression for longer genes or reference sequences, as has been reported in some studies [31].”
ResultJeukens, J., Renaut, S., St‐Cyr, J., Nolte, A. W., & Bernatchez, L. (2010) · Molecular Ecology · doi:10.1111/j.1365-294x.2010.04934.x · Cited by 96
“…of bias in gene expression estimates based on next-generation sequencing data are not yet fully understood, it is becoming clear that base composition, library preparation and transcript length all have an impact on RNA-Seq data (Marioni et al. 2008; Gilad et al. 2009; Oshlack & Wakefield 2009).”
BackgroundRNA-seq of human reference RNA samples using a thermostable group II intron reverse transcriptase
Nottingham, R. M., Wu, D. C., Qin, Y., Yao, J., Hunicke‐Smith, S., & Lambowitz, A. M. (2016) · RNA · doi:10.1261/rna.055558.115 · Cited by 103
“…somewhat shorter RNA fragment size in the TGIRT-seq libraries, which results in more frequent sampling across RNA molecules (Mortazavi et al. 2008; Oshlack and Wakefield 2009), and the high processivity and strand displacement of the TGIRT enzyme operating at 60°C, which enables it to reverse…”
McGivney, B. A., McGettigan, P., Browne, J. A., Evans, A. C. O., Fonseca, R. G., Loftus, B., Lohan, A. J., MacHugh, D. E., Murphy, B. A., Katz, L. M., et al. (2010) · BMC Genomics · doi:10.1186/1471-2164-11-398 · Cited by 97
“RNAseq), which generate longer tags, can overcome this limitation but they introduce new problems, the most important of which is multiple tags per transcript and a bias towards highly expressed long transcripts [55].”
BackgroundKuo, M., Liu, S. C.-H., Hsu, Y.-F., & Wu, R. (2021) · Journal of Biomedical Science · doi:10.1186/s12929-021-00775-x · Cited by 99
“To accurately estimate gene expression, read counts must be normalized to correct for systematic variability, such as library fragment size and read depth [97, 140, 158].”
BackgroundChoi, Y.-J., Ghedin, E., Berriman, M., Keane, J. A., Holroyd, N. E., Mayhew, G. F., Christensen, B. M., & Michalski, M. L. (2011) · PLoS neglected tropical diseases · doi:10.1371/journal.pntd.0001409 · Cited by 95
“Because longer transcripts give more statistical power for detecting differential expression between samples [12], Gene Ontology (GO) analysis was performed using the goseq package that adjusts transcript length bias in deep sequencing data [13].”
Quinn, T. P., Crowley, T. M., & Richardson, M. F. (2018) · BMC Bioinformatics · doi:10.1186/s12859-018-2261-8 · Cited by 96
“In addition, RNA-Seq has two notable sources of bias that an analyst may need to address: transcripts with longer lengths [4] and higher GC content [5] have their relative abundances over-estimated.”
BackgroundGene length and detection bias in single cell RNA sequencing protocols
Phipson, B., Zappia, L., & Oshlack, A. (2017) · F1000Research · doi:10.12688/f1000research.11290.1 · Cited by 74
“When cDNAs are fragmented, long genes result in more fragments for the same number of transcripts, resulting in higher counts and more power to detect differential expression (Oshlack & Wakefield, 2009).”
BackgroundSelf-citationThe quest for absolute abundance: The use of internal standards for DNA‐based community ecology
Harrison, J. G., Calder, W. J., Shuman, B. N., & Buerkle, C. A. (2020) · Molecular Ecology Resources · doi:10.1111/1755-0998.13247 · Cited by 98
“…Pollock, Glendinning, Wisedchanwet, & Watson, 2018; Schori, Appel, Kitko, & Showalter, 2013), cycle count (Kelly et al., 2019; Silverman et al., 2019), GC content (Laursen, Dalgaard, & Bahl, 2017; Risso, Schwartz, Sherlock, & Dudoit, 2011), and length of the amplicon (Oshlack & Wakefield, 2009).”
Metadata
- Authors
- Oshlack, A., & Wakefield, M. J.
- Affiliations
- Walter and Eliza Hall Institute of Medical Research (AU)
- Corresponding author
- Oshlack, Alicia
- Venue
- Biology Direct
- Published
- 2009
- Volume
- 4
- Issue
- 1
- Pages
- 14
- ISSN
- 1745-6150 (ISSN-L)
- PMC
- PMC2678084
- OpenAlex
- W2114504176
- Cited by
- 497
- References
- 12
- Citations by year
- 2026: 6 · 2025: 8 · 2024: 16 · 2023: 14 · 2022: 24 · 2021: 35 · 2020: 12 · 2019: 29 · 2018: 30 · 2017: 36 · 2016: 33 · 2015: 39 · 2014: 39 · 2013: 37 · 2012: 44
- FWCI
- 18.63
- Type
- journal article
- Language
- en
- Open access
- gold
- doi.org
- Licence
- cc-by
- Locations
- Biology Direct (publishedVersion, cc-by)
- PubMed Central (publishedVersion, cc-by)
- PubMed (publishedVersion)
- Minerva Access (University of Melbourne) (submittedVersion, cc-by)
- DOAJ (DOAJ: Directory of Open Access Journals) (submittedVersion)
- Topics
- Life Sciences › Biochemistry, Genetics and Molecular Biology › Molecular Biology › Genomics and Phylogenetic Studies
- Life Sciences › Biochemistry, Genetics and Molecular Biology › Molecular Biology › Gene expression and cancer classification
- Life Sciences › Biochemistry, Genetics and Molecular Biology › Molecular Biology › Bioinformatics and Genomic Networks
- Keywords
- RNA-seq, differentially expressed genes, gene expression profiling, pathway analysis, systems biology
- MeSH terms
- Base Sequence, Humans, RNA, Messenger, Transcription, Genetic, Bias, Oligonucleotide Array Sequence Analysis, Gene Expression Profiling, Systems Biology
About these checks
Registry, retraction, Cites and statistics results are computed, not judged, with one exception: a printed reference that no index lists is read once by a model before it counts as a citation error. Claims are extracted by a model and kept only when their quote appears verbatim in the text; each cited source is then checked, with a model’s help, for whether it says what the claim relies on. Those verdicts can be wrong — read the claim’s quote and the cited source before relying on one.
Statistics and arithmetic are recomputed, not judged.
Confidence bands are shown only for fields calibrated on our annotated test set. None is calibrated yet, so no band is shown.
What counts as a claim ›How we measure confidence ›How we check this ›
Are you an author, or do you see a problem with this page? Request a review
