

The DOI matches its Crossref record; 55 of the 55 references it cites were found in a registry or an index.
Network methods for describing sample relationships in genomic datasets: application to Huntington’s disease
Open accessAbstract
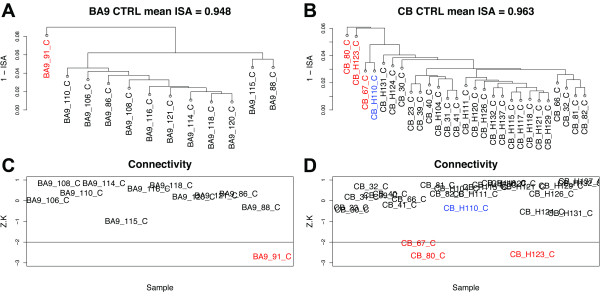
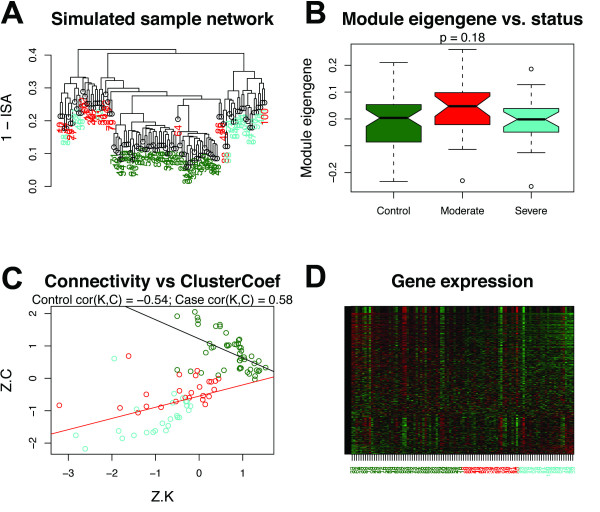
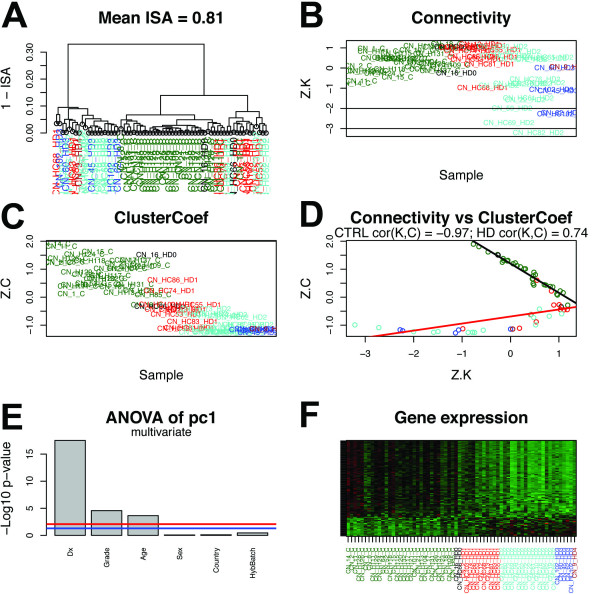
BACKGROUND: Genomic datasets generated by new technologies are increasingly prevalent in disparate areas of biological research. While many studies have sought to characterize relationships among genomic features, commensurate efforts to characterize relationships among biological samples have been less common. Consequently, the full extent of sample variation in genomic studies is often under-appreciated, complicating downstream analytical tasks such as gene co-expression network analysis. RESULTS: Here we demonstrate the use of network methods for characterizing sample relationships in microarray data generated from human brain tissue. We describe an approach for identifying outlying samples that does not depend on the choice or use of clustering algorithms. We introduce a battery of measures for quantifying the consistency and integrity of sample relationships, which can be compared across disparate studies, technology platforms, and biological systems. Among these measures, we provide evidence that the correlation between the connectivity and the clustering coefficient (two important network concepts) is a sensitive indicator of homogeneity among biological samples. We also show that this measure, which we refer to as cor(K,C), can distinguish biologically meaningful relationships among subgroups of samples. Specifically, we find that cor(K,C) reveals the profound effect of Huntington's disease on samples from the caudate nucleus relative to other brain regions. Furthermore, we find that this effect is concentrated in specific modules of genes that are naturally co-expressed in human caudate nucleus, highlighting a new strategy for exploring the effects of disease on sets of genes. CONCLUSIONS: These results underscore the importance of systematically exploring sample relationships in large genomic datasets before seeking to analyze genomic feature activity. We introduce a standardized platform for this purpose using freely available R software that has been designed to enable iterative and interactive exploration of sample networks.
Overview
The claims and statistics of this paper haven’t been checked yet.
Free: it reads the open-access text and checks the first 5 claims that cite a source we can check. Create a free account to check every claim.
Integrity signals
Registry
Cites
Statistics
Figures


Verification
Claims the paper makes
The claims and statistics of this paper haven’t been checked yet.
Free: it reads the open-access text and checks the first 5 claims that cite a source we can check. Create a free account to check every claim.
Claims other papers make about this one
Each is checked against this paper’s own text: does it say what the citing paper says it does?
The source backs part of the claim, not all of it — or backs it for a different population, condition or comparison.
In the citing paper
“Outlier samples were removed as described (Oldham et al., 2012), using the Euclidean distance-based sample connectivity Z.k threshold of −6.”
From Elevated TREM2 Gene Dosage Reprograms Microglia Responsivity and Ameliorates Pathological Phenotypes in Alzheimer’s Disease Models (2018) · cites this paper as Oldham et al., 2012
Experimental — accuracy not yet measured
Self-check
Percentages, sums and reported differences re-computed from the paper’s own numbers.
The self-check needs the paper’s full text.
Citations
Cites
Controlling the False Discovery Rate: A Practical and Powerful Approach to Multiple Testing
Benjamini, Y., & Hochberg, Y. (1995) · Journal of the Royal Statistical Society Series B: Statistical Methodology · doi:10.1111/j.2517-6161.1995.tb02031.x · Cited by 109,482
Collective dynamics of ‘small-world’ networks
Watts, D. J., & Strogatz, S. H. (1998) · Nature · doi:10.1038/30918 · Cited by 43,060
WGCNA: an R package for weighted correlation network analysis
Langfelder, P., & Horvath, S. (2008) · BMC Bioinformatics · doi:10.1186/1471-2105-9-559 · Cited by 27,252
Self-citationBioconductor: open software development for computational biology and bioinformatics
Gentleman, R. C., Carey, V. J., Bates, D. M., Bolstad, B., Dettling, M., Dudoit, S., Ellis, B., Gautier, L., Ge, Y., Gentry, J., et al. (2004) · Genome Biology · doi:10.1186/gb-2004-5-10-r80 · Cited by 12,172
Adjusting batch effects in microarray expression data using empirical Bayes methods
Johnson, W. E., Li, C., & Rabinovic, A. (2007) · Biostatistics · doi:10.1093/biostatistics/kxj037 · Cited by 8,658
MACDONALD, M. (1993) · Cell · doi:10.1016/0092-8674(93)90585-e · Cited by 8,366
Bolstad, B. M., Irizarry, R. A., Åstrand, M., & Speed, T. P. (2003) · Bioinformatics · doi:10.1093/bioinformatics/19.2.185 · Cited by 8,266
Network motifs: simple building blocks of complex networks.
Milo, R., Shen-Orr, S., Itzkovitz, S., Kashtan, N., Chklovskii, D., & Alon, U. (2002) · Science · doi:10.1126/science.298.5594.824 · Cited by 7,368 · cited 1×
“Motifs, or sub-graphs, describe basic interaction patterns among small groups of nodes [38,39].”
BackgroundA General Framework for Weighted Gene Co-Expression Network Analysis
Zhang, B., & Horvath, S. (2005) · Statistical Applications in Genetics and Molecular Biology · doi:10.2202/1544-6115.1128 · Cited by 5,684
Self-citationaffy—analysis of Affymetrix GeneChip data at the probe level
Gautier, L., Cope, L., Bolstad, B. M., & Irizarry, R. A. (2004) · Bioinformatics · doi:10.1093/bioinformatics/btg405 · Cited by 5,218
Cited by
Transcriptome-wide isoform-level dysregulation in ASD, schizophrenia, and bipolar disorder
Gandal, M. J., Zhang, P., Hadjimichael, E., Walker, R. L., Chen, C., Liu, S., Won, H., van Bakel, H., Varghese, M., Wang, Y., et al. (2018) · Science · doi:10.1126/science.aat8127 · Cited by 1,247
Shared molecular neuropathology across major psychiatric disorders parallels polygenic overlap
Gandal, M. J., Haney, J. R., Parikshak, N. N., Leppa, V., Ramaswami, G., Hartl, C., Schork, A. J., Appadurai, V., Buil, A., Werge, T. M., et al. (2018) · Science · doi:10.1126/science.aad6469 · Cited by 1,095
Self-citationMolecular Identity of Human Outer Radial Glia during Cortical Development
Pollen, A. A., Nowakowski, T. J., Chen, J., Retallack, H., Sandoval-Espinosa, C., Nicholas, C. R., Shuga, J., Liu, S. J., Oldham, M. C., Diaz, A., et al. (2015) · Cell · doi:10.1016/j.cell.2015.09.004 · Cited by 908
Self-citationChromosome conformation elucidates regulatory relationships in developing human brain
Won, H., de la Torre-Ubieta, L., Stein, J. L., Parikshak, N. N., Huang, J., Opland, C. K., Gandal, M. J., Sutton, G. J., Hormozdiari, F., Lu, D., et al. (2016) · Nature · doi:10.1038/nature19847 · Cited by 584
Reliability of human cortical organoid generation
Yoon, S.-J., Elahi, L. S., Pașca, A. M., Marton, R. M., Gordon, A., Revah, O., Miura, Y., Walczak, E. M., Holdgate, G. M., Fan, H. C., et al. (2019) · Nature Methods · doi:10.1038/s41592-018-0255-0 · Cited by 507
Metadata
- Authors
- Oldham, M. C., Langfelder, P., & Horvath, S.
- Affiliations
- University of California, San Francisco (US)
- University of California, Los Angeles (US)
- Corresponding author
- Oldham, Michael C
- Horvath, Steve
- Venue
- BMC Systems Biology
- Published
- 2012
- Volume
- 6
- Issue
- 1
- Pages
- 63
- ISSN
- 1752-0509 (ISSN-L)
- PMC
- PMC3441531
- OpenAlex
- W2108345226
- Cited by
- 154
- References
- 55
- Citations by year
- 2026: 11 · 2025: 8 · 2024: 11 · 2023: 12 · 2022: 12 · 2021: 17 · 2020: 20 · 2019: 12 · 2018: 11 · 2017: 10 · 2016: 9 · 2015: 8 · 2014: 8 · 2013: 3 · 2012: 2
- FWCI
- 2.70
- Type
- journal article
- Language
- en
- Open access
- gold
- doi.org
- Licence
- cc-by
- Locations
- BMC Systems Biology (publishedVersion, cc-by)
- PubMed Central (publishedVersion, cc-by)
- PubMed (publishedVersion)
- eScholarship (California Digital Library) (submittedVersion)
- eScholarship (California Digital Library) (submittedVersion, cc-by)
- Funders
- Sandler Foundation
- National Institutes of Health
- University of California, San Francisco
- National Institute on Drug Abuse (R01DA030913)
- National Cancer Institute (P50CA092131)
- Topics
- Life Sciences › Biochemistry, Genetics and Molecular Biology › Molecular Biology › Gene expression and cancer classification
- Life Sciences › Biochemistry, Genetics and Molecular Biology › Molecular Biology › Bioinformatics and Genomic Networks
- Life Sciences › Biochemistry, Genetics and Molecular Biology › Molecular Biology › Genomics and Phylogenetic Studies
- Keywords
- network metrics, clustering coefficient, connectivity, sample homogeneity, Huntington's disease, caudate nucleus, gene co-expression modules, microarray data, brain tissue
- MeSH terms
- Caudate Nucleus, Gene Expression Regulation, Humans, Huntington Disease, Neurons, Pattern Recognition, Automated, Signal Transduction, Cluster Analysis, Genomics, Gene Regulatory Networks
About these checks
Registry, retraction, Cites and statistics results are computed, not judged, with one exception: a printed reference that no index lists is read once by a model before it counts as a citation error. Claims are extracted by a model and kept only when their quote appears verbatim in the text; each cited source is then checked, with a model’s help, for whether it says what the claim relies on. Those verdicts can be wrong — read the claim’s quote and the cited source before relying on one.
Statistics and arithmetic are recomputed, not judged.
Confidence bands are shown only for fields calibrated on our annotated test set. None is calibrated yet, so no band is shown.
What counts as a claim ›How we measure confidence ›How we check this ›
Are you an author, or do you see a problem with this page? Request a review
How to cite
Cite CoChat for the checks on this page, and the paper for its own findings.
- This page
- CoChat. (2026). Citation check: Network methods for describing sample relationships in genomic datasets: application to Huntington’s disease. https://app.cochat.ai/papers/10.1186/1752-0509-6-63
- The paper
- Oldham, M. C., Langfelder, P., & Horvath, S. (2012). Network methods for describing sample relationships in genomic datasets: application to Huntington’s disease. BMC Systems Biology. https://doi.org/10.1186/1752-0509-6-63
Data sources
Bibliographic data: Semantic Scholar, OpenAlex, Crossref.
Contains information from the Semantic Scholar Academic Graph Datasets, made available under the ODC Attribution License (ODC-BY 1.0).
Semantic Scholar’s data is described in: Kinney, R., et al. (2023). The Semantic Scholar Open Data Platform. arXiv:2301.10140.
