

The DOI matches its Crossref record; 59 of the 59 references it cites were found in a registry or an index.
The unfolded protein response is activated in disease-affected brain regions in progressive supranuclear palsy and Alzheimer’s disease
Open accessAbstract
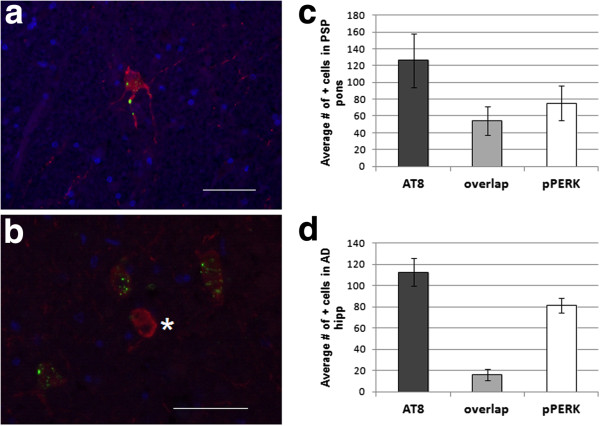
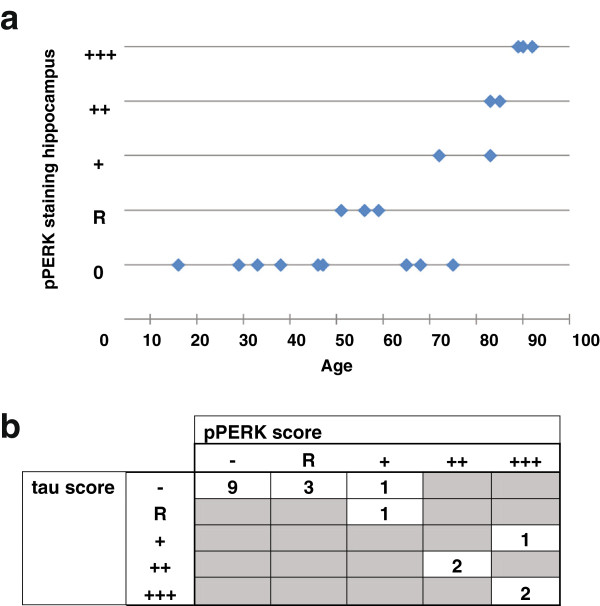
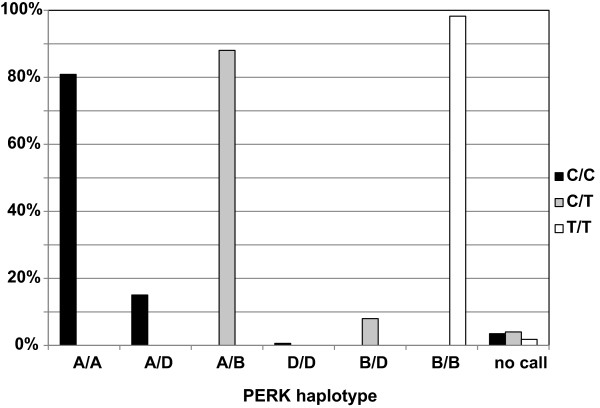
Background: Progressive supranuclear palsy (PSP) is a neurodegenerative disorder pathologically characterized by intracellular tangles of hyperphosphorylated tau protein distributed throughout the neocortex, basal ganglia, and brainstem. A genome-wide association study identified EIF2AK3 as a risk factor for PSP. EIF2AK3 encodes PERK, part of the endoplasmic reticulum’s (ER) unfolded protein response (UPR). PERK is an ER membrane protein that senses unfolded protein accumulation within the ER lumen. Recently, several groups noted UPR activation in Alzheimer’s disease (AD), Parkinson’s disease (PD), amyotrophic lateral sclerosis, multiple system atrophy, and in the hippocampus and substantia nigra of PSP subjects. Here, we evaluate UPR PERK activation in the pons, medulla, midbrain, hippocampus, frontal cortex and cerebellum in subjects with PSP, AD, and in normal controls. Results: We found UPR activation primarily in disease-affected brain regions in both disorders. In PSP, the UPR was primarily activated in the pons and medulla and to a much lesser extent in the hippocampus. In AD, the UPR was extensively activated in the hippocampus. We also observed UPR activation in the hippocampus of some elderly normal controls, severity of which positively correlated with both age and tau pathology but not with Aβ plaque burden. Finally, we evaluated EIF2AK3 coding variants that influence PERK activation. We show that a haplotype associated with increased PERK activation is genetically associated with increased PSP risk. Conclusions: The UPR is activated in disease affected regions in PSP and the genetic evidence shows that this activation increases risk for PSP and is not a protective response.
Overview
The claims and statistics of this paper haven’t been checked yet.
Run the check — free, no account needed. It reads the open-access text and checks the sources it cites.
Integrity signals
Registry
Cites
Statistics
Figures
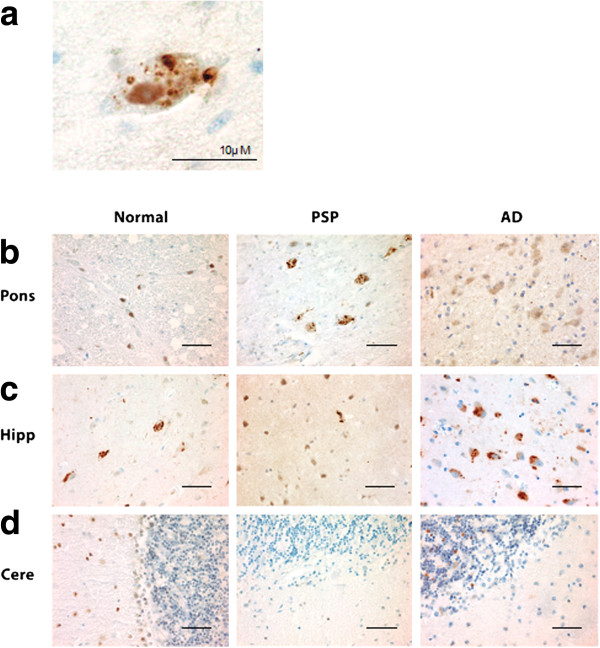
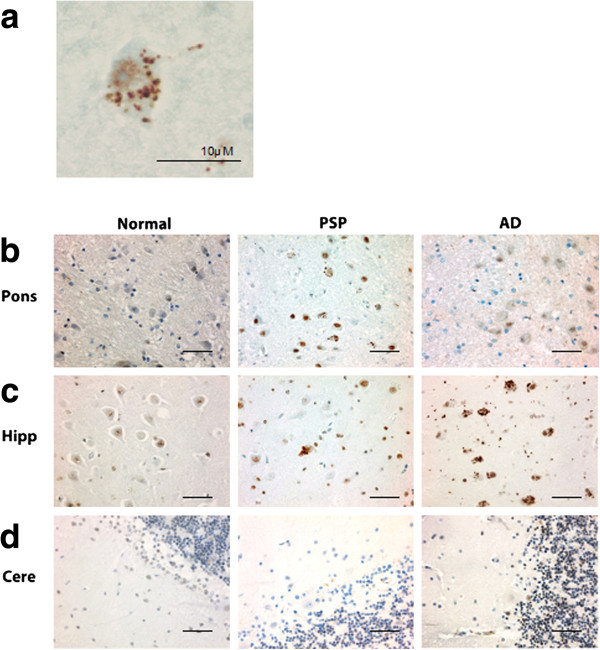
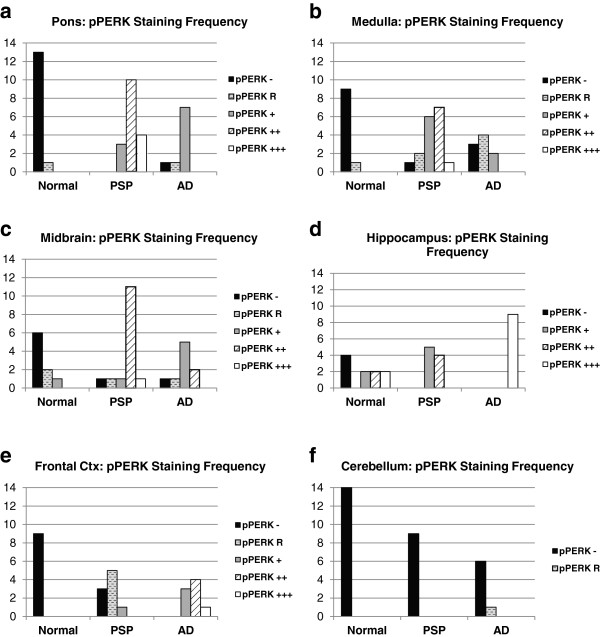
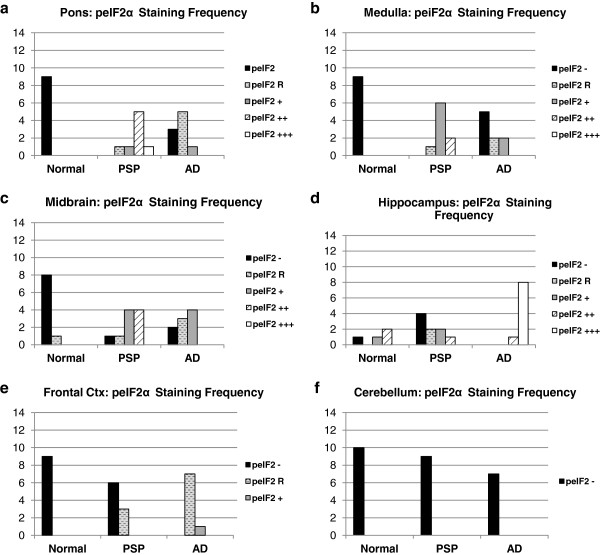
Verification
Claims the paper makes
The claims and statistics of this paper haven’t been checked yet.
Run the check — free, no account needed. It reads the open-access text and checks the sources it cites.
Claims other papers make about this one
Each is checked against this paper’s own text: does it say what the citing paper says it does?
The cited source says what the claim attributes to it.
In the citing paper
“We have previously referred to these topics, but regardless of the disease-specific aggregate, there is evidence of a kind of common final way leading to PERK hyperactivation in disease-affected brain regions [397].”
From GANAB and N-Glycans Substrates Are Relevant in Human Physiology, Polycystic Pathology and Multiple Sclerosis: A Review (2022) · cites this paper as [397]
Self-check
Percentages, sums and reported differences re-computed from the paper’s own numbers.
The self-check needs the paper’s full text.
Citations
Cites
1 retracted
Atkin, J. D., Farg, M. A., Walker, A. K., McLean, C., Tomas, D., & Horne, M. K. (2008) · Neurobiology of Disease · doi:10.1016/j.nbd.2008.02.009 · Cited by 350
RetractedAmyloid oligomers exacerbate tau pathology in a mouse model of tauopathy
Selenica, M.-L. B., Brownlow, M., Jimenez, J. P., Lee, D. C., Pena, G., Dickey, C. A., Gordon, M. N., & Morgan, D. (2013) · Neurodegenerative Diseases · doi:10.1159/000337230 · Cited by 10,359
An integrated map of genetic variation from 1,092 human genomes
The 1000 Genomes Project Consortium (2012) · Nature · doi:10.1038/nature11632 · Cited by 7,711
Signal integration in the endoplasmic reticulum unfolded protein response
Ron, D., & Walter, P. (2007) · Nature Reviews Molecular Cell Biology · doi:10.1038/nrm2199 · Cited by 6,431
The Unfolded Protein Response: From Stress Pathway to Homeostatic Regulation
Walter, P., & Ron, D. (2011) · Science · doi:10.1126/science.1209038 · Cited by 5,897
Mutation of the mouse klotho gene leads to a syndrome resembling ageing
Kuro-o, M., Matsumura, Y., Aizawa, H., Kawaguchi, H., Suga, T., Utsugi, T., Ohyama, Y., Kurabayashi, M., Kaname, T., Kume, E., et al. (1997) · Nature · doi:10.1038/36285 · Cited by 3,837
Neuropathological alterations in Alzheimer disease
Serrano-Pozo, A., Frosch, M. P., Masliah, E., & Hyman, B. T. (2011) · Cold Spring Harbor Perspectives in Medicine · doi:10.1101/cshperspect.a006189 · Cited by 3,345
An Integrated Stress Response Regulates Amino Acid Metabolism and Resistance to Oxidative Stress
Harding, H. P., Zhang, Y., Zeng, H., Novoa, I., Lu, P. D., Calfon, M. A., Sadri, N., Yun, C., Popko, B., Paules, R. S., et al. (2003) · Molecular Cell · doi:10.1016/s1097-2765(03)00105-9 · Cited by 3,336
Braak, H., Alafuzoff, I., Arzberger, T., Kretzschmar, H., & Del Tredici, K. (2006) · Acta Neuropathologica · doi:10.1007/s00401-006-0127-z · Cited by 3,172
Litvan, I., Agid, Y., Calne, D., Campbell, G., Dubois, B., Duvoisin, R. C., Goetz, C. G., Golbe, L. I., Grafman, J., Growdon, J. H., et al. (1996) · Neurology · doi:10.1212/wnl.47.1.1 · Cited by 2,538
Cited by
Sorted by citations
Items 101–196 of 196
Ochiai, T., Nagayama, T., Matsui, K., Amano, K., Sano, T., Wakabayashi, T., & Iwatsubo, T. (2021) · The Journal of Prevention of Alzheimer s Disease · doi:10.14283/jpad.2021.33 · Cited by 23
Neurodegeneration risk factor, EIF2AK3 (PERK), influences tau protein aggregation
Park, G., Xu, K., Chea, L., Kim, K., Safarta, L. A., Song, K., Wu, J., Park, S., Min, H., Hiramatsu, N., et al. (2022) · Journal of Biological Chemistry · doi:10.1016/j.jbc.2022.102821 · Cited by 25
Ethanol-induced PGE2 up-regulates Aβ production through PKA/CREB signaling pathway
Gabr, A. A., Lee, H. J., Onphachanh, X., Jung, Y. H., Kim, J. S., Chae, C. W., & Han, H. J. (2017) · Biochimica et Biophysica Acta (BBA) - Molecular Basis of Disease · doi:10.1016/j.bbadis.2017.06.020 · Cited by 22
Loss of ATG7 in microglia impairs UPR, triggers ferroptosis, and weakens amyloid pathology control
Cai, Z., Wang, S., Cao, S. “., Chen, Y., Penati, S., Peng, V., Yuede, C. M., Beatty, W. L., Lin, K., Zhu, Y., et al. (2025) · The Journal of Experimental Medicine · doi:10.1084/jem.20230173 · Cited by 23
Bussiere, R., Oulès, B., Mary, A., Vaillant-Beuchot, L., Martin, C., Manaa, W. E., Vallée, D., Duplan, E., Paterlini-Bréchot, P., da Costa, C. A., et al. (2019) · Cells · doi:10.3390/cells8121539 · Cited by 21
Altered Proteostasis in Neurodegenerative Tauopathies
Papanikolopoulou, K., & Skoulakis, E. M. C. (2020) · Advances in experimental medicine and biology · doi:10.1007/978-3-030-38266-7_7 · Cited by 23
Muralidharan, C., Huang, F., Enriquez, J. R., Wang, J. E., Nelson, J. B., Nargis, T., May, S. C., Chakraborty, A., Figatner, K. T., Navitskaya, S., et al. (2024) · Journal of Clinical Investigation · doi:10.1172/jci176136 · Cited by 21
Shapira, G., Karmon, G., Hacohen-Kleiman, G., Ganaiem, M., Shazman, S., Theotokis, P., Grigoriadis, N., Shomron, N., & Gozes, I. (2024) · Molecular Psychiatry · doi:10.1038/s41380-024-02879-w · Cited by 19
Otero, A., Betancor, M., Eraña, H., Fernández‐Borges, N., Lucas, J. J., Badiola, J. J., Castilla, J., & Bolea, R. (2021) · International Journal of Molecular Sciences · doi:10.3390/ijms22010465 · Cited by 20
De Masi, R., & Orlando, S. (2022) · International Journal of Molecular Sciences · doi:10.3390/ijms23137373 · Cited by 20
“We have previously referred to these topics, but regardless of the disease-specific aggregate, there is evidence of a kind of common final way leading to PERK hyperactivation in disease-affected brain regions [397].”
BackgroundAmini, J., Sanchooli, N., Milajerdi, M.-H., Baeeri, M., Haddadi, M., & Sanadgol, N. (2023) · International Journal of Neuroscience · doi:10.1080/00207454.2023.2210409 · Cited by 19
Respondek, G., Levin, J., & Höglinger, G. (2018) · Current Opinion in Neurology · doi:10.1097/wco.0000000000000581 · Cited by 15
Modulation of AβPP and GSK3β by Endoplasmic Reticulum Stress and Involvement in Alzheimer’s Disease
Liu, X.-J., Wei, J., Shang, Y., Huang, H., & Lao, F. (2017) · Journal of Alzheimer s Disease · doi:10.3233/jad-161111 · Cited by 18
Overexpression of quality control proteins reduces prion conversion in prion-infected cells
Thapa, S., Abdulrahman, B., Abdelaziz, D. H., Li, L., Aissa, M. B., & Schätzl, H. M. (2018) · Journal of Biological Chemistry · doi:10.1074/jbc.ra118.002754 · Cited by 18
Gao, L., Li, P., Ma, T., Zhong, Z., & Xu, S. (2020) · Phytotherapy Research · doi:10.1002/ptr.6925 · Cited by 18
Amyloid pathology reduces ELP3 expression and tRNA modifications leading to impaired proteostasis
Pereira, M., Ribeiro, D. R., Berg, M., Tsai, A. P., Dong, C., Nho, K. T., Kaiser, S., Moutinho, M., & Soares, A. R. (2023) · Biochimica et Biophysica Acta (BBA) - Molecular Basis of Disease · doi:10.1016/j.bbadis.2023.166857 · Cited by 18
Genetic and Epigenetic Constructs of Progressive Supranuclear Palsy
Debnath, M., Dey, S., Sreenivas, N., Pal, P. K., & Yadav, R. (2022) · Annals of Neurosciences · doi:10.1177/09727531221089396 · Cited by 16
Wiersma, V. I., Hecke, W. V., Scheper, W., van Osch, M., Hermsen, W. J. M., Rozemüller, A. J. M., & Hoozemans, J. J. M. (2016) · Acta Neuropathologica Communications · doi:10.1186/s40478-016-0383-7 · Cited by 15
Disease-modifying strategies in primary tauopathies
Rösler, T. W., Costa, M., & Höglinger, G. U. (2019) · Neuropharmacology · doi:10.1016/j.neuropharm.2019.107842 · Cited by 16
Targeting the Unfolded Protein Response as a Disease-Modifying Pathway in Dementia
Sidhom, E., O'Brien, J. T., Butcher, A. J., Smith, H., Mallucci, G. R., & Underwood, B. R. (2022) · International Journal of Molecular Sciences · doi:10.3390/ijms23042021 · Cited by 15
EIF2AK3 variants in Dutch patients with Alzheimer's disease
Wong, T. H., van der Lee, S. J., van Rooij, J., Meeter, L. H. H., Frick, P., Melhem, S., Seelaar, H., Ikram, M. A., Rozemüller, A. J. M., Holstege, H. H., et al. (2018) · Neurobiology of Aging · doi:10.1016/j.neurobiolaging.2018.08.016 · Cited by 15
Yuen, S. C., Zhu, H., & Leung, S.-W. (2020) · Frontiers in Neuroscience · doi:10.3389/fnins.2020.00209 · Cited by 16
Misfolded protein aggregation and altered cellular pathways in neurodegenerative diseases
Li, H., Yu, Z., & Zhang, W. (2020) · STEMedicine · doi:10.37175/stemedicine.v1i4.63 · Cited by 14
Radford, R. A. W., Rayner, S. L., Szwaja, P., Morsch, M., Cheng, F., Zhu, T., Widagdo, J., Anggono, V., Pountney, D. L., Chung, R. S., et al. (2023) · Journal of Neurochemistry · doi:10.1111/jnc.15796 · Cited by 12
Amyotrophic lateral sclerosis: exploring pathophysiology in the context of treatment
Genge, A. L., Wainwright, S., & Velde, C. V. (2023) · Amyotrophic Lateral Sclerosis and Frontotemporal Degeneration · doi:10.1080/21678421.2023.2278503 · Cited by 13
Carrasco, M., Guzman, L., Olloquequi, J., Cano, A. C., Fortuna, A. C., Vázquez‐Carrera, M., Verdaguer, E., Auladell, C., Ettcheto, M., & Camins, A. (2025) · Molecular Medicine · doi:10.1186/s10020-025-01106-8 · Cited by 12
Bocai, N. I., Marcora, M. S., Belfiori-Carrasco, L. F., Morelli, L., & Castaño, E. M. (2019) · Journal of Alzheimer s Disease · doi:10.3233/jad-181021 · Cited by 12
Yulyaningsih, E., Suh, J. H., Fanok, M. H., Chau, R., Solanoy, H. O., Takahashi, R., Bakardjiev, A. I., Becerra, I. A., Benitez, N. B., Chiu, C., et al. (2023) · eLife · doi:10.7554/elife.92173 · Cited by 14
Endoplasmic reticulum stress and ubiquitin-proteasome system impairment in natural scrapie
Lozada-Ortiz, J. P., Betancor, M., Lázaro, S. P., Bolea, R., Badiola, J. J., & Otero, A. (2023) · Frontiers in Molecular Neuroscience · doi:10.3389/fnmol.2023.1175364 · Cited by 12
Granulovacuolar degeneration bodies are independently induced by tau and α-synuclein pathology
Jorge‐Oliva, M., Smits, J. F. M., Wiersma, V. I., Hoozemans, J. J. M., & Scheper, W. (2022) · Alzheimer s Research & Therapy · doi:10.1186/s13195-022-01128-y · Cited by 13
Wang, J., Cheng, Q., Zhang, Y., Hong, C., Liu, J., Liu, X., & Chang, J. (2023) · Aging and Disease · doi:10.14336/ad.2023.0119 · Cited by 10
Multifactorial etiology of progressive supranuclear palsy (PSP): the genetic component
Müller, U., Höglinger, G. U., & Dickson, D. W. (2025) · Acta Neuropathologica · doi:10.1007/s00401-025-02898-z · Cited by 10
Han, M., Saxton, A. D., Currey, H. N., Waldherr, S. M., Liachko, N. F., & Kraemer, B. C. (2024) · Disease Models & Mechanisms · doi:10.1242/dmm.050473 · Cited by 9
Tau Pathology as a Cause and Consequence of the UPR
Stoveken, B. J. (2013) · Journal of Neuroscience · doi:10.1523/jneurosci.2961-13.2013 · Cited by 9
Waldherr, S. M., Han, M., Saxton, A. D., Vadset, T. A., McMillan, P. J., Wheeler, J., Liachko, N. F., & Kraemer, B. C. (2024) · Communications Biology · doi:10.1038/s42003-024-06570-2 · Cited by 8
ER stress tolerance is regulated by copper-dependent PERK kinase activity
Newton, S. E. B., Shi, X., Beratan, N. R., Perhacs, J., Arya, J., Bond, M. K., Gidalevitz, T., Akay, C., Brady, D. C., & Jordan‐Sciutto, K. L. (2025) · Cell Reports · doi:10.1016/j.celrep.2025.116318 · Cited by 8
Jorge‐Oliva, M., van Weering, J. R. T., & Scheper, W. (2023) · International Journal of Molecular Sciences · doi:10.3390/ijms241310865 · Cited by 6
Lombardozzi, G., Kotzalidis, G. D., Filippis, S. D., Matrone, M., Amici, E., Trovini, G., Perrini, F., Giovanni, A. D., & Giovanetti, V. (2022) · Current Neuropharmacology · doi:10.2174/1570159x20666220310122849 · Cited by 7
Single-cell atlas of progressive supranuclear palsy reveals a distinct hybrid glial cell populationPreprint
Sharma, A., Song, W.-M., Farrell, K., Whitney, K., Zhang, B., Crary, J., & Pereira, A. C. (2021) · bioRxiv · doi:10.1101/2021.04.11.439393 · Cited by 7
PERK-ATAD3A interaction protects mitochondrial proteins synthesis during ER stressPreprint
Hughes, D. T., Brar, K. K., Morris, J. L., Subramanian, K., Krishna, S., Gao, F., Rieder, L.-S., Freeman, J. L., Smith, H., Jukes-Jones, R., et al. (2022) · bioRxiv (Cold Spring Harbor Laboratory) · doi:10.1101/2022.07.24.501280 · Cited by 7
Emerging perspectives in proteostasis: bridging mechanisms and therapeutics for human diseases
Borlepawar, A., Neu, M., Ma, Z., Deshpande, A., Bühringer, H., Hajieva, P., Frey, N., & Rangrez, A. Y. (2026) · Signal Transduction and Targeted Therapy · doi:10.1038/s41392-026-02714-4 · Cited by 7
Proteotoxicity and endoplasmic reticulum stress-mediated cell death
Wang, M., Law, M. E., & Law, B. K. (2021) · Elsevier eBooks · doi:10.1016/b978-0-12-814208-0.00006-3 · Cited by 7
Current Perspectives on Olfactory Loss in Atypical Parkinsonisms—A Review Article
Bochniak, K., Soszyński, M., Madetko‐Alster, N., & Alster, P. (2024) · Biomedicines · doi:10.3390/biomedicines12102257 · Cited by 5
Zhiyan, C., Min, Z., Yida, D., He, C., Hu, X., Yutong, L., Huan, W., & Sun, L. (2024) · Frontiers in Pharmacology · doi:10.3389/fphar.2024.1424803 · Cited by 5
Therapeutic options for Progressive Supranuclear Palsy including investigational drugs
Shoeibi, A., & Litvan, I. (2017) · Expert Opinion on Orphan Drugs · doi:10.1080/21678707.2017.1335596 · Cited by 5
Diagnostic utility of biomarkers in progressive supranuclear palsy: toward a biotyping framework
Ryan, C. B., Camargo, C. J., Salan, T., Pallikkuth, S., Gao, H., & Govind, V. (2025) · Journal of Neurology · doi:10.1007/s00415-025-13539-6 · Cited by 6
Molecular Investigation of the Unfolded Protein Response in Select Human Tauopathies
Pitera, A. P., Hartnell, I. J., Scullard, L., Williamson, K. L., Boche, D., O'Connor, V. M., & Deinhardt, K. (2021) · Journal of Alzheimer s Disease Reports · doi:10.3233/adr-210050 · Cited by 4
Unfolding the Promise of Translational Targeting in Neurodegenerative Disease
Drake, T. M. (2015) · NeuroMolecular Medicine · doi:10.1007/s12017-015-8346-x · Cited by 4
Thomson, S., Waters, K. A., & Machaalani, R. (2021) · Molecular Neurobiology · doi:10.1007/s12035-020-02244-2 · Cited by 4
Smits, J. F. M., Ligthart, T., Jorge‐Oliva, M., Middelhoff, S., Schipper, F., Pita-Illobre, D., Li, K. W., & Scheper, W. (2026) · Science Advances · doi:10.1126/sciadv.aea8940 · Cited by 3
Criado‐Marrero, M., Blazier, D. M., Gould, L. A., Gebru, N. T., Ospina, S. R., Armendariz, D. S., Darling, A. L., Beaulieu‐Abdelahad, D., & Blair, L. J. (2022) · Scientific Reports · doi:10.1038/s41598-022-11025-x · Cited by 3
Ghura, S., Beratan, N. R., Shi, X., Alvarez-Periel, E., Newton, S. E. B., Akay, C., & Jordan‐Sciutto, K. L. (2024) · Scientific Reports · doi:10.1038/s41598-024-74362-z · Cited by 4
Criado‐Marrero, M., Ravi, S., Barroso, D., Garza, T. N., Torres, D. M. C., Lessard, C. B., Castaño, J. P., Bolen, M. L., Rubinovich, U., Prokop, S., et al. (2026) · Neurobiology of Disease · doi:10.1016/j.nbd.2026.107526 · Cited by 2
Clarke, J.-P. W. E., Messmer, M. L., Pilon, J., Reding, J., Thibault, P. A., Salapa, H. E., & Levin, M. C. (2024) · Biochimica et Biophysica Acta (BBA) - Molecular Basis of Disease · doi:10.1016/j.bbadis.2024.167562 · Cited by 2
The Role of the Integrated Stress Response (ISR) in Neuropsychiatric Disorders
Ilyin, N. P., Nikitin, V. S., & Kalueff, A. V. (2024) · Journal of Evolutionary Biochemistry and Physiology · doi:10.1134/s002209302406005x · Cited by 2
Listerin Alleviates Alzheimer's Disease through IRE1‐mediated Decay of TLR4 mRNA
Qin, F., Cao, R., Bai, X., Yuan, J., Sun, W., Zheng, Y., Qi, X., Zhao, W., Liu, B., & Gao, C. (2025) · Advanced Science · doi:10.1002/advs.202414956 · Cited by 2
PKR-like ER kinase (PERK) Haplotypes Are Associated with Depressive Symptoms in People with HIV
Haddadi, S., Jordan-Sciutto, K. L., Akay, C., Grelotti, D., Letendre, S. L., Tang, B., & Ellis, R. J. (2023) · Journal of Neurology and Psychology · doi:10.13188/2332-3469.1000049 · Cited by 2
Rozpędek‐Kamińska, W., Basak, J., Sokołowski, I., Wojtczak, R., Pytel, D., Diehl, J. A., & Majsterek, I. (2019) · Pharmacotherapy in Psychiatry and Neurology · doi:10.33450/fpn.2019.03.003 · Cited by 2
Albert‐Gascó, H., Smith, H., Alvarez‐Castelao, B., Swinden, D., Halliday, M., Janaki‐Raman, S., Butcher, A. J., & Mallucci, G. R. (2023) · bioRxiv (Cold Spring Harbor Laboratory) · doi:10.1101/2023.06.05.543732 · Cited by 2
Yulyaningsih, E., Suh, J. H., Fanok, M. H., Chau, R., Solanoy, H. O., Takahashi, R., Bakardjiev, A. I., Becerra, I. A., Benitez, N. B., Chiu, C., et al. (2023) · eLife · doi:10.7554/elife.92173.1 · Cited by 2
Yulyaningsih, E., Suh, J. H., Fanok, M. H., Chau, R., Solanoy, H. O., Takahashi, R., Bakardjiev, A. I., Becerra, I. A., Benitez, N. B., Chiu, C., et al. (2024) · eLife · doi:10.7554/elife.92173.2 · Cited by 2
The genetic architecture of brainstem structures
Xue, H. F., Fu, J., Geng, Z., Cheng, J., Wang, M., Zhang, L. J., Cui, G., Yu, Y., Liao, W., Zhang, H., et al. (2025) · Nature Communications · doi:10.1038/s41467-025-67221-6 · Cited by 1
Exercise impact on IRE1α signaling: Novel insights into Alzheimer's disease prevention and treatment
Haixia, T., & Bo, X. (2025) · Biochemical and Biophysical Research Communications · doi:10.1016/j.bbrc.2025.153156 · Cited by 1
Akay, C., Newton, S. E. B., Dombroski, B. A., Kallianpur, A. R., Bharti, A., Franklin, D. R., Schellenberg, G. D., Heaton, R. K., Grant, I., Ellis, R. J., et al. (2024) · Journal of Neuroimmune Pharmacology · doi:10.1007/s11481-024-10125-x · Cited by 3
Self-citationCheng, C.-F., Cheng, E., & Ku, H.-C. (2024) · Tzu-Chi Medical Journal · doi:10.4103/tcmj.tcmj_51_24 · Cited by 1
Endoplasmic Reticulum Stress and Protein Misfolding in Neurodegenerative Diseases
Samaddar, S., Redhwan, M. A. M., & Eraiah, M. M. (2025) · Springer eBooks · doi:10.1007/978-981-96-6202-9_15 · Cited by 1
Gannon, P. J. (2014) · Scholarly Commons (University of Pennsylvania) · Cited by 1
Novel Therapeutic Targets and Biomarkers for the Treatment of Progressive Supranuclear PalsyPreprint
Tyer, I., & Hill, A. (2020) · Preprints.org · doi:10.20944/preprints202006.0147.v1 · Cited by 1
Akay, C., Newton, S. E. B., Dombroski, B. A., Kallianpur, A. R., Bharti, A., Franklin, D. R., Schellenberg, G. D., Heaton, R. K., Grant, I., Ellis, R. J., et al. (2022) · medRxiv · doi:10.1101/2022.04.20.22273997 · Cited by 1
Self-citationYulyaningsih, E., Suh, J. H., Fanok, M. H., Chau, R., Solanoy, H., Takahashi, R. H., Bakardjiev, A., Becerra, I., Benitez, N. B., Chiu, C.-L., et al. (2024) · bioRxiv · doi:10.1101/2023.08.21.554203 · Cited by 4
Elucidating and Pharmacologically Targeting Secondary Injury Cascades following Neural Injury
Lucke-Wold, B. P. (2016) · The Research Repository @ WVU (West Virginia University) · doi:10.33915/etd.6120
Human tauopathies are not associated with an activated unfolded protein responsePreprint
Pitera, A. P., Hartnell, I. J., Boche, D., O'Connor, V. M., & Deinhardt, K. (2019) · bioRxiv (Cold Spring Harbor Laboratory) · doi:10.1101/2019.12.20.884437
Novel Approaches to Fight Prion Diseases
Thapa, S. (2020) · doi:10.11575/prism/37788
Hu, N., Hu, Z., Yu, P., Wang, D., Wu, Y. M., Qi, Y., Ondrejčák, T., Klyubin, I. V., Xu, J., Yang, Y. Y., et al. (2020) · Research Square · doi:10.21203/rs.3.rs-88220/v1
Pereira, M., Ribeiro, D. R., Berg, M., Tsai, A. P., Nho, K. T., Kaiser, S., Moutinho, M., & Soares, A. R. (2023) · bioRxiv (Cold Spring Harbor Laboratory) · doi:10.1101/2023.05.02.538928
Yulyaningsih, E., Suh, J. H., Fanok, M. H., et al. (2023) · eLife · doi:10.7554/elife.92173.1.sa2
Update on the pathophysiology of prion diseases
Mallucci, G. R., & Verity, N. (2014) · Advances in Clinical Neuroscience & Rehabilitation · doi:10.47795/gzat8254
IG-GRD: A Model Based on Disentangled Graph Representation Learning for Imaging Genetic Data Fusion
Feng, S., Wang, L., Li, C., Wan, X., Zhang, F., & Hu, B. (2024) · Lecture notes in computer science · doi:10.1007/978-981-97-5581-3_12
Ilyin, N. P., Nikitin, V. S., & Kalueff, A. V. (2024) · Журнал эволюционной биохимии и физиологии · doi:10.31857/s0044452924070019
Murray, H. C., Dieriks, B. V., Swanson, M. E. V., Anekal, P. V., Turner, C., Faull, R. L. M., Belluscio, L., Koretsky, A. P., & Curtis, M. A. (2020) · Figshare · doi:10.6084/m9.figshare.12655390
Murray, H. C., Dieriks, B. V., Swanson, M. E. V., Anekal, P. V., Turner, C., Faull, R. L. M., Belluscio, L., Koretsky, A. P., & Curtis, M. A. (2020) · Figshare · doi:10.6084/m9.figshare.12655387
Murray, H. C., Dieriks, B. V., Swanson, M. E. V., Anekal, P. V., Turner, C., Faull, R. L. M., Belluscio, L., Koretsky, A. P., & Curtis, M. A. (2020) · Figshare · doi:10.6084/m9.figshare.12655393
Wiersma, V. I., Hoozemans, J. J. M., & Scheper, W. (2020) · Figshare · doi:10.6084/m9.figshare.12916622
Murray, H. C., Dieriks, B. V., Swanson, M. E. V., Anekal, P. V., Turner, C., Faull, R. L. M., Belluscio, L., Koretsky, A. P., & Curtis, M. A. (2020) · Figshare · doi:10.6084/m9.figshare.12655384
Progressive Supranuclear Palsy PERK Haplotype B Selectively Translates DLX1 Promoting Tau Toxicity
Lessard, C. B., Rubio-Rubio, D., Tolton, S. G., Criado‐Marrero, M., Ravi, S., Garza, T. N., Koren, J., Phillips, J., Bagchi, P., McFarland, K. N., et al. (2026) · Journal of Neuroscience · doi:10.1523/jneurosci.1727-25.2026 · Cited by 1
Neurotoxicité précoce et mécanismes de neuroprotection dans des modèles poisson‐zèbre de tauopathies
Barbereau, C. (2020) · theses.fr (ABES) · doi:10.70675/dfe1802ez70f2z4da6zb3e5z63d1de7a429c
The role of the unfolded protein response in dendritic cells and multiple myeloma cells
Gigan, J. P. (2022) · theses.fr (ABES) · doi:10.70675/e412f7f8zaaafz4caaz8d4czd681169cbf7b
Integrative genomic and functional analyses reveal NINL as a modulator of tau aggregation
Swift, S. K., Huang, G., Cochran, J. N., Albanus, R. D., Minaya, M., Castruita, P. A., Zhang, R., Miller, K. J., Starr, E., Galasso, G., et al. (2026) · Alzheimer s & Dementia · doi:10.1002/alz.71352 · Cited by 1
The PERK paradox in aging: how ER stress shapes senescence and neurodegeneration
Pandey, V. K., Sachdeva, R., & Despa, S. I. (2026) · GeroScience · doi:10.1007/s11357-026-02430-5
Laureyssen, C., Thal, D. R., & Sleegers, K. (2026) · Acta Neuropathologica · doi:10.1007/s00401-026-03085-4
DNL343 and Disease Progression in Amyotrophic Lateral Sclerosis
Paganoni, S., Chibnik, L. B., Quintana, M., Macklin, E. A., Detry, M. A., Vestrucci, M., Paulon, G., McGlothlin, A., Wang, J., Walk, D., et al. (2026) · JAMA Network Open · doi:10.1001/jamanetworkopen.2026.34809
Proteostasis collapse and unfolded protein response-mediated neurodegeneration in prion disease
Syeda, A., Nafiz, M., & Ubaid-ullah, S. (2026) · Frontiers in Cell Death · doi:10.3389/fceld.2026.1941546
Swathy, B., LeSourd, K. S., & Yuan, S. H. (2026) · Pharmacological Research · doi:10.1016/j.phrs.2026.109720
Metadata
- Authors
- Stutzbach, L. D., Xie, S. X., Naj, A. C., Albin, R., Gilman, S., PSP Genetics Study Group, Lee, V. M. Y., Trojanowski, J. Q., Devlin, B., & Schellenberg, G. D.
- Affiliations
- University of Pennsylvania (US)
- University of Michigan (US)
- University of Pittsburgh (US)
- Corresponding author
- Schellenberg, Gerard D
- ORCID
- Venue
- Acta Neuropathologica Communications
- Published
- 2013-07-06
- Volume
- 1
- Issue
- 1
- Pages
- 31-31
- ISSN
- 2051-5960 (ISSN-L)
- PMC
- PMC3893579
- OpenAlex
- W2106758408
- Cited by
- 197
- References
- 59
- Citations by year
- 2026: 10 · 2025: 9 · 2024: 17 · 2023: 23 · 2022: 20 · 2021: 11 · 2020: 34 · 2019: 14 · 2018: 16 · 2017: 14 · 2016: 10 · 2015: 10 · 2014: 8 · 2013: 1
- FWCI
- 5.61
- Type
- journal article
- Language
- en
- Open access
- gold
- doi.org
- Licence
- cc-by
- Locations
- Acta Neuropathologica Communications (publishedVersion, cc-by)
- Europe PMC (PubMed Central) (publishedVersion, cc-by)
- PubMed Central (publishedVersion, cc-by)
- PubMed (publishedVersion)
- D-Scholarship@Pitt (University of Pittsburgh) (acceptedVersion)
- UCL Discovery (University College London) (submittedVersion)
- Funders
- Michael J. Fox Foundation for Parkinson's Research (U24 NS072026, 05-901, 211002, P30 AG19610)
- University of Michigan
- Arizona Department of Health Services (P30 AG19610, U24 NS072026, 05-901, 211002, Contract 211002)
- National Institute for Health and Care Research (NF-SI-0512-10033)
- Arizona Biomedical Research Commission (P30 AG19610, 05–901, Contracts 4001, 0011, 05‐901 and 1001, U24 NS072026, 4001, 0011, 05-901, and 1001, 211002)
- National Institutes of Health (U24NS07-2026, 05-901, AG 10 124, 1f31ag043254-01, 211002, AG19610, AG017586)
- National Institute on Aging (211002, P30-AG-19610, F31 AG043254, 1F31AG043254, P50AG005131, AG-19610, P30AG010124, P01AG017586, R37AG011762, AG-10124, R37 AG11762, P30AG019610, 05-901, AG-017586, P50AG005134, P30AG062421)
- National Institute of Neurological Disorders and Stroke (NS072026, 211002, U24NS072026, 05-901, P30 AG19610)
- Topics
- Life Sciences › Biochemistry, Genetics and Molecular Biology › Cell Biology › Endoplasmic Reticulum Stress and Disease
- Life Sciences › Neuroscience › Cellular and Molecular Neuroscience › Alzheimer's disease research and treatments
- Health Sciences › Medicine › Clinical Neurology › Parkinson's Disease Mechanisms and Treatments
- Keywords
- unfolded protein response, PERK, progressive supranuclear palsy, Alzheimer's disease, tau pathology, endoplasmic reticulum stress, passive optical networks, medulla, hippocampus, genetic risk, amyloid plaques
- MeSH terms
- Aged, Aging, Alzheimer Disease, Brain, Female, Haplotypes, Humans, Male, Middle Aged, Supranuclear Palsy, Progressive, tau Proteins, eIF-2 Kinase, Genetic Predisposition to Disease, Polymorphism, Single Nucleotide, Unfolded Protein Response
About these checks
Registry, retraction, Cites and statistics results are computed, not judged, with one exception: a printed reference that no index lists is read once by a model before it counts as a citation error. Claims are extracted by a model and kept only when their quote appears verbatim in the text; each cited source is then checked, with a model’s help, for whether it says what the claim relies on. Those verdicts can be wrong — read the claim’s quote and the cited source before relying on one.
Statistics and arithmetic are recomputed, not judged.
Confidence bands are shown only for fields calibrated on our annotated test set. None is calibrated yet, so no band is shown.
What counts as a claim ›How we measure confidence ›How we check this ›
Are you an author, or do you see a problem with this page? Request a review
