

The DOI matches its Crossref record; 70 of the 70 references it cites were found in a registry or an index.
Many LINE1 elements contribute to the transcriptome of human somatic cells
Open accessAbstract
BACKGROUND: While LINE1 (L1) retroelements comprise nearly 20% of the human genome, the majority are thought to have been rendered transcriptionally inactive, due to either mutation or epigenetic suppression. How many L1 elements 'escape' these forms of repression and contribute to the transcriptome of human somatic cells? We have cloned out expressed sequence tags corresponding to the 5' and 3' flanks of L1 elements in order to characterize the population of elements that are being actively transcribed. We also examined expression of a select number of elements in different individuals. RESULTS: We isolated expressed sequence tags from human lymphoblastoid cell lines corresponding to 692 distinct L1 element sites, including 410 full-length elements. Four of the expression tagged sites corresponding to full-length elements from the human specific L1Hs subfamily were examined in European-American individuals and found to be differentially expressed in different family members. CONCLUSIONS: A large number of different L1 element sites are expressed in human somatic tissues, and this expression varies among different individuals. Paradoxically, few elements were tagged at high frequency, indicating that the majority of expressed L1s are transcribed at low levels. Based on our preliminary expression studies of a limited number of elements in a single family, we predict a significant degree of inter-individual transcript-level polymorphism in this class of sequence.
Overview
The claims and statistics of this paper haven’t been checked yet.
Run the check — free, no account needed. It reads the open-access text and checks the sources it cites.
Integrity signals
Registry
Cites
Statistics
Figures
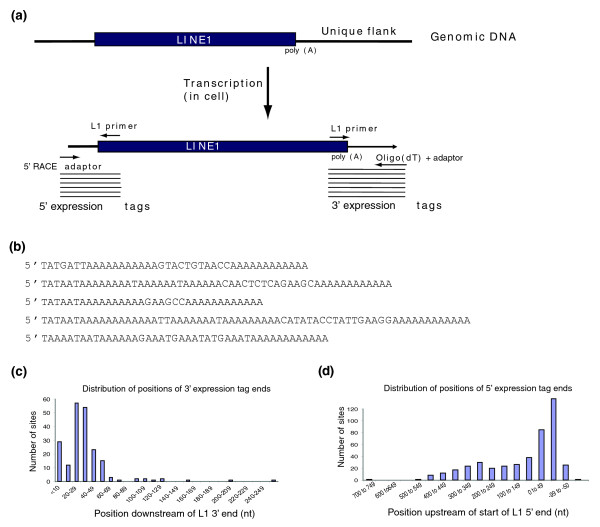
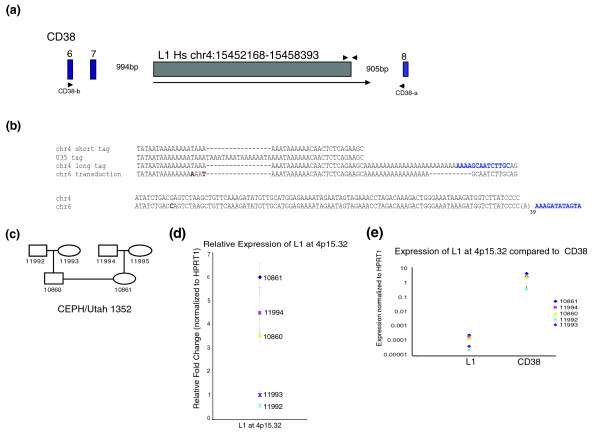
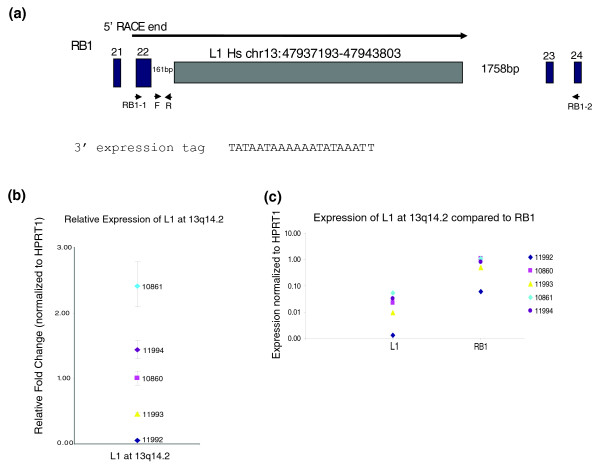
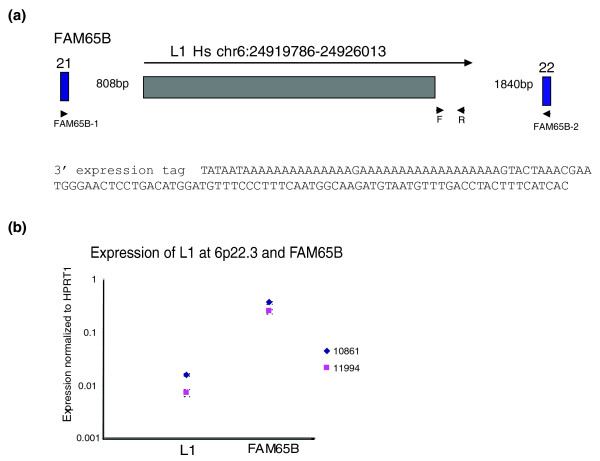
Verification
Claims the paper makes
The claims and statistics of this paper haven’t been checked yet.
Run the check — free, no account needed. It reads the open-access text and checks the sources it cites.
Claims other papers make about this one
Each is checked against this paper’s own text: does it say what the citing paper says it does?
The source backs part of the claim, not all of it — or backs it for a different population, condition or comparison.
In the citing paper
“The initiation of L1 transcription is known to be imprecise, with the majority of start sites occurring +/−50 bp of the consensus start site, and a subset as far down as +180 bp68.”
From L1 drives IFN in senescent cells and promotes age-associated inflammation (2019) · cites this paper as [68]
Experimental — accuracy not yet measured
Self-check
Percentages, sums and reported differences re-computed from the paper’s own numbers.
The self-check needs the paper’s full text.
Citations
Cites
Initial sequencing and analysis of the human genome
International Human Genome Sequencing Consortium, Whitehead Institute for Biomedical Research, C. F. G. R., Lander, E. S., Linton, L. M., Birren, B., Nusbaum, C., Zody, M. C., Baldwin, J., Devon, K., Dewar, K., et al. (2001) · Nature · doi:10.1038/35057062 · Cited by 24,216
Primer3 on the WWW for General Users and for Biologist Programmers
Rozen, S., & Skaletsky, H. (2003) · Humana Press eBooks · doi:10.1385/1-59259-192-2:365 · Cited by 15,068
The Human Genome Browser at UCSC
Kent, W. J., Sugnet, C. W., Furey, T. S., Roskin, K. M., Pringle, T. H., Zahler, A. M., & Haussler, A. D. (2002) · Genome Research · doi:10.1101/gr.229102 · Cited by 10,400
<tt>BLAT</tt> —The <tt>BLAST</tt> -Like Alignment Tool
Kent, W. J. (2002) · Genome Research · doi:10.1101/gr.229202 · Cited by 8,480
The UCSC Genome Browser Database
Karolchik, D. (2003) · Nucleic Acids Research · doi:10.1093/nar/gkg129 · Cited by 1,890
dbEST — database for “expressed sequence tags”
Boguski, M. S., Lowe, T. M., & Tolstoshev, C. M. (1993) · Nature Genetics · doi:10.1038/ng0893-332 · Cited by 1,340
Luan, D. D., Korman, M. H., Jakubczak, J. L., & Eickbush, T. H. (1993) · Cell · doi:10.1016/0092-8674(93)90078-5 · Cited by 1,173
Human L1 retrotransposon encodes a conserved endonuclease required for retrotransposition
Feng, Q., Moran, J. V., Kazazian, H. H., & Boeke, J. D. (1996) · Cell · doi:10.1016/s0092-8674(00)81997-2 · Cited by 1,139
Self-citationHot L1s account for the bulk of retrotransposition in the human population
Brouha, B., Schustak, J., Badge, R. M., Lutz-Prigge, S., Farley, A. H., Moran, J. V., & Kazazian, H. H. (2003) · Proceedings of the National Academy of Sciences · doi:10.1073/pnas.0831042100 · Cited by 1,073
Self-citationLINE-mediated retrotransposition of marked Alu sequences
Dewannieux, M., Esnault, C., & Heidmann, T. (2003) · Nature Genetics · doi:10.1038/ng1223 · Cited by 1,026
Cited by
Sorted by citations
L1 drives IFN in senescent cells and promotes age-associated inflammation
De Cecco, M., Ito, T., Petrashen, A. P., Elias, A. E., Skvir, N. J., Criscione, S. W., Caligiana, A., Brocculi, G., Adney, E. M., Boeke, J. D., et al. (2019) · Nature · doi:10.1038/s41586-018-0784-9 · Cited by 1,255
The Landscape of long noncoding RNA classification
Laurent, G. S., Wahlestedt, C., & Kapranov, P. (2015) · Trends in Genetics · doi:10.1016/j.tig.2015.03.007 · Cited by 1,211
Roles for retrotransposon insertions in human disease
Hancks, D. C., & Kazazian, H. H. (2016) · Mobile DNA · doi:10.1186/s13100-016-0065-9 · Cited by 670
Self-citationMeasuring and interpreting transposable element expression
Lanciano, S., & Cristofari, G. (2020) · Nature Reviews Genetics · doi:10.1038/s41576-020-0251-y · Cited by 415
Burns, K. H., & Boeke, J. D. (2012) · Cell · doi:10.1016/j.cell.2012.04.019 · Cited by 302
LINE-1 retrotransposons: mediators of somatic variation in neuronal genomes?
Singer, T., McConnell, M. J., Marchetto, M. C., Coufal, N. G., & Gage, F. H. (2010) · Trends in Neurosciences · doi:10.1016/j.tins.2010.04.001 · Cited by 280
Somatic expression of LINE-1 elements in human tissues
Belancio, V. P., Roy-Engel, A. M., Pochampally, R. R., & Deininger, P. (2010) · Nucleic Acids Research · doi:10.1093/nar/gkq132 · Cited by 238
Bendall, M. L., Rougvie, M. D. M., Iñiguez, L., Lecanda, A., Pérez‐Losada, M., Ostrowski, M., Jones, R. B., Mulder, L. C. F., Reyes‐Terán, G., Crandall, K. A., et al. (2019) · PLoS Computational Biology · doi:10.1371/journal.pcbi.1006453 · Cited by 219
All y’all need to know ‘bout retroelements in cancer
Belancio, V. P., Roy‐Engel, A. M., & Deininger, P. L. (2010) · Seminars in Cancer Biology · doi:10.1016/j.semcancer.2010.06.001 · Cited by 195
Philippe, C., Vargas-Landín, D. B., Doucet, A. J., van Essen, D., Vera‐Otarola, J., Kuciak, M., Corbin, A., Nigumann, P., & Cristofari, G. (2016) · eLife · doi:10.7554/elife.13926 · Cited by 186
Prediction of genome-wide DNA methylation in repetitive elements
Zheng, Y., Joyce, B. T., Liu, L., Zhang, Z., Kibbe, W. A., Zhang, W., & Hou, L. (2017) · Nucleic Acids Research · doi:10.1093/nar/gkx587 · Cited by 154
Prenatal Arsenic Exposure and DNA Methylation in Maternal and Umbilical Cord Blood Leukocytes
Kile, M. L., Baccarelli, A., Hoffman, E. B., Tarantini, L., Quamruzzaman, Q., Rahman, M., Mahiuddin, G., Mostofa, G., Hsueh, Y., Wright, R. O., et al. (2012) · Environmental Health Perspectives · doi:10.1289/ehp.1104173 · Cited by 155
Long interspersed nuclear element-1 hypomethylation in cancer: biology and clinical applications
Kitkumthorn, N., & Mutirangura, A. (2011) · Clinical Epigenetics · doi:10.1007/s13148-011-0032-8 · Cited by 142
Epigenetic Control of Retrotransposon Expression in Human Embryonic Stem Cells
Macia, Á., Muñoz-López, M., Cortés, J. L., Hastings, R. K., Morell, S., Lucena-Aguilar, G., Marchal, J. A., Badge, R. M., & Garcia-Perez, J. L. (2010) · Molecular and Cellular Biology · doi:10.1128/mcb.00561-10 · Cited by 140
A comprehensive approach to expression of L1 loci
Deininger, P. L., Morales, M. E., White, T., Baddoo, M., Hedges, D. J., Servant, G., Srivastav, S. K., Smither, M. E., Concha, M., deHaro, D. L., et al. (2016) · Nucleic Acids Research · doi:10.1093/nar/gkw1067 · Cited by 124
Is There a Link Between Genome-Wide Hypomethylation in Blood and Cancer Risk?
Brennan, K., & Flanagan, J. M. (2012) · Cancer Prevention Research · doi:10.1158/1940-6207.capr-12-0316 · Cited by 111
Hypomethylation of Intragenic LINE-1 Represses Transcription in Cancer Cells through AGO2
Aporntewan, C., Phokaew, C., Piriyapongsa, J., Ngamphiw, C., Ittiwut, C., Tongsima, S., & Mutirangura, A. (2011) · PLoS ONE · doi:10.1371/journal.pone.0017934 · Cited by 101
Exploring the gonad transcriptome of two extreme male pigs with RNA-seq
Esteve‐Codina, A., Kofler, R., Palmieri, N., Bussotti, G., Notredame, C., & Miguel Pérez-enciso, A. (2011) · BMC Genomics · doi:10.1186/1471-2164-12-552 · Cited by 103
Selective changes of retroelement expression in human prostate cancer
Goering, W., Ribarska, T., & Schulz, W. A. (2011) · Carcinogenesis · doi:10.1093/carcin/bgr181 · Cited by 99
Meir, Y. J., Weirauch, M. T., Yang, H.-S., Chung, P.-C., Yu, R. K., & Wu, S. C. (2011) · BMC Biotechnology · doi:10.1186/1472-6750-11-28 · Cited by 77
St. Laurent, G., Hammell, N., & McCaffrey, T. A. (2010) · Mechanisms of Ageing and Development · doi:10.1016/j.mad.2010.03.008 · Cited by 68
Potential for genomic instability associated with retrotranspositionally-incompetent L1 loci
Kines, K. J., Sokolowski, M. J., deHaro, D. L., Christian, C. M., & Belancio, V. P. (2014) · Nucleic Acids Research · doi:10.1093/nar/gku687 · Cited by 62
Guffanti, G., Bartlett, A. A., Klengel, T., Klengel, C., Hunter, R. G., Glinsky, G. V., & Macciardi, F. M. (2018) · Molecular Biology and Evolution · doi:10.1093/molbev/msy143 · Cited by 62
Retrotransposons: Mobile and mutagenic from conception to death
Faulkner, G. J. (2011) · FEBS Letters · doi:10.1016/j.febslet.2011.03.061 · Cited by 55
Kaer, K., Branovets, J., Hallikma, A., Nigumann, P., & Speek, M. (2011) · PLoS ONE · doi:10.1371/journal.pone.0026099 · Cited by 61
Male Germline Control of Transposable Elements1
Bao, J., & Yan, W. (2012) · Biology of Reproduction · doi:10.1095/biolreprod.111.095463 · Cited by 55
Retroelements versus APOBEC3 family members: No great escape from the magnificent seven
Arias, J. F., Koyama, T., Kinomoto, M., & Tokunaga, K. (2012) · Frontiers in Microbiology · doi:10.3389/fmicb.2012.00275 · Cited by 57
Lanciano, S., Philippe, C., Sarkar, A., Pratella, D., Domrane, C., Doucet, A. J., van Essen, D., Saccani, S., Ferry, L., Defossez, P., et al. (2024) · Cell Genomics · doi:10.1016/j.xgen.2024.100498 · Cited by 58
Ivancevic, A. M., Walsh, A. M., Kortschak, R. D., & Adelson, D. L. (2013) · BioEssays · doi:10.1002/bies.201300072 · Cited by 50
TeXP: Deconvolving the effects of pervasive and autonomous transcription of transposable elements
Navarro, F. C. P., Hoops, J., Bellfy, L., Cerveira, E., Zhu, Q., Zhang, C., Lee, C., & Gerstein, M. (2019) · PLoS Computational Biology · doi:10.1371/journal.pcbi.1007293 · Cited by 50
Sciamanna, I., Gualtieri, A., Cossetti, C., Osimo, E. F., Ferracin, M., Macchia, G., Aricò, E., Prosseda, G., Vitullo, P., Misteli, T., et al. (2013) · Oncotarget · doi:10.18632/oncotarget.1403 · Cited by 49
mRNA Vaccines: Why Is the Biology of Retroposition Ignored?
Domazet‐Lošo, T. (2022) · Genes · doi:10.3390/genes13050719 · Cited by 47
Li, J., Kannan, M., Trivett, A. L., Liao, H., Wu, X., Akagi, K., & Symer, D. E. (2014) · Nucleic Acids Research · doi:10.1093/nar/gku091 · Cited by 50
Treiber, C. D., & Waddell, S. (2020) · Genome Research · doi:10.1101/gr.259200.119 · Cited by 40
Genes associated with the cis-regulatory functions of intragenic LINE-1 elements
Wanichnopparat, W., Suwanwongse, K., Pin‐on, P., Aporntewan, C., & Mutirangura, A. (2013) · BMC Genomics · doi:10.1186/1471-2164-14-205 · Cited by 41
An expanding universe of the non-coding genome in cancer biology
Xue, B., & He, L. (2014) · Carcinogenesis · doi:10.1093/carcin/bgu099 · Cited by 37
He, Z., Li, J., Hwa, Y. L., Brost, B. C., Fang, Q., & Jiang, S. (2014) · PLoS ONE · doi:10.1371/journal.pone.0096994 · Cited by 36
Nüsgen, N., Goering, W., Daukša, A., Biswas, A., Jamil, M. A., Dimitriou, I. M., Sharma, A., Singer, H., Fimmers, R., Fröhlich, H., et al. (2015) · Clinical Epigenetics · doi:10.1186/s13148-015-0051-y · Cited by 35
Truncated ORF1 proteins can suppress LINE-1 retrotransposition in trans
Sokolowski, M. J., Chynces, M., deHaro, D. L., Christian, C. M., & Belancio, V. P. (2017) · Nucleic Acids Research · doi:10.1093/nar/gkx211 · Cited by 35
Zhang, W., Li, M., Sun, F., Xu, X., Zhang, Z., Liu, J., Sun, X., Zhang, A., Shen, Y., Xu, J., et al. (2019) · Frontiers in Genetics · doi:10.3389/fgene.2019.01001 · Cited by 32
Chung, N., Jonaid, G. M., Quinton, S., Ross, A., Sexton, C. E., Alberto, A., Clymer, C., Churchill, D., Leija, O. N., & Han, M. (2019) · Mobile DNA · doi:10.1186/s13100-019-0180-5 · Cited by 37
Trigiante, G., Ruiz, N. B., & Cerase, A. (2021) · Frontiers in Cell and Developmental Biology · doi:10.3389/fcell.2021.735527 · Cited by 29
Mita, P., Savas, J. N., Briggs, E. M., Ha, S., Gnanakkan, V. P., Yates, J. R., Robins, D. M., David, G., Boeke, J. D., Garabedian, M. J., et al. (2016) · Journal of Biological Chemistry · doi:10.1074/jbc.m116.741660 · Cited by 27
Retrotransposons in pluripotent cells: Impact and new roles in cellular plasticity
Macia, Á., Blanco-Jimenez, E., & Garcia-Perez, J. L. (2014) · Biochimica et Biophysica Acta (BBA) - Gene Regulatory Mechanisms · doi:10.1016/j.bbagrm.2014.07.007 · Cited by 30
Advances in understanding LINE-1 regulation and function in the human genome
Li, X., & Liu, N. (2025) · Trends in Genetics · doi:10.1016/j.tig.2025.04.011 · Cited by 34
Sense transcripts originated from an internal part of the human retrotransposon LINE-1 5′ UTR
Alexandrova, E., Olovnikov, I. A., Malakhova, G., Zabolotneva, A. A., Suntsova, M., Dmitriev, S. E., & Buzdin, A. A. (2012) · Gene · doi:10.1016/j.gene.2012.09.026 · Cited by 25
Piskareva, O., Lackington, W. A., Lemass, D., Hendrick, C. A., Doolan, P., & Barron, N. (2011) · Current Molecular Medicine · doi:10.2174/156652411795677954 · Cited by 25
Many Different LINE-1 Retroelements Are Activated in Bladder Cancer
Whongsiri, P., Goering, W., Lautwein, T., Hader, C., Niegisch, G., Köhrer, K., Hoffmann, M. J., & Schulz, W. A. (2020) · International Journal of Molecular Sciences · doi:10.3390/ijms21249433 · Cited by 22
Achiro, J. M., Tao, Y., Gao, F., Lin, C.-H., Watanabe, M., Neumann, S., Coppola, G., Black, D. L., & Martin, K. C. (2024) · Frontiers in Molecular Neuroscience · doi:10.3389/fnmol.2024.1334862 · Cited by 21
How do mammalian transposons induce genetic variation? A conceptual framework
Akagi, K., Li, J., & Symer, D. E. (2013) · BioEssays · doi:10.1002/bies.201200133 · Cited by 20
TE-array—a high throughput tool to study transposon transcription
Gnanakkan, V. P., Jaffe, A. E., Dai, L., Fu, J., Wheelan, S. J., Levitsky, H. I., Boeke, J. D., & Burns, K. H. (2013) · BMC Genomics · doi:10.1186/1471-2164-14-869 · Cited by 17
Retrotransposons in the Mammalian Male Germline
Zhou, S., Sakashita, A., Yuan, S., & Namekawa, S. H. (2022) · Sexual Development · doi:10.1159/000520683 · Cited by 17
Loh, D., & Reiter, R. J. (2022) · International Journal of Molecular Sciences · doi:10.3390/ijms23158122 · Cited by 17
The coevolution between APOBEC3 and retrotransposons in primates
Modenini, G., Abondio, P., & Boattini, A. (2022) · Mobile DNA · doi:10.1186/s13100-022-00283-1 · Cited by 20
Detection of LINE-1 RNAs by Northern Blot
Deininger, P. L., & Belancio, V. P. (2016) · Methods in molecular biology · doi:10.1007/978-1-4939-3372-3_15 · Cited by 15
Evolutionarily recent retrotransposons contribute to schizophrenia
Modenini, G., Abondio, P., Guffanti, G., Boattini, A., & Macciardi, F. M. (2023) · Translational Psychiatry · doi:10.1038/s41398-023-02472-9 · Cited by 16
Pandya, R., Diego, K. G. S., Shabbir, T., Modi, A. P., Wang, J. Q., Dhahbi, J. M., & Barsky, S. H. (2021) · Medical Hypotheses · doi:10.1016/j.mehy.2021.110704 · Cited by 13
Exploratory analysis of L1 retrotransposons expression in autism
Spirito, G., Filosi, M., Domenici, E., Mangoni, D., Gustincich, S., & Sanges, R. (2023) · Molecular Autism · doi:10.1186/s13229-023-00554-5 · Cited by 15
LINE-1 retrotransposition events affect endothelial proliferation and migration
Banaz‐Yaşar, F., Steffen, G., Hauschild, J., Bongartz, B. M., Schumann, G. G., & Ergün, S. (2010) · Histochemistry and Cell Biology · doi:10.1007/s00418-010-0758-y · Cited by 12
Watanabe, R., Nakachi, Y., Matsubara, H., Ueda, J., Ishii, T., Ukai, W., Hashimoto, E., Kasai, K., Simizu, S., Kato, T., et al. (2023) · Neuroscience Research · doi:10.1016/j.neures.2023.05.001 · Cited by 11
Kaer, K., & Speek, M. (2012) · Mobile Genetic Elements · doi:10.4161/mge.20774 · Cited by 10
Mangoni, D., Mazzetti, A., Ansaloni, F., Simi, A., Tartaglia, G. G., Pandolfini, L., Gustincich, S., & Sanges, R. (2024) · BioEssays · doi:10.1002/bies.202400125 · Cited by 9
Evolutionary rate of human tissue-specific genes are related with transposable element insertions
Jin, P., Qin, S., Chen, X., Song, Y., Li‐Ling, J., Xu, X., & Ma, F. (2012) · Genetica · doi:10.1007/s10709-013-9700-2 · Cited by 9
Functional constraints on adaptive evolution of protein ubiquitination sites
Lu, L., Li, Y., Liu, Z., Liang, F., Guo, F., Yang, S., Wang, D., He, Y., Xiong, J., Li, D., et al. (2017) · Scientific Reports · doi:10.1038/srep39949 · Cited by 9
Using a systems-based approach to overcome reductionist strategies in the development of diagnostics
Maguire, G. (2013) · Expert Review of Molecular Diagnostics · doi:10.1586/14737159.2013.846828 · Cited by 9
Khan, M., Shah, S., Lv, B., Lv, Z., Ji, N., Song, Z., Wu, P., Wang, X., & Mehmood, A. (2022) · Ocular Immunology and Inflammation · doi:10.1080/09273948.2022.2112238 · Cited by 8
Next-generation sequencing-based detection of germline L1-mediated transductions
Tica, J., Lee, E., Untergasser, A., Meiers, S., Garfield, D. A., Gökçümen, Ö., Furlong, E. E. M., Park, P. J., Stütz, A. M., & Korbel, J. O. (2016) · BMC Genomics · doi:10.1186/s12864-016-2670-x · Cited by 8
Concurrent L1 retrotransposition events promote reciprocal translocations in human tumorigenesis
Zumalave, S., Santamarina, M., Espasandín, N. P., Zamora, J., García‐Souto, D., Temes, J., Baker, T. M., Rodríguez‐Castro, J., Otero, P., Pequeño‐Valtierra, A., et al. (2026) · Science · doi:10.1126/science.aee4513 · Cited by 13
The contribution of uncharted RNA sequences to tumor identity in lung adenocarcinoma
Wang, Y., Xue, H., Aglave, M., Lainé, A., Gallopin, M., & Gautheret, D. (2022) · NAR Cancer · doi:10.1093/narcan/zcac001 · Cited by 6
Database documentation of retrotransposon insertion polymorphisms
Liang, P. (2011) · Frontiers in Bioscience-Elite · doi:10.2741/479 · Cited by 7
Synchronous L1 retrotransposition events promote chromosomal crossover early in human tumorigenesisPreprint
Zumalave, S., Santamarina, M., Espasandín, N. P., García‐Souto, D., Temes, J., Baker, T. M., Pequeño‐Valtierra, A., Otero, I., Rodríguez‐Castro, J., Oitabén, A., et al. (2024) · bioRxiv (Cold Spring Harbor Laboratory) · doi:10.1101/2024.08.27.596794 · Cited by 8
Locus-specific LINE-1 expression in clinical ovarian cancer specimens at the single-cell level
Perkiö, A., Pradhan, B., Genç, F., Pirttikoski, A., Pikkusaari, S., Erkan, E. P., Falco, M. M., Huhtinen, K., Narva, S., Hynninen, J., et al. (2024) · Scientific Reports · doi:10.1038/s41598-024-54113-w · Cited by 7
As we bring demethylating drugs to the clinic, we better know the DICE being cast
Lizardi, P. M. (2010) · Oncogene · doi:10.1038/onc.2010.372 · Cited by 6
LINE-1 distribution in six rodent genomes follow a species-specific pattern
Vieira-da-Silva, A., Adega, F., Guedes‐Pinto, H., & Chaves, R. (2016) · Journal of Genetics · doi:10.1007/s12041-015-0595-9 · Cited by 6
Sironen, A. I., Fischer, D., Laiho, A., Gyenesei, A., & Vilkki, J. (2014) · Animal Genetics · doi:10.1111/age.12153 · Cited by 5
Kaur, D., Agrahari, M., Singh, S. S., Mandal, P. K., Bhattacharya, A., & Bhattacharya, S. (2021) · Plasmid · doi:10.1016/j.plasmid.2021.102560 · Cited by 5
A comprehensive analysis of gorilla-specific LINE-1 retrotransposons
Jeon, S., Kim, S., Oh, M. H., Liang, P., Tang, W., & Han, K. (2021) · Genes & Genomics · doi:10.1007/s13258-021-01146-4 · Cited by 5
Nicodemus, J., Liu, C. S., Ransom, L., Tan, V., Romanow, W. J., Jimenez, N., & Chun, J. J. M. (2025) · Journal of Neuroscience · doi:10.1523/jneurosci.2298-24.2025 · Cited by 5
Life in a multi-extreme environment: Thermococcales living in deep sea hydrothermal vents
Zhao, W., & Xiang, X. I. A. O. (2017) · Scientia Sinica Vitae · doi:10.1360/n052017-00056 · Cited by 4
Ruiz‐Pérez, S., Alcaraz, N., Torres‐Arciga, K., Ocampo‐Cervantes, J. A., Cervera, A., Hernández, C. C., Sámano, C., Soto‐Reyes, E., & González‐Barrios, R. (2025) · Advanced Biology · doi:10.1002/adbi.202400502 · Cited by 3
Long-read RNA sequencing of transposable elements from single cells using CELLO-seq
Marlow, S. A., Deaville, L. A., & Berrens, R. V. (2025) · Nature Protocols · doi:10.1038/s41596-025-01203-2 · Cited by 5
Acceleration of crescent formation by L1 retrotransposon in mouse BSA-induced nephritis
MUGITANI, N., Shimizu, Y., Satake, K., Suzuki, Y., Horikoshi, S., & Tomino, Y. (2012) · Journal of Nephrology · doi:10.5301/jn.5000156 · Cited by 3
Santos, J. R. L., Sun, W., Befus, A. D., & Marcet‐Palacios, M. (2025) · BMC Bioinformatics · doi:10.1186/s12859-025-06160-x · Cited by 1
Blood DNA methylation biomarkers for breast cancer risk
Brennan, K. (2013) · Spiral (Imperial College London) · doi:10.25560/23641
REST/NRSF regulates genetic stability and cell fate in human embryonic stem cells
Thakore-Shah, K. (2013) · eScholarship (California Digital Library)
Musselman, J. R. B. (2013) · University of Minnesota Digital Conservancy (University of Minnesota)
Characterization of the Iberian pig genome and transcriptome using high throughput sequencing
Esteve‐Codina, A. (2012) · LA Referencia (Red Federada de Repositorios Institucionales de Publicaciones Científicas)
Vexelshtein, O. (2016) · TSpace (University of Toronto)
The Effects of Exercise on LINE-1 Regulation
Romero, M. A. (2019)
Zhang, M., & Xuan, Z. (2019) · Faculty Opinions – Post-Publication Peer Review of the Biomedical Literature · doi:10.3410/f.735010803.793558596
Pieters, J., & Mode, R. (2019) · Faculty Opinions – Post-Publication Peer Review of the Biomedical Literature · doi:10.3410/f.735010803.793558622
Ruiz‐Pérez, S., Torres‐Arciga, K., Sámano, C., Ocampo‐Cervantes, J. A., Cervera, A., Hernández, C. C., Soto‐Reyes, E., Alcaraz, N., & González‐Barrios, R. (2024) · bioRxiv (Cold Spring Harbor Laboratory) · doi:10.1101/2024.04.04.588033
Dorazehi, F., Francesconi, C., Pandiloski, N., Castilla‐Vallmanya, L., Albecka, A., Koutounidou, S., Mohan, S. B., Adami, A., Katsikas, A., Matijević, J., et al. (2025) · bioRxiv (Cold Spring Harbor Laboratory) · doi:10.1101/2025.06.11.658943
Additional file 5 of Exploratory analysis of L1 retrotransposons expression in autism
Spirito, G., Filosi, M., Domenici, E., Mangoni, D., Gustincich, S., & Sanges, R. (2024) · Figshare · doi:10.6084/m9.figshare.26600515
Additional file 3 of Exploratory analysis of L1 retrotransposons expression in autism
Spirito, G., Filosi, M., Domenici, E., Mangoni, D., Gustincich, S., & Sanges, R. (2024) · Figshare · doi:10.6084/m9.figshare.26600509
Additional file 1 of Exploratory analysis of L1 retrotransposons expression in autism
Spirito, G., Filosi, M., Domenici, E., Mangoni, D., Gustincich, S., & Sanges, R. (2024) · Figshare · doi:10.6084/m9.figshare.26600503
Additional file 4 of Exploratory analysis of L1 retrotransposons expression in autism
Spirito, G., Filosi, M., Domenici, E., Mangoni, D., Gustincich, S., & Sanges, R. (2024) · Figshare · doi:10.6084/m9.figshare.26600512
Additional file 2 of Exploratory analysis of L1 retrotransposons expression in autism
Spirito, G., Filosi, M., Domenici, E., Mangoni, D., Gustincich, S., & Sanges, R. (2024) · Figshare · doi:10.6084/m9.figshare.26600506
Additional file 6 of Exploratory analysis of L1 retrotransposons expression in autism
Spirito, G., Filosi, M., Domenici, E., Mangoni, D., Gustincich, S., & Sanges, R. (2024) · Figshare · doi:10.6084/m9.figshare.26600518
Metadata
- Authors
- Rangwala, S. H., Zhang, L., & Kazazian, H. H.
- Affiliations
- University of Pennsylvania (US)
- Corresponding author
- Kazazian, Haig H
- Venue
- Genome Biology
- Published
- 2009-09-22
- Volume
- 10
- Issue
- 9
- Pages
- R100-R100
- ISSN
- 1465-6906 (ISSN-L)
- 1474-760X
- PMC
- PMC2768975
- OpenAlex
- W2107950128
- Cited by
- 102
- References
- 70
- Citations by year
- 2026: 4 · 2025: 6 · 2024: 7 · 2023: 3 · 2022: 6 · 2021: 6 · 2020: 5 · 2019: 8 · 2018: 1 · 2017: 4 · 2016: 9 · 2015: 2 · 2014: 6 · 2013: 9 · 2012: 10
- FWCI
- 10.52
- Type
- journal article
- Language
- en
- Open access
- gold
- doi.org
- Locations
- Genome biology (publishedVersion, cc-by)
- PubMed Central (publishedVersion, cc-by)
- PubMed (publishedVersion)
- Funders
- University of Pennsylvania
- National Institutes of Health
- Topics
- Life Sciences › Biochemistry, Genetics and Molecular Biology › Genetics › Chromosomal and Genetic Variations
- Life Sciences › Biochemistry, Genetics and Molecular Biology › Genetics › Genomic variations and chromosomal abnormalities
- Life Sciences › Biochemistry, Genetics and Molecular Biology › Molecular Biology › Genomics and Chromatin Dynamics
- Keywords
- somatic cells, expressed sequence tags, lymphoblastoid cell lines, epigenetic silencing, human genome
- MeSH terms
- Binding Sites, Cell Line, Chromosomes, Human, Pair 1, Chromosomes, Human, Pair 13, Chromosomes, Human, Pair 4, Chromosomes, Human, Pair 6, Gene Expression Regulation, Humans, Lymphocytes, Transcription, Genetic, Genome, Human, Sequence Analysis, DNA, DNA, Complementary, Long Interspersed Nucleotide Elements, Reverse Transcriptase Polymerase Chain Reaction, Expressed Sequence Tags, Gene Expression Profiling
About these checks
Registry, retraction, Cites and statistics results are computed, not judged, with one exception: a printed reference that no index lists is read once by a model before it counts as a citation error. Claims are extracted by a model and kept only when their quote appears verbatim in the text; each cited source is then checked, with a model’s help, for whether it says what the claim relies on. Those verdicts can be wrong — read the claim’s quote and the cited source before relying on one.
Statistics and arithmetic are recomputed, not judged.
Confidence bands are shown only for fields calibrated on our annotated test set. None is calibrated yet, so no band is shown.
What counts as a claim ›How we measure confidence ›How we check this ›
Are you an author, or do you see a problem with this page? Request a review
