

The DOI matches its Crossref record; 57 of the 58 references it cites were found in a registry or an index.
Host lifestyle affects human microbiota on daily timescales
Open accessAbstract
BACKGROUND: Disturbance to human microbiota may underlie several pathologies. Yet, we lack a comprehensive understanding of how lifestyle affects the dynamics of human-associated microbial communities. RESULTS: Here, we link over 10,000 longitudinal measurements of human wellness and action to the daily gut and salivary microbiota dynamics of two individuals over the course of one year. These time series show overall microbial communities to be stable for months. However, rare events in each subjects’ life rapidly and broadly impacted microbiota dynamics. Travel from the developed to the developing world in one subject led to a nearly two-fold increase in the Bacteroidetes to Firmicutes ratio, which reversed upon return. Enteric infection in the other subject resulted in the permanent decline of most gut bacterial taxa, which were replaced by genetically similar species. Still, even during periods of overall community stability, the dynamics of select microbial taxa could be associated with specific host behaviors. Most prominently, changes in host fiber intake positively correlated with next-day abundance changes among 15% of gut microbiota members. CONCLUSIONS: Our findings suggest that although human-associated microbial communities are generally stable, they can be quickly and profoundly altered by common human actions and experiences.
Overview
The claims and statistics of this paper haven’t been checked yet.
Run the check — free, no account needed. It reads the open-access text and checks the sources it cites.
Integrity signals
Registry
Cites
Statistics
Figures
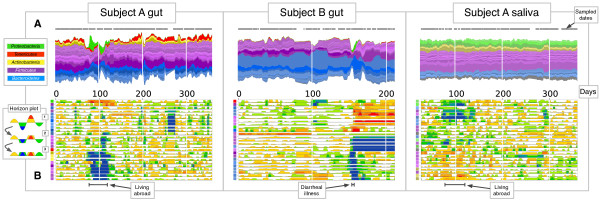
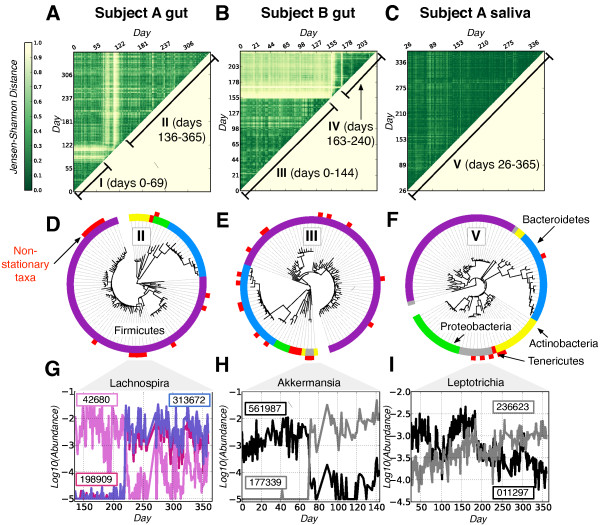
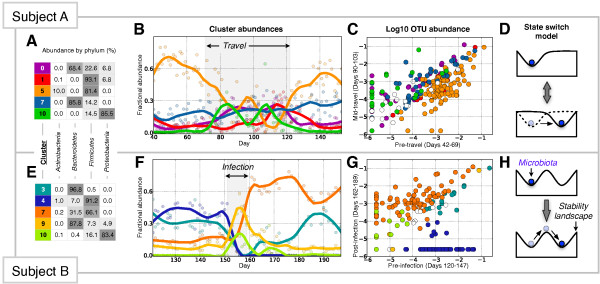
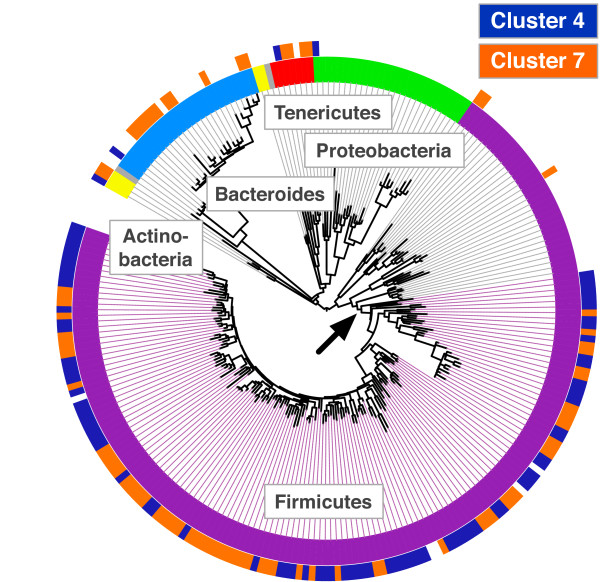
Verification
Claims the paper makes
The claims and statistics of this paper haven’t been checked yet.
Run the check — free, no account needed. It reads the open-access text and checks the sources it cites.
Claims other papers make about this one
Each is checked against this paper’s own text: does it say what the citing paper says it does?
The source backs part of the claim, not all of it — or backs it for a different population, condition or comparison.
In the citing paper
“Short-term, dramatic dietary interventions have demonstrated the ability to alter microbiota diversity quickly in humans [5].”
From Effect of Diet on the Gut Microbiota: Rethinking Intervention Duration (2019) · cites this paper as [5]
Experimental — accuracy not yet measuredIn the citing paper
“Likewise, mouse models have indicated that manipulation of macronutrient intake can consistently shift the composition of the gut microbiota within the span of a day [5,6,18,19].”
From Effect of Diet on the Gut Microbiota: Rethinking Intervention Duration (2019) · cites this paper as [5]
In the citing paper
“One longitudinal study involving daily gut microbiota investigations of two individuals over the course of a year found that changes in fibre intake are positively correlated with a change in abundance of 15% of the microbial community the following day [5].”
From Effect of Diet on the Gut Microbiota: Rethinking Intervention Duration (2019) · cites this paper as [5]
Self-check
Percentages, sums and reported differences re-computed from the paper’s own numbers.
The self-check needs the paper’s full text.
Citations
Cites
QIIME allows analysis of high-throughput community sequencing data
Caporaso, J. G., Kuczynski, J., Stombaugh, J., Bittinger, K., Bushman, F. D., Costello, E. K., Fierer, N., Peña, A. G., Goodrich, J. K., Gordon, J. I., et al. (2010) · Nature Methods · doi:10.1038/nmeth.f.303 · Cited by 34,887
Search and clustering orders of magnitude faster than BLAST
Edgar, R. C. (2010) · Bioinformatics · doi:10.1093/bioinformatics/btq461 · Cited by 21,098
An obesity-associated gut microbiome with increased capacity for energy harvest
Turnbaugh, P. J., Ley, R. E., Mahowald, M. A., Magrini, V., Mardis, E. R., & Gordon, J. I. (2006) · Nature · doi:10.1038/nature05414 · Cited by 12,444
Greengenes, a Chimera-Checked 16S rRNA Gene Database and Workbench Compatible with ARB
DeSantis, T. Z., Hugenholtz, P., Larsen, N., Rojas, M., Brodie, E. L., Keller, K., Huber, T., Dalevi, D., Hu, P., & Andersen, G. L. (2006) · Applied and Environmental Microbiology · doi:10.1128/aem.03006-05 · Cited by 10,891
Diet rapidly and reproducibly alters the human gut microbiome
David, L. A., Maurice, C. F., Carmody, R. N., Gootenberg, D. B., Button, J. E., Wolfe, B. E., Ling, A. V., Devlin, A. S., Varma, Y., Fischbach, M. A., et al. (2014) · Nature · doi:10.1038/nature12820 · Cited by 10,100
Self-citationGlobal patterns of 16S rRNA diversity at a depth of millions of sequences per sample
Caporaso, J. G., Lauber, C. L., Walters, W. A., Berg-Lyons, D., Lozupone, C., Turnbaugh, P. J., Fierer, N., & Knight, R. D. (2010) · Proceedings of the National Academy of Sciences · doi:10.1073/pnas.1000080107 · Cited by 9,944
Human gut microbes associated with obesity
Ley, R. E., Turnbaugh, P. J., Klein, S., & Gordon, J. I. (2006) · Nature · doi:10.1038/4441022a · Cited by 8,785
Human gut microbiome viewed across age and geography
Yatsunenko, T., Rey, F. E., Manary, M. J., Trehan, I., Dominguez-Bello, M. G., Contreras, M., Magris, M., Hidalgo, G., Baldassano, R. N., Anokhin, A. P., et al. (2012) · Nature · doi:10.1038/nature11053 · Cited by 7,815
Statsmodels: Econometric and Statistical Modeling with Python
Seabold, S., & Perktold, J. (2010) · Proceedings of the Python in Science Conferences · doi:10.25080/majora-92bf1922-011 · Cited by 6,968
Linking long-term dietary patterns with gut microbial enterotypes
Wu, G. D., Chen, J., Hoffmann, C., Bittinger, K., Chen, Y.-Y., Keilbaugh, S. A., Bewtra, M., Knights, D., Walters, W. A., Knight, R., et al. (2011) · Science · doi:10.1126/science.1208344 · Cited by 6,513
Cited by
Sorted by citations
Current understanding of the human microbiome
Gilbert, J. A., Blaser, M. J., Caporaso, J. G., Jansson, J. K., Lynch, S. V., & Knight, R. (2018) · Nature Medicine · doi:10.1038/nm.4517 · Cited by 2,609
You are what you eat: Diet, health and the gut microbiota
Zmora, N., Suez, J., & Elinav, E. (2019) · Nature Reviews Gastroenterology & Hepatology · doi:10.1038/s41575-018-0061-2 · Cited by 1,792
Dysbiosis and the immune system
Levy, M., Kolodziejczyk, A. A., Thaiss, C. A., & Elinav, E. (2017) · Nature Reviews Immunology · doi:10.1038/nri.2017.7 · Cited by 1,769
Signals from the gut microbiota to distant organs in physiology and disease
Schroeder, B. O., & Bäckhed, F. (2016) · Nature Medicine · doi:10.1038/nm.4185 · Cited by 1,409
Yassour, M., Vatanen, T., Siljander, H., Hämäläinen, A.-M., Härkönen, T., Ryhänen, S. J., Franzosa, E. A., Vlamakis, H., Huttenhower, C., Gevers, D., et al. (2016) · Science Translational Medicine · doi:10.1126/scitranslmed.aad0917 · Cited by 1,043
Metadata
- Authors
- David, L. A., Materna, A. C., Friedman, J., Campos-Baptista, M. I., Blackburn, M. C., Perrotta, A., Erdman, S. E., & Alm, E. J.
- Affiliations
- Harvard University (US)
- Qiagen (Denmark) (DK)
- Massachusetts Institute of Technology (US)
- École Polytechnique Fédérale de Lausanne (CH)
- Broad Institute (US)
- Corresponding author
- Alm, Eric J
- Venue
- Genome biology
- Published
- 2014-07-25
- Volume
- 15
- Issue
- 7
- Pages
- R89-R89
- ISSN
- 1465-6906 (ISSN-L)
- 1474-760X
- PMC
- PMC4405912
- OpenAlex
- W2103088074
- Cited by
- 950
- References
- 58
- Citations by year
- 2026: 27 · 2025: 60 · 2024: 74 · 2023: 80 · 2022: 117 · 2021: 95 · 2020: 105 · 2019: 85 · 2018: 85 · 2017: 98 · 2016: 65 · 2015: 52 · 2014: 5
- FWCI
- 30.09
- Type
- journal article
- Language
- en
- Update notices
- correction (2016-05-31)
- Open access
- gold
- doi.org
- Locations
- Genome biology (publishedVersion, cc-by)
- PubMed Central (publishedVersion, cc-by)
- PubMed (publishedVersion)
- DSpace@MIT (Massachusetts Institute of Technology) (submittedVersion, cc-by)
- DSpace@MIT (Massachusetts Institute of Technology) (submittedVersion, cc-by-nc)
- Infoscience (Ecole Polytechnique Fédérale de Lausanne) (submittedVersion)
- Infoscience (Ecole Polytechnique Fédérale de Lausanne) (submittedVersion, cc-by-nc-nd)
- Funders
- National Science Foundation (0821391)
- Topics
- Life Sciences › Biochemistry, Genetics and Molecular Biology › Molecular Biology › Gut microbiota and health
- Health Sciences › Dentistry › Periodontics › Oral microbiology and periodontitis research
- Physical Sciences › Environmental Science › Ecology › Microbial Community Ecology and Physiology
- Keywords
- human microbiota, gut microbiota, salivary microbiota, host lifestyle, microbiota dynamics, daily fluctuations, microbial community stability, Firmicutes/Bacteroidetes ratio, gastrointestinal infections, dietary fiber intake, host behavior
- MeSH terms
- Bacteria, Bacterial Infections, Developing Countries, Feces, Humans, Life Style, Longitudinal Studies, Male, Phylogeny, Saliva, Genetic Variation, Sequence Analysis, DNA, Developed Countries, High-Throughput Nucleotide Sequencing, Microbiota
About these checks
Registry, retraction, Cites and statistics results are computed, not judged, with one exception: a printed reference that no index lists is read once by a model before it counts as a citation error. Claims are extracted by a model and kept only when their quote appears verbatim in the text; each cited source is then checked, with a model’s help, for whether it says what the claim relies on. Those verdicts can be wrong — read the claim’s quote and the cited source before relying on one.
Statistics and arithmetic are recomputed, not judged.
Confidence bands are shown only for fields calibrated on our annotated test set. None is calibrated yet, so no band is shown.
What counts as a claim ›How we measure confidence ›How we check this ›
Are you an author, or do you see a problem with this page? Request a review
