

The DOI matches its Crossref record; 57 of the 58 references it cites were found in a registry or an index, and 1 are not checked yet.
The transition from HIF-1 to HIF-2 during prolonged hypoxia results from reactivation of PHDs and HIF1A mRNA instability
Open accessPublished version of a preprint
Abstract
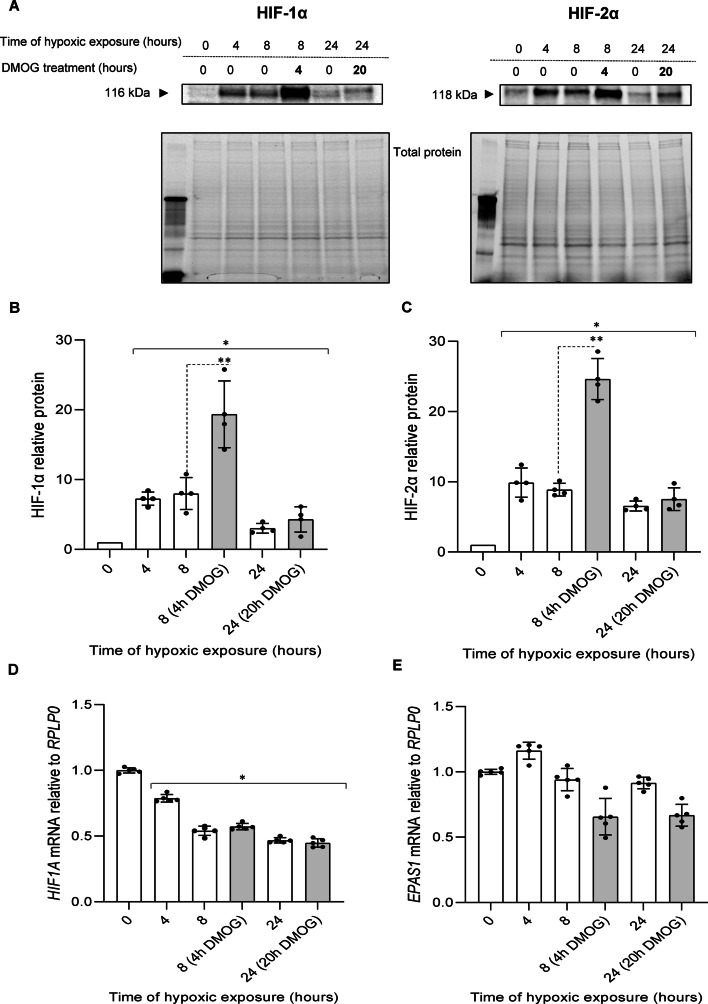
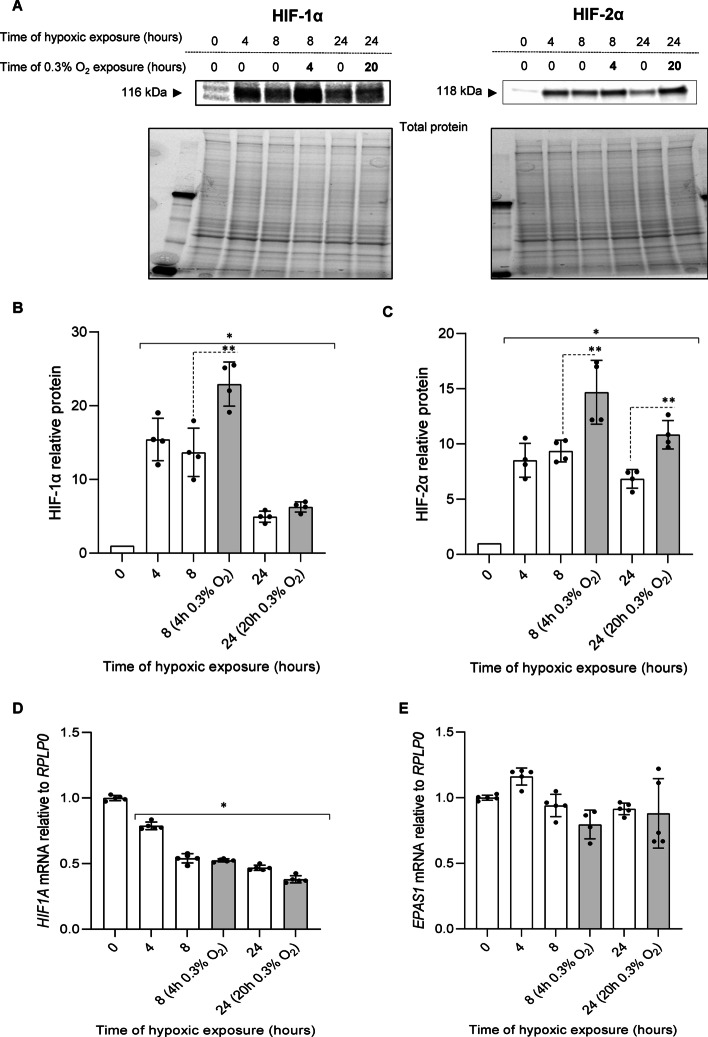
The hypoxia-inducible factors (HIF) are transcription factors that activate the adaptive hypoxic response when oxygen levels are low. The HIF transcriptional program increases oxygen delivery by inducing angiogenesis and by promoting metabolic reprograming that favors glycolysis. The two major HIFs, HIF-1 and HIF-2, mediate this response during prolonged hypoxia in an overlapping and sequential fashion that is referred to as the HIF switch. Both HIF proteins consist of an unstable alpha chain and a stable beta chain. The instability of the alpha chains is mediated by prolyl hydroxylase (PHD) activity during normoxic conditions, which leads to ubiquitination and proteasomal degradation of the alpha chains. During normoxic conditions, very little HIF-1 or HIF-2 alpha–beta dimers are present because of PHD activity. During hypoxia, however, PHD activity is suppressed, and HIF dimers are stable. Here we demonstrate that HIF-1 expression is maximal after 4 h of hypoxia in primary endothelial cells and then is dramatically reduced by 8 h. In contrast, HIF-2 is maximal at 8 h and remains elevated up to 24 h. There are differences in the HIF-1 and HIF-2 transcriptional profiles, and therefore understanding how the transition between them occurs is important and not clearly understood. Here we demonstrate that the HIF-1 to HIF-2 transition during prolonged hypoxia is mediated by two mechanisms: (1) the HIF-1 driven increase in the glycolytic pathways that reactivates PHD activity and (2) the much less stable mRNA levels of HIF-1α ( HIF1A ) compared to HIF-2α ( EPAS1 ) mRNA. We also demonstrate that the alpha mRNA levels directly correlate to the relative alpha protein levels, and therefore to the more stable HIF-2 expression during prolonged hypoxia.
Overview
The claims and statistics of this paper haven’t been checked yet.
Run the check — free, no account needed. It reads the open-access text and checks the sources it cites.
Integrity signals
Registry
Cites
Statistics
Figures
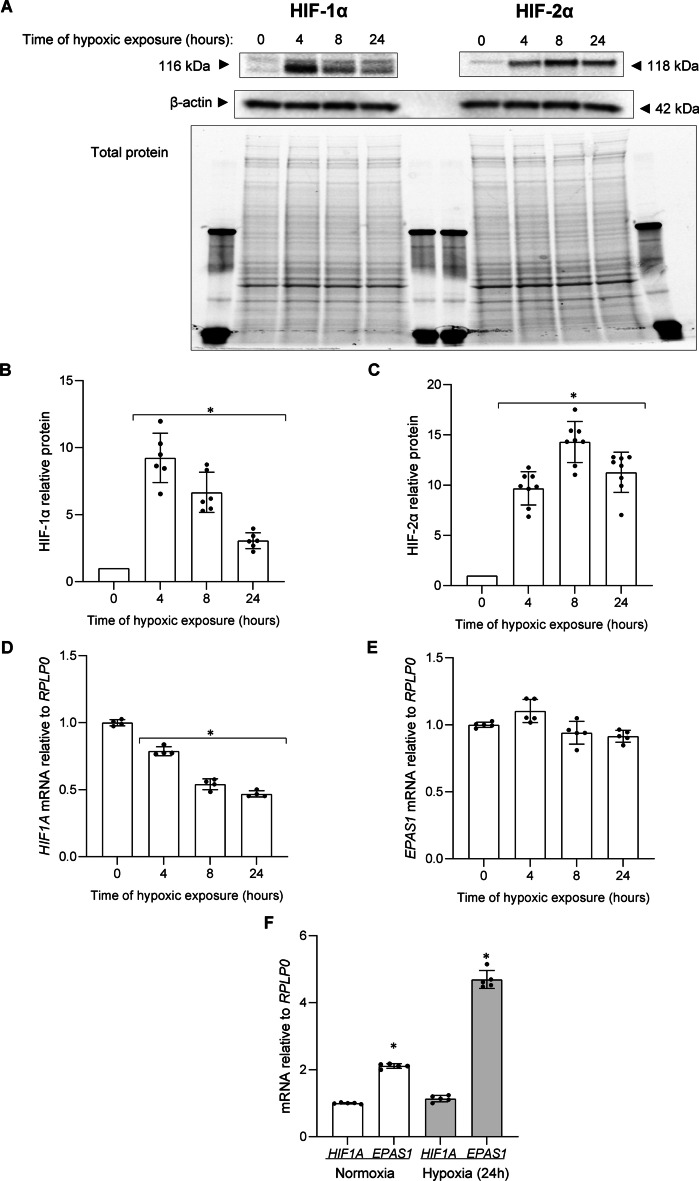
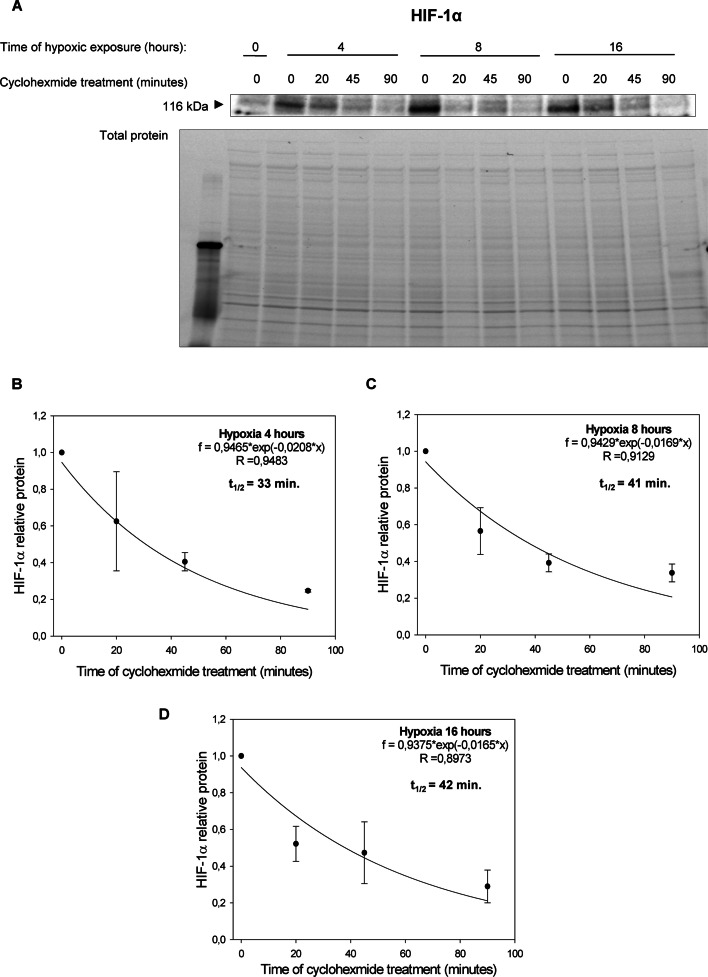
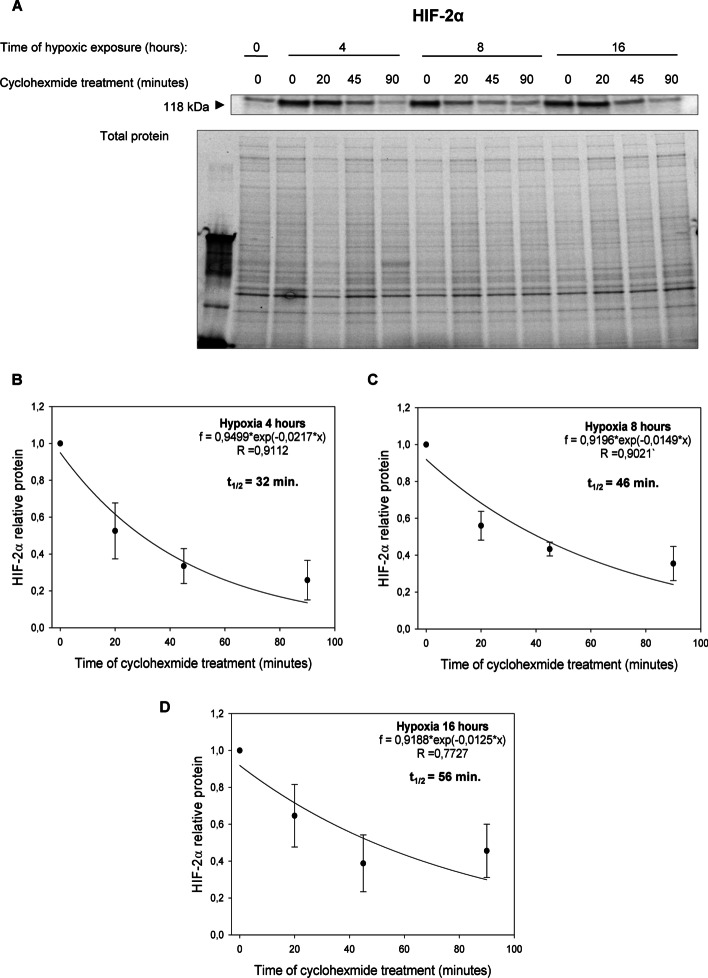
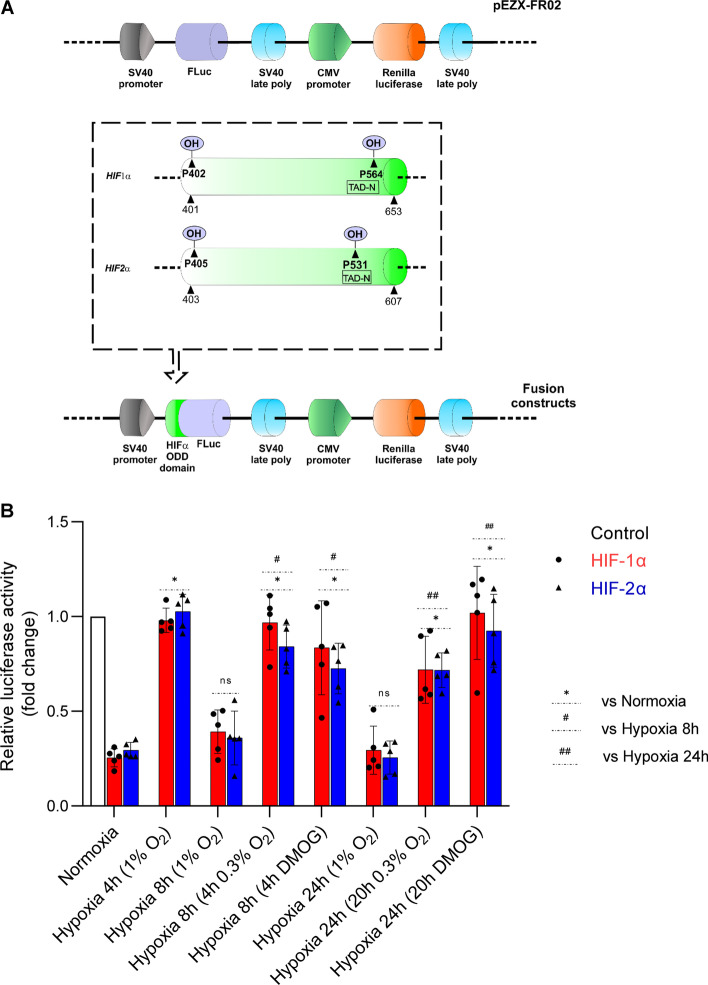
Verification
Claims the paper makes
The claims and statistics of this paper haven’t been checked yet.
Run the check — free, no account needed. It reads the open-access text and checks the sources it cites.
Claims other papers make about this one
Each is checked against this paper’s own text: does it say what the citing paper says it does?
The cited source doesn’t support the claim as written.
In the citing paper
“sustained intracellular oxygen redistribution has been reported to favor prolonged stabilization of HIF-2α [275]”
From HIF inhibition: Current strategies and clinical challenges (2026) · cites this paper as [275]
Checked by a reasoning model — may be wrong.
Experimental — accuracy not yet measuredThe cited source says what the claim attributes to it.
In the citing paper
“limitation of mitochondrial respiratory activity in hypoxic cells has been established to promote intracellular oxygen redistribution from mitochondria to the cytosol, thereby restoring prolyl hydroxylase activity and accelerating HIF-1α degradation [275,[366], [367], [368]].”
From HIF inhibition: Current strategies and clinical challenges (2026) · cites this paper as [275]
Self-check
Percentages, sums and reported differences re-computed from the paper’s own numbers.
The self-check needs the paper’s full text.
Citations
Cites
Analysis of Relative Gene Expression Data Using Real-Time Quantitative PCR and the 2−ΔΔCT Method
Livak, K. J., & Schmittgen, T. D. (2001) · Methods · doi:10.1006/meth.2001.1262 · Cited by 180,860
Proceedings of the National Academy of Sciences of the United States of America
Dowling, J. E., & Wald, G. (2009) · Nutrition Reviews · doi:10.1111/j.1753-4887.1981.tb06752.x · Cited by 17,937
Wang, G. L., Jiang, B. H., Rue, E. A., & Semenza, G. L. (1995) · Proceedings of the National Academy of Sciences · doi:10.1073/pnas.92.12.5510 · Cited by 6,212
Jaakkola, P., Mole, D. R., Tian, Y.-M., Wilson, M. I., Gielbert, J., Gaskell, S. J., Kriegsheim, A. V., Hebestreit, H. F., Mukherji, M., Schofield, C. J., et al. (2001) · Science · doi:10.1126/science.1059796 · Cited by 5,535
The tumour suppressor protein VHL targets hypoxia-inducible factors for oxygen-dependent proteolysis
Maxwell, P. H., Wiesener, M. S., Chang, G.-W., Clifford, S. C., Vaux, E. C., Cockman, M. E., Wykoff, C. C., Pugh, C. W., Maher, E. R., & Ratcliffe, P. J. (1999) · Nature · doi:10.1038/20459 · Cited by 5,180
Targeting Hypoxia-Inducible Factors for the Treatment of Anemia in Chronic Kidney Disease Patients
Locatelli, F., Fishbane, S. N., Block, G. A., & Macdougall, I. C. (2017) · American Journal of Nephrology · doi:10.1159/000455166 · Cited by 4,836
Mutation of the mouse klotho gene leads to a syndrome resembling ageing
Kuro-o, M., Matsumura, Y., Aizawa, H., Kawaguchi, H., Suga, T., Utsugi, T., Ohyama, Y., Kurabayashi, M., Kaname, T., Kume, E., et al. (1997) · Nature · doi:10.1038/36285 · Cited by 3,837
Regulation of Mammalian O 2 Homeostasis by Hypoxia-Inducible Factor 1
Semenza, G. L. (1999) · Annual Review of Cell and Developmental Biology · doi:10.1146/annurev.cellbio.15.1.551 · Cited by 1,914
Jones, M., Ibels, L. S., Schenkel, B., & Zagari, M. J. (2004) · Kidney International · doi:10.1111/j.1523-1755.2004.00450.x · Cited by 1,812
HIF1α and HIF2α: sibling rivalry in hypoxic tumour growth and progression
Keith, B., Johnson, R. S., & Simon, M. C. (2012) · Nature Reviews Cancer · doi:10.1038/nrc3183 · Cited by 1,693
General involvement of hypoxia-inducible factor 1 in transcriptional response to hypoxia.
Wang, G. L., & Semenza, G. L. (1993) · Proceedings of the National Academy of Sciences · doi:10.1073/pnas.90.9.4304 · Cited by 1,468
Differential Roles of Hypoxia-Inducible Factor 1α (HIF-1α) and HIF-2α in Hypoxic Gene Regulation
Hu, C.-J., Wang, L.-Y., Chodosh, L. A., Keith, B., & Simon, M. C. (2003) · Molecular and Cellular Biology · doi:10.1128/mcb.23.24.9361-9374.2003 · Cited by 1,386
Berra, E., Benizri, E., Ginouvès, A., Volmat, V., Roux, D., & Pouysségur, J. (2003) · The EMBO Journal · doi:10.1093/emboj/cdg392 · Cited by 1,348
Appelhoff, R. J., Tian, Y.-M., Raval, R. R., Turley, H., Harris, A. L., Pugh, C. W., Ratcliffe, P. J., & Gleadle, J. M. (2004) · Journal of Biological Chemistry · doi:10.1074/jbc.m406026200 · Cited by 1,108
Tanimoto, K., Makino, Y., Pereira, T., & Poellinger, L. (2000) · The EMBO Journal · doi:10.1093/emboj/19.16.4298 · Cited by 928
Redistribution of Intracellular Oxygen in Hypoxia by Nitric Oxide: Effect on HIF1α
Hagen, T., Taylor, C. T., Lam, F., & Moncada, S. (2003) · Science · doi:10.1126/science.1088805 · Cited by 704
Hypoxia and mitochondrial oxidative metabolism
Solaini, G., Baracca, A., Lenaz, G., & Sgarbi, G. (2010) · Biochimica et Biophysica Acta (BBA) - Bioenergetics · doi:10.1016/j.bbabio.2010.02.011 · Cited by 628
Passing the baton: the HIF switch
Koh, M. Y., & Powis, G. (2012) · Trends in Biochemical Sciences · doi:10.1016/j.tibs.2012.06.004 · Cited by 589
Identification of a target RNA motif for RNA-binding protein HuR
de Silanes, I. L., Zhan, M., Lal, A., Yang, X., & Gorospe, M. (2004) · Proceedings of the National Academy of Sciences · doi:10.1073/pnas.0306453101 · Cited by 502
Uchida, T., Rossignol, F., Matthay, M. A., Mounier, R., Couette, S., Clottes, E., & Clérici, C. (2004) · Journal of Biological Chemistry · doi:10.1074/jbc.m400461200 · Cited by 453
Koivunen, P., Hirsilä, M., Günzler, V., Kivirikko, K. I., & Myllyharju, J. (2004) · Journal of Biological Chemistry · doi:10.1074/jbc.m312254200 · Cited by 447
Perspectives on Oxygen Sensing
Semenza, G. L. (1999) · Cell · doi:10.1016/s0092-8674(00)81957-1 · Cited by 385
Hypoxia inhibits expression of eNOS via transcriptional and posttranscriptional mechanisms
McQuillan, L. P., Leung, G., Marsden, P. A., Kostyk, S. K., & Kourembanas, S. (1994) · American Journal of Physiology-Heart and Circulatory Physiology · doi:10.1152/ajpheart.1994.267.5.h1921 · Cited by 382
HIF hydroxylation and the mammalian oxygen-sensing pathway
Safran, M., & Kaelin, W. G. (2003) · Journal of Clinical Investigation · doi:10.1172/jci18181 · Cited by 368
HIF hydroxylation and the mammalian oxygen-sensing pathway
Safran, M., & Kaelin, W. G. (2003) · Journal of Clinical Investigation · doi:10.1172/jci200318181 · Cited by 365
Koh, M. Y., Lemos, R., Liu, X., & Powis, G. (2011) · Cancer Research · doi:10.1158/0008-5472.can-10-4142 · Cited by 350
miRNAs regulate the HIF switch during hypoxia: a novel therapeutic target
Serocki, M., Bartoszewska, S., Janaszak-Jasiecka, A., Ochocka, R. J., Collawn, J. F., & Bartoszewski, R. (2018) · Angiogenesis · doi:10.1007/s10456-018-9600-2 · Cited by 288
Self-citationRNA-Binding Proteins HuR and PTB Promote the Translation of Hypoxia-Inducible Factor 1α
Galbán, S., Kuwano, Y., Pullmann, R., Martindale, J. L., Kim, H. H., Lal, A., Abdelmohsen, K., Yang, X., Dang, Y., Liu, J. O., et al. (2007) · Molecular and Cellular Biology · doi:10.1128/mcb.00973-07 · Cited by 288
Increased Prolyl 4-Hydroxylase Domain Proteins Compensate for Decreased Oxygen Levels
Stiehl, D. P., Wirthner, R., Köditz, J., Spielmann, P., Camenisch, G., & Wenger, R. H. (2006) · Journal of Biological Chemistry · doi:10.1074/jbc.m601719200 · Cited by 286
Bracken, C. P., Fedele, A. O., Linke, S., Balrak, W., Lisy, K., Whitelaw, M. L., & Peet, D. J. (2006) · Journal of Biological Chemistry · doi:10.1074/jbc.m600288200 · Cited by 222
Bartoszewski, R., Moszyńska, A., Serocki, M., Cabaj, A., Polten, A., Ochocka, R., Dell'Italia, L., Bartoszewska, S., Króliczewski, J., Dąbrowski, M., et al. (2019) · The FASEB Journal · doi:10.1096/fj.201802650rr · Cited by 199
Self-citationChua, Y. L., Dufour, E., Dassa, E. P., Rustin, P., Jacobs, H. T., Taylor, C. T., & Hagen, T. (2010) · Journal of Biological Chemistry · doi:10.1074/jbc.m110.158485 · Cited by 189
Cioffi, C. L., Liu, X., Kosinski, P. A., Garay, M., & Bowen, B. R. (2003) · Biochemical and Biophysical Research Communications · doi:10.1016/s0006-291x(03)00453-4 · Cited by 173
Functional Importance of Dicer Protein in the Adaptive Cellular Response to Hypoxia
Ho, J. J. D., Metcalf, J. L., Yan, M. S., Turgeon, P. J., Wang, J. J., Chalsev, M., Petruzziello-Pellegrini, T. N., Tsui, A. K. Y., He, J. Z., Dhamko, H., et al. (2012) · Journal of Biological Chemistry · doi:10.1074/jbc.m112.373365 · Cited by 159
Proteome-wide mapping of short-lived proteins in human cells
Li, J., Cai, Z., Vaites, L. P., Shen, N., Mitchell, D. C., Huttlin, E. L., Paulo, J. A., Harry, B. L., & Gygi, S. P. (2021) · Molecular Cell · doi:10.1016/j.molcel.2021.09.015 · Cited by 159
Fish, J. E., Matouk, C. C., Yeboah, E., Bevan, S. C., Khan, M., Patil, K., Ohh, M., & Marsden, P. A. (2007) · Journal of Biological Chemistry · doi:10.1074/jbc.m608318200 · Cited by 156
Robb, G. B., Carson, A. R., Tai, S. C., Fish, J. E., Singh, S., Yamada, T., Scherer, S. W., Nakabayashi, K., & Marsden, P. A. (2004) · Journal of Biological Chemistry · doi:10.1074/jbc.m400271200 · Cited by 148
Rossignol, F., Vaché, C., & Clottes, E. (2002) · Gene · doi:10.1016/s0378-1119(02)01049-1 · Cited by 147
Bartoszewska, S., Rochan, K., Piotrowski, A., Kamysz, W., Ochocka, J. R., Collawn, J. F., & Bartoszewski, R. (2014) · The FASEB Journal · doi:10.1096/fj.14-267054 · Cited by 139
Self-citationDoege, K., Heine, S., Jensen, I., Jelkmann, W., & Metzen, E. (2005) · Blood · doi:10.1182/blood-2005-03-1138 · Cited by 128
Chamboredon, S., Ciais, D., Desroches‐Castan, A., Savi, P., Bono, F., Feige, J., & Cherradi, N. (2011) · Molecular Biology of the Cell · doi:10.1091/mbc.e10-07-0617 · Cited by 126
The role of hypoxia-inducible factor-2 in digestive system cancers
Zhao, J., Du, F., Shen, G., Zheng, F., & Xu, B. (2015) · Cell Death & Disease · doi:10.1038/cddis.2014.565 · Cited by 122
A dynamic model of the hypoxia-inducible factor 1-alpha (HIF-1α) network
Nguyen, L. K., Cavadas, M. A. S., Scholz, C. C., Fitzpatrick, S. F., Brüning, U., Cummins, E. P., Tambuwala, M. M., Manresa, M. C., Kholodenko, B. Ν., Taylor, C. T., et al. (2013) · Journal of Cell Science · doi:10.1242/jcs.119974 · Cited by 115
Fujita, N., Chiba, K., Shapiro, I. M., & Risbud, M. V. (2011) · Journal of Bone and Mineral Research · doi:10.1002/jbmr.538 · Cited by 91
Duscher, D., Januszyk, M., Maan, Z. N., Whittam, A. J., Hu, M. S.-M., Walmsley, G. G., Dong, Y., Khong, S. M. L., Longaker, M. T., & Gurtner, G. C. (2017) · Plastic & Reconstructive Surgery · doi:10.1097/prs.0000000000003072 · Cited by 86
eNOS expression and NO release during hypoxia is inhibited by miR-200b in human endothelial cells
Janaszak‐Jasiecka, A., Siekierzycka, A., Bartoszewska, S., Serocki, M., Dobrucki, L. W., Collawn, J. F., Kalinowski, L., & Bartoszewski, R. (2018) · Angiogenesis · doi:10.1007/s10456-018-9620-y · Cited by 85
Self-citationJanaszak-Jasiecka, A., Bartoszewska, S., Kochan, K., Piotrowski, A., Kalinowski, L., Kamysz, W., Ochocka, R. J., Bartoszewski, R., & Collawn, J. F. (2016) · Scientific Reports · doi:10.1038/srep22775 · Cited by 81
Self-citationKalinowski, L., Janaszak‐Jasiecka, A., Siekierzycka, A., Bartoszewska, S., Woźniak, M., Lejnowski, D., Collawn, J. F., & Bartoszewski, R. (2016) · Cellular & Molecular Biology Letters · doi:10.1186/s11658-016-0017-x · Cited by 63
Self-citationmiR-200b downregulates Kruppel Like Factor 2 (KLF2) during acute hypoxia in human endothelial cells
Bartoszewski, R., Serocki, M., Janaszak‐Jasiecka, A., Bartoszewska, S., Kochan-Jamrozy, K., Piotrowski, A., Króliczewski, J., & Collawn, J. F. (2017) · European Journal of Cell Biology · doi:10.1016/j.ejcb.2017.10.001 · Cited by 56
Self-citationMoszyńska, A., Jaśkiewicz, M., Serocki, M., Cabaj, A., Crossman, D. K., Bartoszewska, S., Gebert, M., Dąbrowski, M., Collawn, J. F., & Bartoszewski, R. (2022) · The FASEB Journal · doi:10.1096/fj.202101987r · Cited by 53
Self-citationTristetraprolin regulates the stability of HIF-1α mRNA during prolonged hypoxia
Kim, T. W., Yim, S., Choi, B. J., Jang, Y., Lee, J. J., Sohn, B. H., Yoo, H., Yeom, Y. I., & Park, K. C. (2009) · Biochemical and Biophysical Research Communications · doi:10.1016/j.bbrc.2009.11.174 · Cited by 53
miR-200b downregulates CFTR during hypoxia in human lung epithelial cells
Bartoszewska, S., Kamysz, W., Jakieła, B., Sanak, M., Króliczewski, J., Bebők, Z., Bartoszewski, R., & Collawn, J. F. (2017) · Cellular & Molecular Biology Letters · doi:10.1186/s11658-017-0054-0 · Cited by 53
Self-citationThe Role of the Hypoxia-Related Unfolded Protein Response (UPR) in the Tumor Microenvironment
Bartoszewska, S., Collawn, J. F., & Bartoszewski, R. (2022) · Cancers · doi:10.3390/cancers14194870 · Cited by 43
Self-citationCabaj, A., Moszyńska, A., Charzyńska, A., Bartoszewski, R., & Dąbrowski, M. (2022) · Cellular Signalling · doi:10.1016/j.cellsig.2021.110209 · Cited by 37
Self-citationJaśkiewicz, M., Moszyńska, A., Serocki, M., Króliczewski, J., Bartoszewska, S., Collawn, J. F., & Bartoszewski, R. (2022) · IfADo - Leibniz Research Centre for Working Environment and Human Factors, Dortmund · doi:10.17179/excli2021-4622 · Cited by 37
Self-citationHIF1α stabilization in hypoxia is not oxidant-initiated
Kumar, A., Vaish, M., Karuppagounder, S. S., Gazaryan, I., Cave, J. W., Starkov, A. A., Anderson, E. T., Zhang, S., Pinto, J. T., Rountree, A. M., et al. (2021) · eLife · doi:10.7554/elife.72873 · Cited by 34
Inhibition of firefly luciferase activity by a HIF prolyl hydroxylase inhibitor
Günter, J., Wenger, R. H., & Scholz, C. C. (2020) · Journal of Photochemistry and Photobiology B Biology · doi:10.1016/j.jphotobiol.2020.111980 · Cited by 12
HIF2 ODD-luciferase reporter: the most sensitive assay for HIF prolyl hydroxylase inhibitors
Smirnova, N. A., Osipyants, A. I., Khristichenko, A. Y., Hushpulian, D. M., Nikulin, S. V., Chubar, T. A., Zakhariants, A. A., Tishkov, V. I., Gazaryan, I. G., & Poloznikov, A. A. (2018) · Russian Chemical Bulletin · doi:10.1007/s11172-018-2051-5 · Cited by 8
Research works printed but not linked: 1
- Smirnova NA, Osipyants AI, Khristichenko AY, Hushpulian DM, Nikulin SV, Chubar TA, et al. HIF2 ODD-luciferase reporter: the most sensitive assay for HIF prolyl hydroxylase inhibitors. Russ Chem Bull. 2018;67(1):150–6. · DOI
Cited by
Sorted by citations
The Distinct Role of HIF-1α and HIF-2α in Hypoxia and Angiogenesis
Bakleh, M. Z., & Zen, A. A. H. (2025) · Cells · doi:10.3390/cells14090673 · Cited by 190
Mazumder, S., Higgins, P. J., & Samarakoon, R. (2023) · Cancers · doi:10.3390/cancers15041316 · Cited by 118
Mechanisms underlying the health benefits of intermittent hypoxia conditioning
Burtscher, J., Citherlet, T., Camacho-Cardeñosa, A., Camacho-Cardeñosa, M., Raberin, A., Krumm, B., Hohenauer, E., Egg, M., Lichtblau, M., Müller, J., et al. (2023) · The Journal of Physiology · doi:10.1113/jp285230 · Cited by 132
Hypoxia-inducible factor in cancer: from pathway regulation to therapeutic opportunity
Ortmann, B. M. (2024) · BMJ Oncology · doi:10.1136/bmjonc-2023-000154 · Cited by 67
Ruan, H., Zhang, Q., Zhang, Y., Li, S., & Ran, X. (2024) · Critical Care · doi:10.1186/s13054-024-04885-4 · Cited by 60
Metadata
- Authors
- Jaśkiewicz, M., Moszyńska, A., Króliczewski, J., Cabaj, A., Bartoszewska, S., Charzyńska, A., Gebert, M., Dąbrowski, M., Collawn, J. F., & Bartoszewski, R.
- Affiliations
- Gdańsk Medical University (PL)
- Instytut Biologii Doświadczalnej im. Marcelego Nenckiego (PL)
- University of Alabama at Birmingham (US)
- ORCID
- Venue
- Cellular & Molecular Biology Letters
- Published
- 2022-12
- Volume
- 27
- Issue
- 1
- Pages
- 109-109
- ISSN
- 1425-8153 (ISSN-L)
- 1689-1392
- PMC
- PMC9730601
- OpenAlex
- W4311079783
- Cited by
- 143
- References
- 58
- Citations by year
- 2026: 37 · 2025: 46 · 2024: 39 · 2023: 20 · 2022: 1
- FWCI
- 11.17
- Type
- journal article
- Language
- en
- Open access
- gold
- doi.org
- Locations
- Cellular & Molecular Biology Letters (publishedVersion, cc-by)
- Research Square (acceptedVersion, cc-by)
- PubMed Central (publishedVersion, cc-by)
- PubMed (publishedVersion)
- DOAJ (DOAJ: Directory of Open Access Journals) (submittedVersion, cc-by-sa)
- Funders
- Narodowe Centrum Nauki (2015/18/E/NZ3/00687)
- Topics
- Life Sciences › Biochemistry, Genetics and Molecular Biology › Cancer Research › Cancer, Hypoxia, and Metabolism
- Health Sciences › Medicine › Hematology › Erythropoietin and Anemia Treatment
- Life Sciences › Biochemistry, Genetics and Molecular Biology › Molecular Biology › Angiogenesis and VEGF in Cancer
- Keywords
- hypoxia-inducible factor, HIF-1, HIF-2, prolyl hydroxylase, EPAS1, HIF-1α, HIF-2α, glycolysis, endothelial cells, hypoxia response, transcriptional regulation, mRNA stability
- MeSH terms
- Endothelial PAS Domain-Containing Protein 1, Humans, Oxygen, RNA, Messenger, Cell Hypoxia, RNA Stability, Endothelial Cells, Basic Helix-Loop-Helix Proteins, Basic Helix-Loop-Helix Transcription Factors, Hypoxia-Inducible Factor 1, alpha Subunit
About these checks
Registry, retraction, Cites and statistics results are computed, not judged, with one exception: a printed reference that no index lists is read once by a model before it counts as a citation error. Claims are extracted by a model and kept only when their quote appears verbatim in the text; each cited source is then checked, with a model’s help, for whether it says what the claim relies on. Those verdicts can be wrong — read the claim’s quote and the cited source before relying on one.
Statistics and arithmetic are recomputed, not judged.
Confidence bands are shown only for fields calibrated on our annotated test set. None is calibrated yet, so no band is shown.
What counts as a claim ›How we measure confidence ›How we check this ›
Are you an author, or do you see a problem with this page? Request a review
