

The DOI matches its Crossref record; 39 of the 39 references it cites were found in a registry or an index.
Integrative phenotyping framework (iPF): integrative clustering of multiple omics data identifies novel lung disease subphenotypes
Open accessAbstract
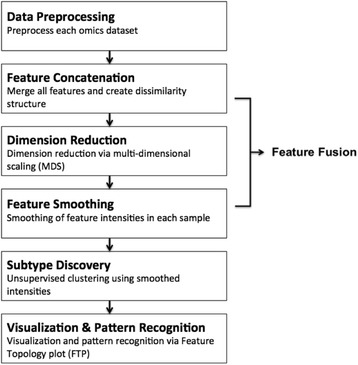
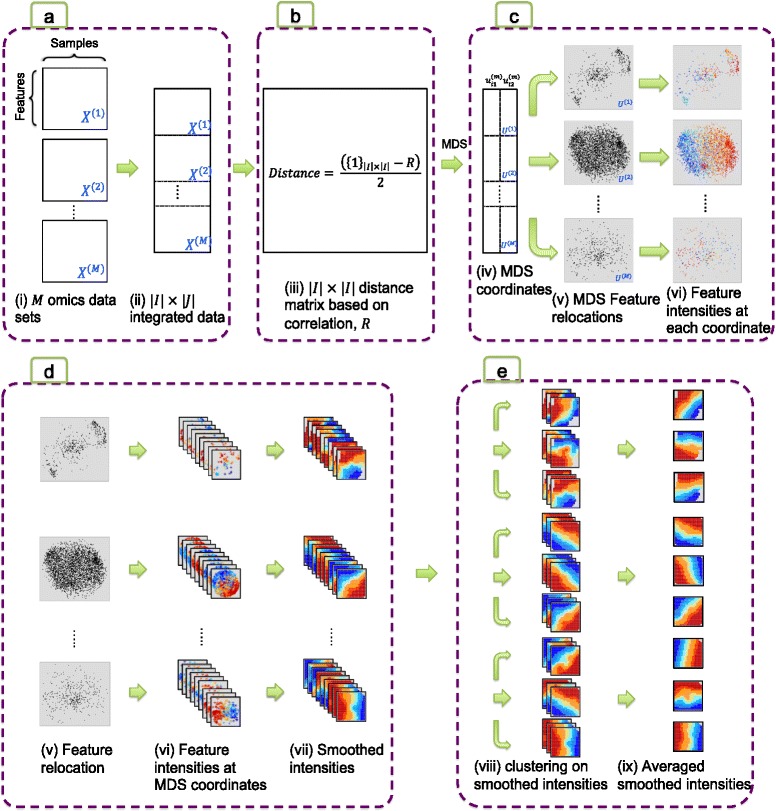
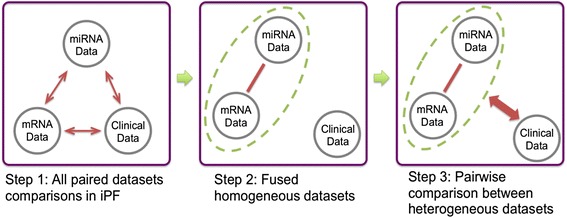
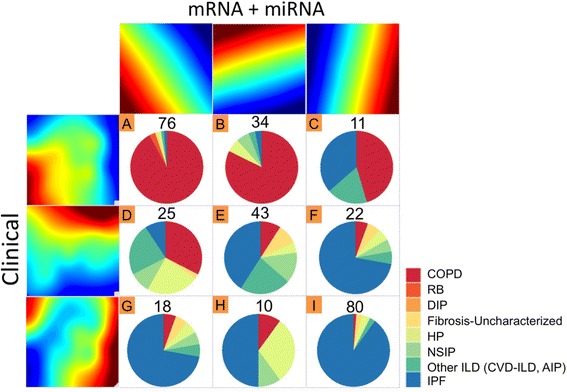
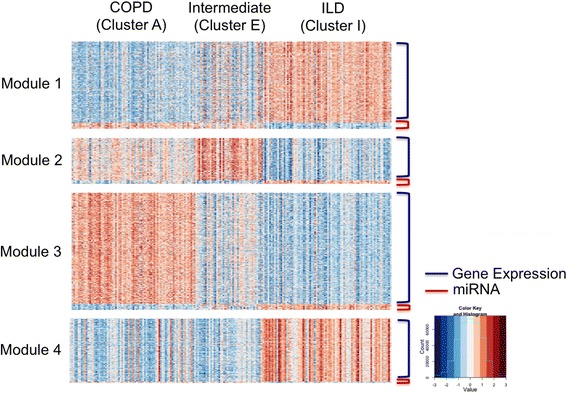
BACKGROUND: The increased multi-omics information on carefully phenotyped patients in studies of complex diseases requires novel methods for data integration. Unlike continuous intensity measurements from most omics data sets, phenome data contain clinical variables that are binary, ordinal and categorical. RESULTS: In this paper we introduce an integrative phenotyping framework (iPF) for disease subtype discovery. A feature topology plot was developed for effective dimension reduction and visualization of multi-omics data. The approach is free of model assumption and robust to data noises or missingness. We developed a workflow to integrate homogeneous patient clustering from different omics data in an agglomerative manner and then visualized heterogeneous clustering of pairwise omics sources. We applied the framework to two batches of lung samples obtained from patients diagnosed with chronic obstructive lung disease (COPD) or interstitial lung disease (ILD) with well-characterized clinical (phenomic) data, mRNA and microRNA expression profiles. Application of iPF to the first training batch identified clusters of patients consisting of homogenous disease phenotypes as well as clusters with intermediate disease characteristics. Analysis of the second batch revealed a similar data structure, confirming the presence of intermediate clusters. Genes in the intermediate clusters were enriched with inflammatory and immune functional annotations, suggesting that they represent mechanistically distinct disease subphenotypes that may response to immunomodulatory therapies. The iPF software package and all source codes are publicly available. CONCLUSIONS: Identification of subclusters with distinct clinical and biomolecular characteristics suggests that integration of phenomic and other omics information could lead to identification of novel mechanism-based disease sub-phenotypes.
Overview
The claims and statistics of this paper haven’t been checked yet.
Run the check — free, no account needed. It reads the open-access text and checks the sources it cites.
Integrity signals
Registry
Cites
Statistics
Figures
Verification
Claims the paper makes
The claims and statistics of this paper haven’t been checked yet.
Run the check — free, no account needed. It reads the open-access text and checks the sources it cites.
Claims other papers make about this one
Each is checked against this paper’s own text: does it say what the citing paper says it does?
The source backs part of the claim, not all of it — or backs it for a different population, condition or comparison.
In the citing paper
“These approaches are particularly valuable for identifying early biomarkers and disease subtypes, potentially enabling targeted intervention before irreversible damage occurs [161, 162].”
From Artificial intelligence-powered prediction of diabetic complications: from clinical data to molecular omics (2026) · cites this paper as [161]
Experimental — accuracy not yet measured
Self-check
Percentages, sums and reported differences re-computed from the paper’s own numbers.
The self-check needs the paper’s full text.
Citations
Cites
Vestbo, J., Hurd, S. S., Agustí, A. G., Jones, P. W., Vogelmeier, C., Anzueto, A., Barnes, P. J., Fabbri, L. M., Martinez, F. J., Nishimura, M., et al. (2013) · American Journal of Respiratory and Critical Care Medicine · doi:10.1164/rccm.201204-0596pp · Cited by 15,983
Robinson, J. T., Thorvaldsdóttir, H., Winckler, W., Guttman, M., Lander, E. S., Getz, G., & Mesirov, J. P. (2011) · Nature Biotechnology · doi:10.1038/nbt.1754 · Cited by 15,390
Hubert, L., & Arabie, P. (1985) · Journal of Classification · doi:10.1007/bf01908075 · Cited by 8,219
Comprehensive genomic characterization defines human glioblastoma genes and core pathways
The Cancer Genome Atlas Research Network (2008) · Nature · doi:10.1038/nature07385 · Cited by 7,735
Raghu, G., Collard, H. R., Egan, J. J., Martinez, F. J., Behr, J., Brown, K. K., Colby, T. V., Cordier, J.-F., Flaherty, K. R., Lasky, J. A., et al. (2011) · American Journal of Respiratory and Critical Care Medicine · doi:10.1164/rccm.2009-040gl · Cited by 7,186
Estimating the Number of Clusters in a Data Set Via the Gap Statistic
Tibshirani, R., Walther, G., & Hastie, T. (2001) · Journal of the Royal Statistical Society Series B: Statistical Methodology · doi:10.1111/1467-9868.00293 · Cited by 6,205
Wood, S. (2003) · Journal of the Royal Statistical Society Series B (Statistical Methodology) · doi:10.1111/1467-9868.00374 · Cited by 2,580
Integrative genomics identifies MCU as an essential component of the mitochondrial calcium uniporter
Baughman, J. M., Perocchi, F., Girgis, H. S., Plovanich, M., Belcher-Timme, C. A., Sancak, Y., Bao, X. R., Strittmatter, L., Goldberger, O., Bogorad, R. L., et al. (2011) · Nature · doi:10.1038/nature10234 · Cited by 1,953
Selman, M., King, T. E., & Pardo, A. (2001) · Annals of Internal Medicine · doi:10.7326/0003-4819-134-2-200101160-00015 · Cited by 1,807
Prednisone, Azathioprine, and N -Acetylcysteine for Pulmonary Fibrosis
The Idiopathic Pulmonary Fibrosis Clinical Research Network (2012) · New England Journal of Medicine · doi:10.1056/nejmoa1113354 · Cited by 1,654
Shen, R., Olshen, A. B., & Ladanyi, M. (2009) · Bioinformatics · doi:10.1093/bioinformatics/btp543 · Cited by 849
Clustering Rules: A Comparison of Partitioning and Hierarchical Clustering Algorithms
Reynolds, A., Richards, G., de la Iglesia, B., & Rayward-Smith, V. J. (2006) · Journal of Mathematical Modelling and Algorithms · doi:10.1007/s10852-005-9022-1 · Cited by 594
Joint and individual variation explained (JIVE) for integrated analysis of multiple data types
Lock, E. F., Hoadley, K. A., Marron, J. S., & Nobel, A. B. (2013) · The Annals of Applied Statistics · doi:10.1214/12-aoas597 · Cited by 572
Shen, R., Olshen, A. B., & Ladanyi, M. (2010) · Bioinformatics · doi:10.1093/bioinformatics/btp659 · Cited by 564
Comprehensive literature review and statistical considerations for microarray meta-analysis
Tseng, G. C., Ghosh, D., & Feingold, E. (2012) · Nucleic Acids Research · doi:10.1093/nar/gkr1265 · Cited by 532
Self-citationIntegrating multiple ‘omics’ analysis for microbial biology: application and methodologies
Zhang, W., Feng, L., & Nie, L. (2009) · Microbiology · doi:10.1099/mic.0.034793-0 · Cited by 511
Incidence, Prevalence, and Clinical Course of Idiopathic Pulmonary Fibrosis
Pérez, E. R. F., Daniels, C. E., Sauver, J. L. S., Hartman, T. E., Bartholmai, B. J., Yi, E. S., Ryu, J. H., & Schroeder, D. R. (2009) · CHEST Journal · doi:10.1378/chest.09-1002 · Cited by 508
Mechanism of action of hydroxychloroquine as an antirheumatic drug
Fox, R. I. (1993) · Seminars in Arthritis and Rheumatism · doi:10.1016/s0049-0172(10)80012-5 · Cited by 430
Discovery of multi-dimensional modules by integrative analysis of cancer genomic data
Zhang, S., Liu, C.-C., Li, W., Shen, H., Laird, P. W., & Zhou, X. J. (2012) · Nucleic Acids Research · doi:10.1093/nar/gks725 · Cited by 374
Lock, E. F., & Dunson, D. B. (2013) · Bioinformatics · doi:10.1093/bioinformatics/btt425 · Cited by 320
Ryerson, C. J., Hartman, T. E., Elicker, B. M., Ley, B., Lee, J. S., Abbritti, M., Jones, K. D., King, T. E., Ryu, J. H., & Collard, H. R. (2013) · CHEST Journal · doi:10.1378/chest.12-2403 · Cited by 316
Accelerated Variant of Idiopathic Pulmonary Fibrosis: Clinical Behavior and Gene Expression Pattern
Selman, M., Carrillo, G., Estrada, A., Mejía, M. E., Becerril, C., Cisneros, J., Gaxiola, M., Pérez‐Padilla, R., Navarro, C., Richards, T. J., et al. (2007) · PLoS ONE · doi:10.1371/journal.pone.0000482 · Cited by 274
Self-citationMessy biology and the origins of evolutionary innovations
Tawfik, D. S. (2010) · Nature Chemical Biology · doi:10.1038/nchembio.441 · Cited by 251
Integrated omics approaches in plant systems biology
Fukushima, A., Kusano, M., Redestig, H., Arita, M., & Saito, K. (2009) · Current Opinion in Chemical Biology · doi:10.1016/j.cbpa.2009.09.022 · Cited by 243
Computational Medicine: Translating Models to Clinical Care
Winslow, R. L., Trayanova, N. A., Geman, D., & Miller, M. I. (2012) · Science Translational Medicine · doi:10.1126/scitranslmed.3003528 · Cited by 210
The challenges of integrating multi-omic data sets
Palsson, B., & Zengler, K. (2010) · Nature Chemical Biology · doi:10.1038/nchembio.462 · Cited by 178
A functional methylome map of ulcerative colitisPreprint
Häsler, R., Feng, Z., Bäckdahl, L., Spehlmann, M. E., Franke, A., Teschendorff, A. E., Rakyan, V. K., Down, T. A., Wilson, G. A., Feber, A., et al. (2012) · Genome Research · doi:10.1101/gr.138347.112 · Cited by 149
Corticosteroids and the Treatment of Idiopathic Pulmonary Fibrosis
Mapel, D. W., Samet, J. M., & Coultas, D. (1996) · CHEST Journal · doi:10.1378/chest.110.4.1058 · Cited by 146
Selman, M., King, T. E., & Pardo, A. (2001) · Cited by 144
Identifying multi-layer gene regulatory modules from multi-dimensional genomic data
Li, W., Zhang, S., Liu, C.-C., & Zhou, X. J. (2012) · Bioinformatics · doi:10.1093/bioinformatics/bts476 · Cited by 142
The Cancer Genome Atlas Research Network (2013) · Nature · doi:10.1038/nature11903 · Cited by 135
CNAmet: an R package for integrating copy number, methylation and expression data
Louhimo, R., & Hautaniemi, S. (2011) · Bioinformatics · doi:10.1093/bioinformatics/btr019 · Cited by 116
Mechanism of Action of Antimalarial Drugs: Inhibition of Antigen Processing and Presentation
Fox, R. I., & Kang, H. (1993) · Lupus · doi:10.1177/0961203393002001031 · Cited by 104
Refractory Nephrotic Syndrome in Lupus Nephritis: Favorable Response to Indomethacin Therapy
Espinoza, L. R., Jara, L. J., Martínez-Osuna, P., Silveira, L. H., Cuellar, M. L., & Seleznick, M. J. (1993) · Lupus · doi:10.1177/096120339300200103 · Cited by 61
Correction: Corrigendum: Mesoangioblast stem cells ameliorate muscle function in dystrophic dogs
Sampaolesi, M., Blot, S., D’Antona, G., Granger, N. P., Tonlorenzi, R., Innocenzi, A., Mognol, P., Thibaud, J. L., Gálvez, B. G., Barthélémy, I., et al. (2013) · Nature · doi:10.1038/nature11976 · Cited by 56
Hyndman, R. J., & Grunwald, G. K. (2000) · Australian & New Zealand Journal of Statistics · doi:10.1111/1467-842x.00115 · Cited by 48
A Double-Layered Mixture Model for the Joint Analysis of DNA Copy Number and Gene Expression Data
Choi, H., Qin, Z. S., & Ghosh, D. (2010) · Journal of Computational Biology · doi:10.1089/cmb.2009.0019 · Cited by 17
Leday, G. G. R., van der Vaart, A., van Wieringen, W. N., & van de Wiel, M. A. (2013) · The Annals of Applied Statistics · doi:10.1214/12-aoas605 · Cited by 14
Gehlenborg, N., & Wong, B. (2012) · Nature Methods · doi:10.1038/nmeth.1944 · Cited by 5
Cited by
Sorted by citations
Microbiome definition re-visited: old concepts and new challenges
Berg, G., Rybakova, D., Fischer, D., Cernava, T., Vergès, M.-C. C., Charles, T., Chen, X., Cocolin, L., Eversole, K., Corral, G. H., et al. (2020) · Microbiome · doi:10.1186/s40168-020-00875-0 · Cited by 2,275
Thyroid hormone inhibits lung fibrosis in mice by improving epithelial mitochondrial function
Yu, G., Τzouvelekis, Α., Wang, R., Herazo‐Maya, J. D., Ibarra, G. H., Srivastava, A., Werneck‐de‐Castro, J. P., DeIuliis, G., Ahangari, F., Woolard, T., et al. (2017) · Nature Medicine · doi:10.1038/nm.4447 · Cited by 360
Self-citationPhenotypes in obstructive sleep apnea: A definition, examples and evolution of approaches
Zinchuk, A. V., Gentry, M. J., Concato, J., & Yaggi, H. K. (2017) · Sleep Medicine Reviews · doi:10.1016/j.smrv.2016.10.002 · Cited by 350
Zinchuk, A. V., & Yaggi, H. K. (2019) · CHEST Journal · doi:10.1016/j.chest.2019.09.002 · Cited by 314
Characterization of the COPD alveolar niche using single-cell RNA sequencing
Sauler, M., McDonough, J. E., Adams, T. S., Kothapalli, N., Bärnthaler, T., Werder, R. B., Schupp, J. C., Nouws, J., Robertson, M. J., Coarfa, C., et al. (2022) · Nature Communications · doi:10.1038/s41467-022-28062-9 · Cited by 255
Self-citation
Metadata
- Authors
- Kim, S., Herazo-Maya, J. D., Kang, D. D., Juan-Guardela, B. M., Tedrow, J., Martinez, F. J., Sciurba, F. C., Tseng, G. C., & Kaminski, N.
- Affiliations
- University of Pittsburgh (US)
- Lawrence Berkeley National Laboratory (US)
- Yale University (US)
- Corresponding author
- Tseng, George C.
- Kaminski, Naftali
- Venue
- BMC Genomics
- Published
- 2015-11-11
- Volume
- 16
- Issue
- 1
- Pages
- 924-924
- ISSN
- 1471-2164 (ISSN-L)
- PMC
- PMC4642618
- OpenAlex
- W2163675951
- Cited by
- 123
- References
- 39
- Citations by year
- 2026: 6 · 2025: 10 · 2024: 20 · 2023: 18 · 2022: 12 · 2021: 11 · 2020: 10 · 2019: 11 · 2018: 7 · 2017: 9 · 2016: 8
- FWCI
- 3.48
- Type
- journal article
- Language
- en
- Open access
- gold
- doi.org
- Locations
- BMC Genomics (publishedVersion, cc-by)
- Europe PMC (PubMed Central) (publishedVersion, cc-by)
- PubMed Central (publishedVersion, cc-by)
- PubMed (publishedVersion)
- D-Scholarship@Pitt (University of Pittsburgh) (acceptedVersion)
- Funders
- National Institutes of Health (U01-HL108642, RC2-HL101715)
- Topics
- Life Sciences › Biochemistry, Genetics and Molecular Biology › Molecular Biology › Bioinformatics and Genomic Networks
- Health Sciences › Medicine › Pulmonary and Respiratory Medicine › Chronic Obstructive Pulmonary Disease (COPD) Research
- Life Sciences › Biochemistry, Genetics and Molecular Biology › Molecular Biology › Gene expression and cancer classification
- Keywords
- multi-omics integration, disease subphenotypes, patient clustering, chronic obstructive pulmonary disease, interstitial lung disease, mRNA expression, microRNA expression, dimensionality reduction, agglomerative clustering, immunomodulatory therapy
- MeSH terms
- Algorithms, Computer Simulation, Humans, Lung Diseases, Phenotype, Cluster Analysis, Discriminant Analysis, Computational Biology, Genomics, Workflow, Molecular Sequence Annotation, Datasets as Topic
About these checks
Registry, retraction, Cites and statistics results are computed, not judged, with one exception: a printed reference that no index lists is read once by a model before it counts as a citation error. Claims are extracted by a model and kept only when their quote appears verbatim in the text; each cited source is then checked, with a model’s help, for whether it says what the claim relies on. Those verdicts can be wrong — read the claim’s quote and the cited source before relying on one.
Statistics and arithmetic are recomputed, not judged.
Confidence bands are shown only for fields calibrated on our annotated test set. None is calibrated yet, so no band is shown.
What counts as a claim ›How we measure confidence ›How we check this ›
Are you an author, or do you see a problem with this page? Request a review
