

The DOI matches its Crossref record; 26 of the 27 references it cites were found in a registry or an index, and 1 are not checked yet.
Cell fixation and preservation for droplet-based single-cell transcriptomics
Open accessPublished version of a preprint
Abstract
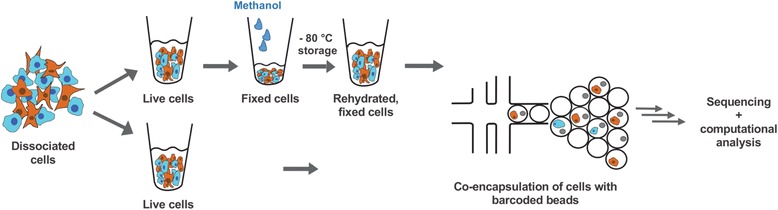
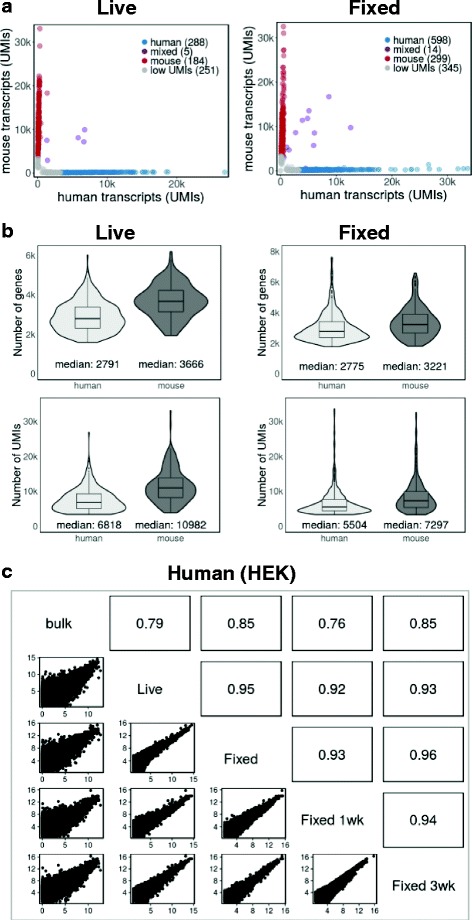
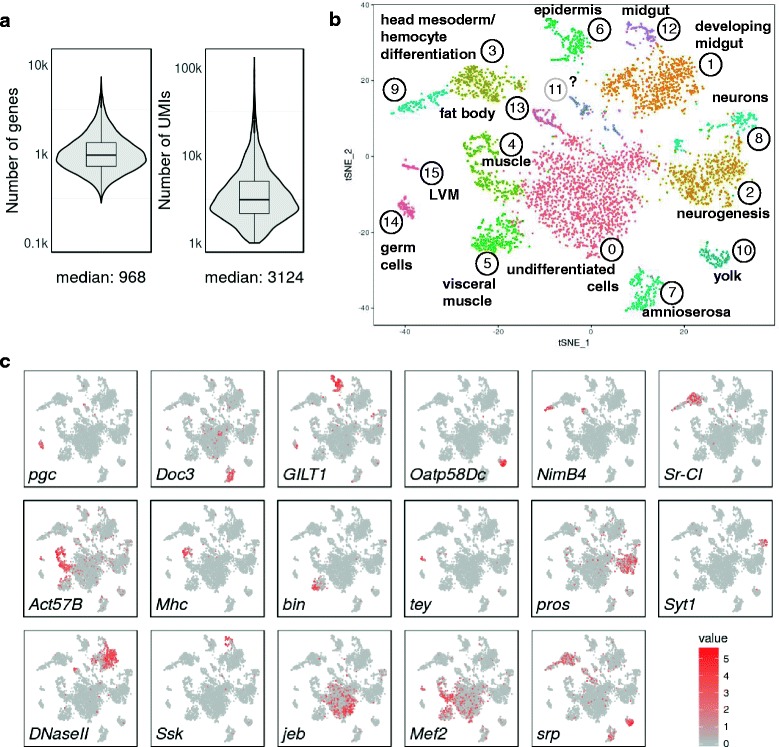
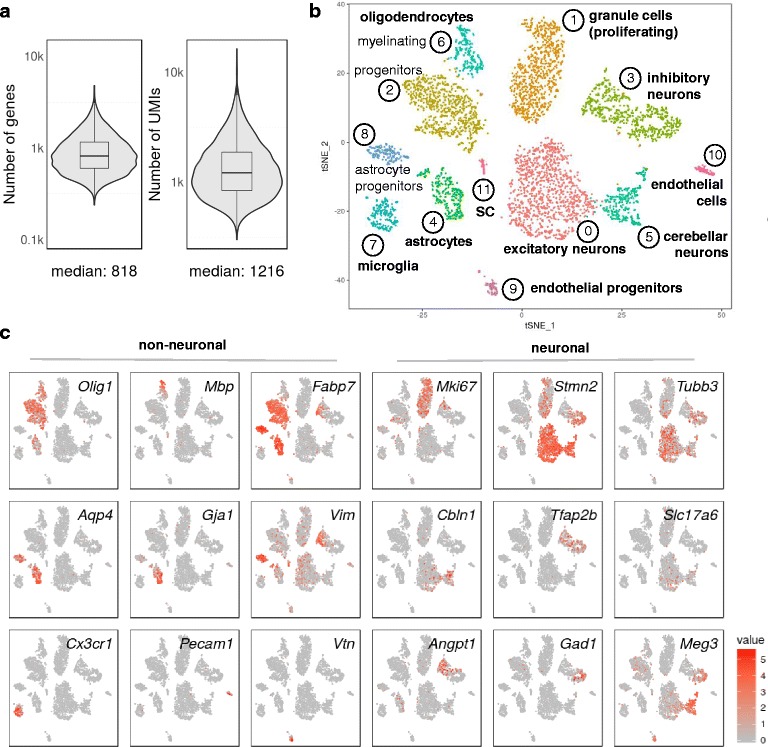
BACKGROUND: Recent developments in droplet-based microfluidics allow the transcriptional profiling of thousands of individual cells in a quantitative, highly parallel and cost-effective way. A critical, often limiting step is the preparation of cells in an unperturbed state, not altered by stress or ageing. Other challenges are rare cells that need to be collected over several days or samples prepared at different times or locations. METHODS: Here, we used chemical fixation to address these problems. Methanol fixation allowed us to stabilise and preserve dissociated cells for weeks without compromising single-cell RNA sequencing data. RESULTS: By using mixtures of fixed, cultured human and mouse cells, we first showed that individual transcriptomes could be confidently assigned to one of the two species. Single-cell gene expression from live and fixed samples correlated well with bulk mRNA-seq data. We then applied methanol fixation to transcriptionally profile primary cells from dissociated, complex tissues. Low RNA content cells from Drosophila embryos, as well as mouse hindbrain and cerebellum cells prepared by fluorescence-activated cell sorting, were successfully analysed after fixation, storage and single-cell droplet RNA-seq. We were able to identify diverse cell populations, including neuronal subtypes. As an additional resource, we provide 'dropbead', an R package for exploratory data analysis, visualization and filtering of Drop-seq data. CONCLUSIONS: We expect that the availability of a simple cell fixation method will open up many new opportunities in diverse biological contexts to analyse transcriptional dynamics at single-cell resolution.
Overview
The claims and statistics of this paper haven’t been checked yet.
Run the check — free, no account needed. It reads the open-access text and checks the sources it cites.
Integrity signals
Registry
Cites
Statistics
Figures
Verification
Claims the paper makes
The claims and statistics of this paper haven’t been checked yet.
Run the check — free, no account needed. It reads the open-access text and checks the sources it cites.
Claims other papers make about this one
Each is checked against this paper’s own text: does it say what the citing paper says it does?
The source backs part of the claim, not all of it — or backs it for a different population, condition or comparison.
In the citing paper
“First, these methods require the use of fresh tissues, which can be difficult to obtain and thus lead to logistic complexities (Alles et al., 2017; Attar et al., 2018; Wang et al., 2018; Lafzi et al., 2018).”
From Robust single-nucleus RNA sequencing reveals depot-specific cell population dynamics in adipose tissue remodeling during obesity (2025) · cites this paper as Alles et al., 2017
Experimental — accuracy not yet measured
Self-check
Percentages, sums and reported differences re-computed from the paper’s own numbers.
The self-check needs the paper’s full text.
Citations
Cites
STAR: ultrafast universal RNA-seq aligner
Dobin, A., Davis, C. A., Schlesinger, F., Drenkow, J., Zaleski, C., Jha, S., Batut, P., Chaisson, M., & Gingeras, T. R. (2013) · Bioinformatics · doi:10.1093/bioinformatics/bts635 · Cited by 51,709 · cited 2×
“The reads were then aligned to a combined FASTA file of the hg38 and mm10 reference genomes, using STAR (13) v. 2.4.0j with default parameters.”
MethodInfluentialMassively parallel digital transcriptional profiling of single cells
Zheng, G. X. Y., Terry, J. M., Belgrader, P., Ryvkin, P., Bent, Z. W., Wilson, R., Ziraldo, S. B., Wheeler, T. D., McDermott, G. P., Zhu, J., et al. (2017) · Nature Communications · doi:10.1038/ncomms14049 · Cited by 7,353 · cited 3×
“tain more RNA than oftentimes smaller, primary cells [18], Drop-seq can be successfully performed with fixed”
InfluentialHighly parallel genome-wide expression profiling of individual cells using nanoliter droplets.
Macosko, E. Z., Basu, A., Satija, R., Nemesh, J., Shekhar, K., Goldman, M., Tirosh, I., Bialas, A. R., Kamitaki, N., Martersteck, E. M., et al. (2015) · Cell · doi:10.1016/j.cell.2015.05.002 · Cited by 7,110 · cited 10×
“Preparation kit (Illumina, San Diego, CA, USA) using custom primers that amplified only the 3' ends [7].”
BackgroundMethodInfluentialSpatial reconstruction of single-cell gene expression data
Satija, R., Farrell, J. A., Gennert, D., Schier, A. F., & Regev, A. (2015) · Nature Biotechnology · doi:10.1038/nbt.3192 · Cited by 7,055 · cited 2×
“For the Drosophila embryos and mouse hindbrain samples, after filtering our samples with ‘dropbead’ we used Seurat [17] for cluster analysis.”
BackgroundMethodmRNA-Seq whole-transcriptome analysis of a single cell
Tang, F., Barbacioru, C., Wang, Y., Nordman, E., Lee, C., Xu, N., Wang, X., Bodeau, J., Tuch, B. B., Siddiqui, A., et al. (2009) · Nature Methods · doi:10.1038/nmeth.1315 · Cited by 3,969 · cited 1×
“Rather than studying global gene expression of a tissue as a whole, it has been recognized that transcriptional profiling at a single-cell resolution (1-4) provides a much more complete and accurate description of its biological function (5,6).”
BackgroundDroplet barcoding for single-cell transcriptomics applied to embryonic stem cells
Klein, A. M., Mazutis, L., Akartuna, I., Tallapragada, N., Veres, A., Li, V., Peshkin, L., Weitz, D. A., & Kirschner, M. W. (2015) · Cell · doi:10.1016/j.cell.2015.04.044 · Cited by 3,356 · cited 2×
“It also remains to be determined whether methanol fixation is compatible with the ‘InDrop’ protocol [8], another, recently developed droplet-based sequencing approach that involves a different detergent for cell lysis and cDNA library construction.”
BackgroundSmart-seq2 for sensitive full-length transcriptome profiling in single cells
Picelli, S., Björklund, Å. K., Faridani, O. R., Sagasser, S., Winberg, G., & Sandberg, R. (2013) · Nature Methods · doi:10.1038/nmeth.2639 · Cited by 2,358 · cited 1×
“Rather than studying global gene expression of a tissue as a whole, it has been recognized that transcriptional profiling at a single-cell resolution (1-4) provides a much more complete and accurate description of its biological function (5,6).”
BackgroundMassively parallel single-cell RNA-seq for marker-free decomposition of tissues into cell types
Jaitin, D. A., Kenigsberg, E., Keren-Shaul, H., Elefant, N., Paul, F., Zaretsky, I., Mildner, A., Cohen, N., Jung, S., Tanay, A., et al. (2014) · Science · doi:10.1126/science.1247651 · Cited by 1,795
Single-cell profiling of the developing mouse brain and spinal cord with split-pool barcoding
Rosenberg, A. B., Roco, C. M., Muscat, R. A., Kuchina, A., Sample, P., Yao, Z., Graybuck, L. T., Peeler, D. J., Mukherjee, S., Chen, W., et al. (2018) · Science · doi:10.1126/science.aam8999 · Cited by 1,422
Cao, J., Packer, J. S., Ramani, V., Cusanovich, D. A., Huynh, C., Daza, R., Qiu, X., Lee, C., Furlan, S. N., Steemers, F. J., et al. (2017) · doi:10.1101/104844 · Cited by 1,402
Single-cell genome sequencing: current state of the science
Gawad, C., Koh, W., & Quake, S. R. (2016) · Nature Reviews Genetics · doi:10.1038/nrg.2015.16 · Cited by 1,334 · cited 1×
“Rather than studying global gene expression of a tissue as a whole, it has been recognized that transcriptional profiling at a single-cell resolution [1–4] provides a much more complete and accurate description of its biological function [5, 6].”
BackgroundEffect of Fixatives and Tissue Processing on the Content and Integrity of Nucleic Acids
Srinivasan, M., Sedmak, D. D., & Jewell, S. D. (2002) · American Journal Of Pathology · doi:10.1016/s0002-9440(10)64472-0 · Cited by 1,320 · cited 2×
“Cross-linking induces chemical modifications that inhibit poly(dT) annealing, reverse transcriptase and cDNA synthesis, making cross-link reversal necessary [10].”
CEL-seq: single-cell RNA-seq by multiplexed linear amplification
Hashimshony, T., Wagner, F., Sher, N., & Yanai, I. (2012) · Cell Reports · doi:10.1016/j.celrep.2012.08.003 · Cited by 1,231 · cited 1×
“Rather than studying global gene expression of a tissue as a whole, it has been recognized that transcriptional profiling at a single-cell resolution (1-4) provides a much more complete and accurate description of its biological function (5,6).”
BackgroundOligodendrocyte heterogeneity in the mouse juvenile and adult central nervous system
Marques, S., Zeisel, A., Codeluppi, S., van Bruggen, D., Mendanha Falcão, A., Xiao, L., Li, H., Häring, M., Hochgerner, H., Romanov, R. A., et al. (2016) · Science · doi:10.1126/science.aaf6463 · Cited by 1,132
Single-cell RNA-seq: advances and future challenges
Saliba, A.-E., Westermann, A. J., Gorski, S. A., & Vogel, J. (2014) · Nucleic Acids Research · doi:10.1093/nar/gku555 · Cited by 847 · cited 1×
“handling of cellular input material [9].”
Classification of low quality cells from single-cell RNA-seq data
Ilicic, T., Kim, J. K., Kolodziejczyk, A. A., Bagger, F. O., McCarthy, D. J., Marioni, J. C., & Teichmann, S. A. (2016) · Genome Biology · doi:10.1186/s13059-016-0888-1 · Cited by 693 · cited 3×
“Stressed or broken cells lose non-mitochondrially encoded, cytoplasmically localized mRNAs [16].”
BackgroundMethodInfluentialGlobal analysis of patterns of gene expression during Drosophilaembryogenesis
Tomančák, P., Berman, B. P., Beaton, A., Weiszmann, R., Kwan, E., Hartenstein, V., Celniker, S., & Rubin, G. M. (2007) · Genome biology · doi:10.1186/gb-2007-8-7-r145 · Cited by 453 · cited 1×
“Tissues were assigned through imaging gene ontology (ImaGO) term analysis [20] of the 50 most variable genes in each cluster (Additional file 5: Table S1) as a first approximation, followed by inspection of publicly available RNA in situ staining patterns [21] of highly variable as well as other known tissue-specific…”
MethodSingle Cell Genomics: Advances and Future Perspectives
Macaulay, I. C., & Voet, T. (2014) · PLoS Genetics · doi:10.1371/journal.pgen.1004126 · Cited by 384 · cited 1×
“Rather than studying global gene expression of a tissue as a whole, it has been recognized that transcriptional profiling at a single-cell resolution [1–4] provides a much more complete and accurate description of its biological function [5, 6].”
BackgroundThe Drosophila embryo at single-cell transcriptome resolution
Karaiskos, N., Wahle, P., Alles, J., Boltengagen, A., Ayoub, S., Kipar, C., Kocks, C., Rajewsky, N., & Zinzen, R. P. (2017) · Science · doi:10.1126/science.aan3235 · Cited by 382 · cited 2×
“We also found that single-cell sequencing data from methanol-fixed cells were of sufficient quality to carry out spatial mapping and 3D reconstruction of a virtual Drosophila embryo at the onset of gastrulation [14].”
BackgroundSelf-citationFlyMine: an integrated database for Drosophila and Anopheles genomics
Lyne, R., Smith, R. N., Rutherford, K., Wakeling, M. N., Varley, A., Guillier, F., Janssens, H., Ji, W., Mclaren, P., North, P., et al. (2007) · Genome biology · doi:10.1186/gb-2007-8-7-r129 · Cited by 372 · cited 2×
“associations were made by ImaGO term analysis [20] on the 50 most variable genes of each cluster (Additional file 5: Table S1), followed by inspection”
MethodFixed single-cell transcriptomic characterization of human radial glial diversity
Thomsen, E. R., Mich, J. K., Yao, Z., Hodge, R. D., Doyle, A. M., Jang, S., Shehata, S. I., Nelson, A. M., Shapovalova, N. V., Levi, B. P., et al. (2015) · Nature Methods · doi:10.1038/nmeth.3629 · Cited by 237 · cited 1×
“Another study describes fixation of cells by cross-linking with formaldehyde [25], followed by reverse cross-linking (breakage of methylene bridges between protein and RNA molecules with heat).”
BackgroundSingle-cell transcriptome conservation in cryopreserved cells and tissues
Guillaumet-Adkins, A., Rodríguez-Esteban, G., Mereu, E., Méndez-Lago, M., Jaitin, D. A., Villanueva, A., Vidal, A., Martínez‐Martí, A., Felip, E., Vivancos, A. P., et al. (2017) · Genome biology · doi:10.1186/s13059-017-1171-9 · Cited by 159 · cited 1×
“One study uses cryopreservation followed by flow cytometry to sort single cells for subsequent processing [24].”
Large-scale sorting of C. elegans embryos reveals the dynamics of small RNA expression
Stoeckius, M., Maaskola, J., Colombo, T., Rahn, H.-P., Friedländer, M. R., Li, N., Chen, W., Piano, F., & Rajewsky, N. (2009) · Nature Methods · doi:10.1038/nmeth.1370 · Cited by 93 · cited 10×
“Mitochondrially encoded transcripts are not elevated in methanol-fixed cells An increase in the proportion of transcripts from mitochondrial genes (37 mtDNA-encoded mRNAs) is believed to indicate low quality cells that are broken or damaged to varying degrees (14).”
BackgroundMethodInfluentialSelf-citationScaling single cell transcriptomics through split pool barcodingPreprint
Rosenberg, A. B., Roco, C. M., Muscat, R. A., Kuchina, A., Mukherjee, S., Chen, W., Peeler, D. J., Yao, Z., Tasic, B., Sellers, D., et al. (2017) · bioRxiv · doi:10.1101/105163 · Cited by 43
Cherbas, L., & Gong, L. (2014) · Methods · doi:10.1016/j.ymeth.2014.01.006 · Cited by 40
Esser, C., Göttlinger, C., Kremer, J., Hundeiker, C., & Radbruch, A. (1995) · Cytometry · doi:10.1002/cyto.990210411 · Cited by 38
GXD: a community resource of mouse Gene Expression Data
Smith, C. M., Finger, J. H., Hayamizu, T. F., McCright, I. J., Xu, J., Eppig, J. T., Kadin, J. A., Richardson, J. E., & Ringwald, M. (2015) · Mammalian Genome · doi:10.1007/s00335-015-9563-1 · Cited by 22 · cited 1×
“Markers were confirmed to be expressed in newborn hindbrain and cerebellum by inspecting RNA in situ hybridization images in publicly available databases [22, 23].”
Background
Cited by
Sorted by citations
A practical guide to single-cell RNA-sequencing for biomedical research and clinical applications
Haque, A., Engel, J., Teichmann, S. A., & Lönnberg, T. (2017) · Genome Medicine · doi:10.1186/s13073-017-0467-4 · Cited by 1,071
“Furthermore, over the past few years, protocols compatible with certain cell-fixation methods have started to emerge [34, 35, 38, 54, 55].”
BackgroundMultiplexed quantification of proteins and transcripts in single cells
Peterson, V. M., Zhang, K. X., Kumar, N., Wong, J., Li, L., Wilson, D. C., Moore, R., McClanahan, T. K., Sadekova, S., & Klappenbach, J. A. (2017) · Nature Biotechnology · doi:10.1038/nbt.3973 · Cited by 832
Wu, H., Kirita, Y., Donnelly, E. L., & Humphreys, B. D. (2019) · Journal of the American Society of Nephrology · doi:10.1681/asn.2018090912 · Cited by 752
Denisenko, E., Guo, B. B., Jones, M., Hou, R., de Kock, L., Lassmann, T., Poppe, D., Clément, O., Simmons, R. K., Lister, R., et al. (2020) · Genome Biology · doi:10.1186/s13059-020-02048-6 · Cited by 686
“Some of the artifacts have been investigated in recent studies comparing single-cell profiles of methanol-fixed and live cells [21, 22], cryopreserved and live cells [22, 23], single-cell and single-nucleus protocols [24–26], or tissue dissociation using cold-active protease and traditional digestion at 37 °C [18].”
BackgroundDissecting cell identity via network inference and in silico gene perturbation
Kamimoto, K., Stringa, B., Hoffmann, C. M., Jindal, K., Solnica-Krezel, L., & Morris, S. A. (2023) · Nature · doi:10.1038/s41586-022-05688-9 · Cited by 677
Metadata
- Authors
- Alles, J., Karaiskos, N., Praktiknjo, S. D., Grosswendt, S., Wahle, P., Ruffault, P.-L., Ayoub, S., Schreyer, L., Boltengagen, A., Birchmeier, C., Zinzen, R., Kocks, C., & Rajewsky, N.
- Affiliations
- Max Delbrück Center (DE)
- Corresponding author
- Kocks, Christine
- Rajewsky, Nikolaus
- ORCID
- Venue
- BMC Biology
- Published
- 2017-05-19
- Volume
- 15
- Issue
- 1
- Pages
- 44-44
- ISSN
- 1741-7007 (ISSN-L)
- PMC
- PMC5438562
- OpenAlex
- W2950862527
- Cited by
- 218
- References
- 26
- Citations by year
- 2026: 8 · 2025: 19 · 2024: 23 · 2023: 20 · 2022: 21 · 2021: 32 · 2020: 37 · 2019: 28 · 2018: 19 · 2017: 10
- FWCI
- 10.50
- Type
- journal article
- Language
- en
- Open access
- gold
- doi.org
- Licence
- cc-by
- Locations
- BMC Biology (publishedVersion, cc-by)
- PubMed Central (publishedVersion, cc-by)
- PubMed (publishedVersion)
- DOAJ (DOAJ: Directory of Open Access Journals) (submittedVersion)
- Funders
- Deutsche Forschungsgemeinschaft (SFB 665, cluster of excellence Neurocure)
- Deutsches Zentrum für Herz-Kreislaufforschung (DZHK BER1.2VD)
- European Molecular Biology Organization (EMBO fellowship)
- Topics
- Life Sciences › Biochemistry, Genetics and Molecular Biology › Molecular Biology › Single-cell and spatial transcriptomics
- Physical Sciences › Chemical Engineering › Fluid Flow and Transfer Processes › Innovative Microfluidic and Catalytic Techniques Innovation
- Life Sciences › Biochemistry, Genetics and Molecular Biology › Molecular Biology › Genomics and Phylogenetic Studies
- Keywords
- cell fixation, methanol fixation, cell preservation, single-cell RNA sequencing, Drop-seq, droplet microfluidics, Drosophila embryo, neuronal cell types
- MeSH terms
- Methanol, Animals, Cells, Cultured, Cerebellum, Drosophila, Embryo, Nonmammalian, Flow Cytometry, Humans, Rhombencephalon, RNA, Messenger, Software, Sequence Analysis, RNA, Gene Expression Profiling, Mice, Single-Cell Analysis
About these checks
Registry, retraction, Cites and statistics results are computed, not judged, with one exception: a printed reference that no index lists is read once by a model before it counts as a citation error. Claims are extracted by a model and kept only when their quote appears verbatim in the text; each cited source is then checked, with a model’s help, for whether it says what the claim relies on. Those verdicts can be wrong — read the claim’s quote and the cited source before relying on one.
Statistics and arithmetic are recomputed, not judged.
Confidence bands are shown only for fields calibrated on our annotated test set. None is calibrated yet, so no band is shown.
What counts as a claim ›How we measure confidence ›How we check this ›
Are you an author, or do you see a problem with this page? Request a review
