

The DOI matches its Crossref record; 135 of the 135 references it cites were found in a registry or an index.
Global population genetic structure and demographic trajectories of the black soldier fly, Hermetia illucens
Open accessAbstract
Background: The black soldier fly ( Hermetia illucens ) is the most promising insect candidate for nutrient-recycling through bioconversion of organic waste into biomass, thereby improving sustainability of protein supplies for animal feed and facilitating transition to a circular economy. Contrary to conventional livestock, genetic resources of farmed insects remain poorly characterised. We present the first comprehensive population genetic characterisation of H. illucens . Based on 15 novel microsatellite markers, we genotyped and analysed 2862 individuals from 150 wild and captive populations originating from 57 countries on seven subcontinents. Results: We identified 16 well-distinguished genetic clusters indicating substantial global population structure. The data revealed genetic hotspots in central South America and successive northwards range expansions within the indigenous ranges of the Americas. Colonisations and naturalisations of largely unique genetic profiles occurred on all non-native continents, either preceded by demographically independent founder events from various single sources or involving admixture scenarios. A decisive primarily admixed Polynesian bridgehead population serially colonised the entire Australasian region and its secondarily admixed descendants successively mediated invasions into Africa and Europe. Conversely, captive populations from several continents traced back to a single North American origin and exhibit considerably reduced genetic diversity, although some farmed strains carry distinct genetic signatures. We highlight genetic footprints characteristic of progressing domestication due to increasing socio-economic importance of H. illucens , and ongoing introgression between domesticated strains globally traded for large-scale farming and wild populations in some regions. Conclusions: We document the dynamic population genetic history of a cosmopolitan dipteran of South American origin shaped by striking geographic patterns. These reflect both ancient dispersal routes, and stochastic and heterogeneous anthropogenic introductions during the last century leading to pronounced diversification of worldwide structure of H. illucens . Upon the recent advent of its agronomic commercialisation, however, current human-mediated translocations of the black soldier fly largely involve genetically highly uniform domesticated strains, which meanwhile threaten the genetic integrity of differentiated unique local resources through introgression. Our in-depth reconstruction of the contemporary and historical demographic trajectories of H. illucens emphasises benchmarking potential for applied future research on this emerging model of the prospering insect-livestock sector.
Overview
The claims and statistics of this paper haven’t been checked yet.
Run the check — free, no account needed. It reads the open-access text and checks the sources it cites.
Integrity signals
Registry
Cites
Statistics
Figures
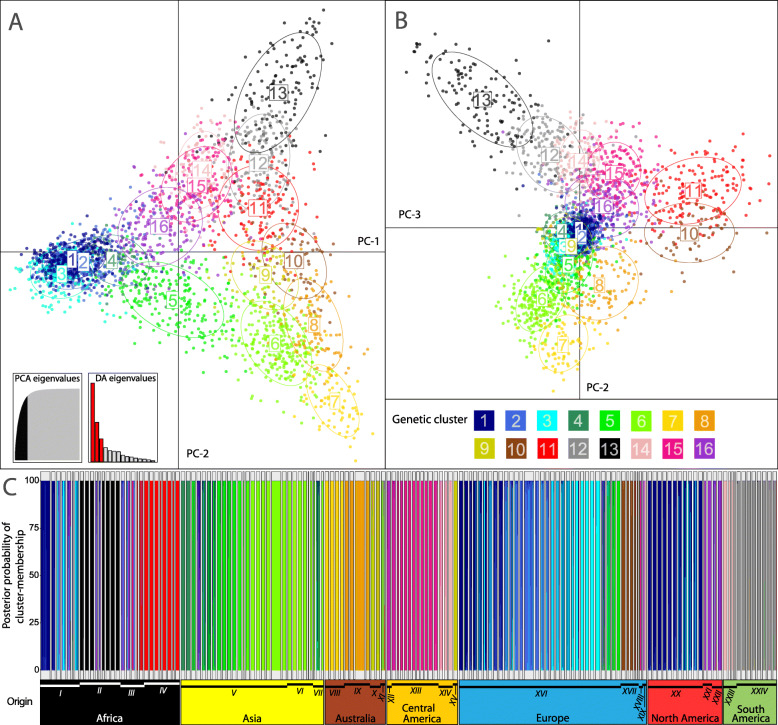
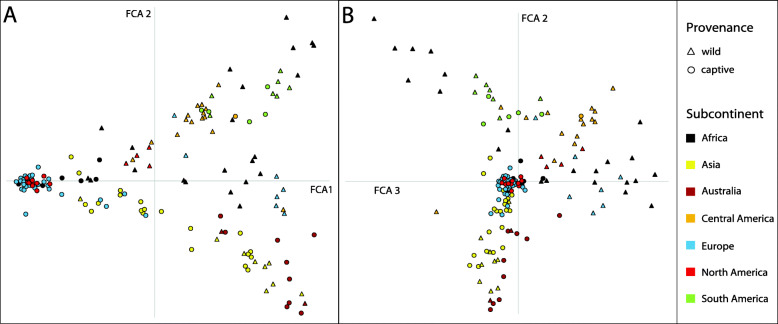
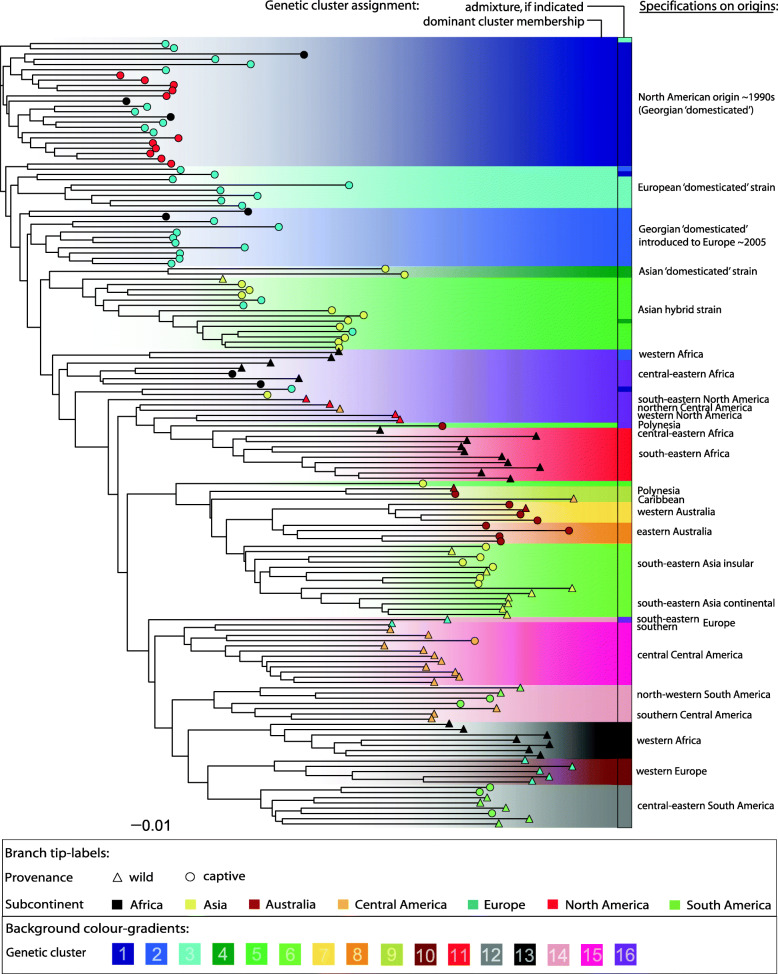
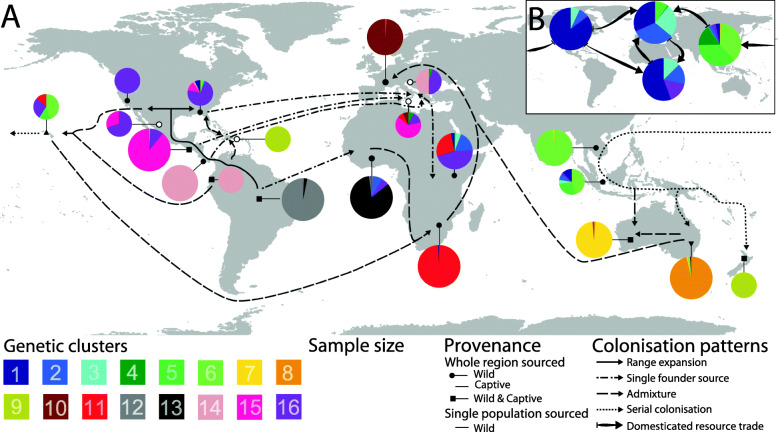
Verification
Claims the paper makes
The claims and statistics of this paper haven’t been checked yet.
Run the check — free, no account needed. It reads the open-access text and checks the sources it cites.
Claims other papers make about this one
Each is checked against this paper’s own text: does it say what the citing paper says it does?
The source backs part of the claim, not all of it — or backs it for a different population, condition or comparison.
In the citing paper
“industrial strains often harbour a narrowed gene pool due to breeding stocks having shared provenance, founding events from colony establishments and repeated genetic bottlenecks (Ståhls et al. 2020; Sandrock et al. 2021; Kaya et al. 2021).”
From Beyond the Black Box: Reproductive Strategies of the Black Soldier Fly as a Model for Bridging Evolutionary Biology and Applied Entomology (2026) · cites this paper as Kaya et al. 2021
Experimental — accuracy not yet measuredThe source backs part of the claim, not all of it — or backs it for a different population, condition or comparison.
In the citing paper
“Globally, 66% of allelic diversity resides within Neotropics strains”
From Beyond the Black Box: Reproductive Strategies of the Black Soldier Fly as a Model for Bridging Evolutionary Biology and Applied Entomology (2026) · cites this paper as Kaya et al. 2021
Experimental — accuracy not yet measuredThe cited source says what the claim attributes to it.
In the citing paper
“High genetic diversity is present among global BSF strains (Ståhls et al. 2020; Sandrock et al. 2021; Kaya et al. 2021; Generalovic et al. 2023)”
From Beyond the Black Box: Reproductive Strategies of the Black Soldier Fly as a Model for Bridging Evolutionary Biology and Applied Entomology (2026) · cites this paper as Kaya et al. 2021
Self-check
Percentages, sums and reported differences re-computed from the paper’s own numbers.
The self-check needs the paper’s full text.
Citations
Cites
R: A Language and Environment for Statistical Computing
R Core Team (2000) · doi:10.32614/r.manuals · Cited by 355,893
Fitting Linear Mixed-Effects Models Using lme4
Bates, D., Mächler, M., Bolker, B., & Walker, S. (2015) · Journal of Statistical Software · doi:10.18637/jss.v067.i01 · Cited by 86,835
Wickham, H. (2016) · Use R! · doi:10.1007/978-3-319-24277-4 · Cited by 34,873
vegan: Community Ecology Package
Oksanen, J., Simpson, G. L., Blanchet, F. G., Kindt, R., Legendre, P., Minchin, P. R., O’Hara, R. B., Sólymos, P., Stevens, M. H. H., Szöcs, E., et al. (2001) · doi:10.32614/cran.package.vegan · Cited by 27,099
ESTIMATING F -STATISTICS FOR THE ANALYSIS OF POPULATION STRUCTURE
Weir, B. S., & Cockerham, C. C. (1984) · Evolution · doi:10.1111/j.1558-5646.1984.tb05657.x · Cited by 18,909
ggplot2: Elegant Graphics for Data Analysis
Wickham, H. (2009) · doi:10.1007/978-0-387-98141-3 · Cited by 14,447
Simultaneous Inference in General Parametric Models
Hothorn, T., Bretz, F., & Westfall, P. H. (2008) · Biometrical Journal · doi:10.1002/bimj.200810425 · Cited by 14,265
Arlequin (version 3.0): An integrated software package for population genetics data analysis
Excoffier, L., Laval, G., & Schneider, S. (2005) · Evolutionary Bioinformatics · doi:10.1177/117693430500100003 · Cited by 14,265
ESTIMATION OF AVERAGE HETEROZYGOSITY AND GENETIC DISTANCE FROM A SMALL NUMBER OF INDIVIDUALS
Nei, M. (1978) · Genetics · doi:10.1093/genetics/89.3.583 · Cited by 11,368
ape 5.0: an environment for modern phylogenetics and evolutionary analyses in R
Paradis, E., & Schliep, K. P. (2018) · Bioinformatics · doi:10.1093/bioinformatics/bty633 · Cited by 9,224
adegenet : a R package for the multivariate analysis of genetic markers
Jombart, T. (2008) · Bioinformatics · doi:10.1093/bioinformatics/btn129 · Cited by 8,335
The ade4 Package: Implementing the Duality Diagram for Ecologists
Dray, S., & Dufour, A. (2007) · Journal of Statistical Software · doi:10.18637/jss.v022.i04 · Cited by 6,740
Jombart, T., Devillard, S., & Balloux, F. (2010) · BMC Genetics · doi:10.1186/1471-2156-11-94 · Cited by 5,117
Conceptual issues in local adaptation
Kawecki, T. J., & Ebert, D. (2004) · Ecology Letters · doi:10.1111/j.1461-0248.2004.00684.x · Cited by 3,873
Genetic Differentiation and Estimation of Gene Flow from F -Statistics Under Isolation by Distance
Rousset, F. (1997) · Genetics · doi:10.1093/genetics/145.4.1219 · Cited by 3,575
Kamvar, Z. N., Tabima, J. F., & Grünwald, N. J. (2014) · PeerJ · doi:10.7717/peerj.281 · Cited by 3,293
adegenet 1.3-1 : new tools for the analysis of genome-wide SNP data
Jombart, T., & Ahmed, I. (2011) · Bioinformatics · doi:10.1093/bioinformatics/btr521 · Cited by 3,233
pegas: an R package for population genetics with an integrated–modular approach
Paradis, E. (2010) · Bioinformatics · doi:10.1093/bioinformatics/btp696 · Cited by 2,601
Phylogenetic analysis: models and estimation procedures
Winther, R. G. (2018) · Cambridge University Press eBooks · doi:10.1017/9781316276259.010 · Cited by 2,258
Detecting immigration by using multilocus genotypes
Rannala, B. H., & Mountain, J. L. (1997) · Proceedings of the National Academy of Sciences · doi:10.1073/pnas.94.17.9197 · Cited by 2,212
Do, C., Waples, R. S., Peel, D. A., Macbeth, G. M., Tillett, B. J., & Ovenden, J. R. (2013) · Molecular Ecology Resources · doi:10.1111/1755-0998.12157 · Cited by 2,132
Applied Spatial Data Analysis with R - Second Edition
Bivand, R., Pebesma, E., & Gómez-Rubio, V. (2008) · Use R! · doi:10.1007/978-1-4614-7618-4 · Cited by 2,065
Potential of insects as food and feed in assuring food security.
van Huis, A. (2013) · Annual Review of Entomology · doi:10.1146/annurev-ento-120811-153704 · Cited by 1,891
State of the art on use of insects as animal feed.
Makkar, H. P. S., Tran, G., Heuzé, V., & Ankers, P. (2014) · Animal Feed Science and Technology · doi:10.1016/j.anifeedsci.2014.07.008 · Cited by 1,846
Linkage disequilibrium--understanding the evolutionary past and mapping the medical future.
Slatkin, M. (2008) · Nature Reviews Genetics · doi:10.1038/nrg2361 · Cited by 1,614 · cited 1×
“microsatellites suggest long-range physical linkage due to a severe bottleneck, which may only slowly decay via recombination in isolation [65].”
BackgroundGenetic Consequences of Range Expansions
Excoffier, L., Foll, M., & Petit, R. J. (2009) · Annual Review of Ecology Evolution and Systematics · doi:10.1146/annurev.ecolsys.39.110707.173414 · Cited by 1,350
The ade4 package - I : One-table methods
Chessel, D., Dufour, A., & Thioulouse, J. (2004) · HAL · Cited by 1,204
Cornuet, J., Pudlo, P., Veyssier, J., Garcia, A. D., Gautier, M., Leblois, R., Marin, J., & Estoup, A. (2014) · Bioinformatics · doi:10.1093/bioinformatics/btt763 · Cited by 1,041
Spranghers, T., Ottoboni, M., Klootwijk, C., Ovyn, A., Deboosere, S., De Meulenaer, B., Michiels, J., Eeckhout, M., De Clercq, P., & De Smet, S. (2017) · Journal of the Science of Food and Agriculture · doi:10.1002/jsfa.8081 · Cited by 970
Oonincx, D. G. A. B., van Broekhoven, S., van Huis, A., & van Loon, J. J. A. (2015) · PLoS ONE · doi:10.1371/journal.pone.0144601 · Cited by 951
Novel R tools for analysis of genome-wide population genetic data with emphasis on clonality
Kamvar, Z. N., Brooks, J. C., & Grünwald, N. J. (2015) · Frontiers in Genetics · doi:10.3389/fgene.2015.00208 · Cited by 930
Something in the way you move: dispersal pathways affect invasion success
Wilson, J. R., Dormontt, E. E., Prentis, P. J., Lowe, A. J., & Richardson, D. M. (2009) · Trends in Ecology & Evolution · doi:10.1016/j.tree.2008.10.007 · Cited by 925
Strategies for feeding the world more sustainably with organic agriculture
Müller, A. W., Schader, C., Scialabba, N. E., Brüggemann, J., Isensee, A., Erb, K., Smith, P., Klocke, P., Leiber, F., Stolze, M., et al. (2017) · Nature Communications · doi:10.1038/s41467-017-01410-w · Cited by 916
Self-citationOonincx, D. G. A. B., Itterbeeck, J. V., Heetkamp, M. J. W., van den Brand, H., van Loon, J. J. A., & van Huis, A. (2010) · PLoS ONE · doi:10.1371/journal.pone.0014445 · Cited by 861
Barragan-Fonseca, K. B., Dicke, M., & van Loon, J. J. A. (2017) · Journal of Insects as Food and Feed · doi:10.3920/jiff2016.0055 · Cited by 771
Genetic absolute dating based on microsatellites and the origin of modern humans.
Goldstein, D. B., Ruiz‐Linares, A., Cavalli-Sforza, L. L., & Feldman, M. W. (1995) · Proceedings of the National Academy of Sciences · doi:10.1073/pnas.92.15.6723 · Cited by 764
Classes and Methods for Spatial Data
Pebesma, E. J., & Bivand, R. (2015) · Cited by 719
Lalander, C., Diener, S., Zurbrügg, C., & Vinnerås, B. (2019) · Journal of Cleaner Production · doi:10.1016/j.jclepro.2018.10.017 · Cited by 664
Reconstructing routes of invasion using genetic data: why, how and so what?
Estoup, A., & Guillemaud, T. (2010) · Molecular Ecology · doi:10.1111/j.1365-294x.2010.04773.x · Cited by 651
P op G en R eport : simplifying basic population genetic analyses in R
Adamack, A. T., & Gruber, B. (2014) · Methods in Ecology and Evolution · doi:10.1111/2041-210x.12158 · Cited by 643
Ability of Black Soldier Fly (Diptera: Stratiomyidae) Larvae to Recycle Food Waste
Nguyen, T. T. X., Tomberlin, J. K., & VanLaerhoven, S. L. (2015) · Environmental Entomology · doi:10.1093/ee/nvv002 · Cited by 639
Self-citationThe use of fly larvae for organic waste treatment
Čičková, H., Newton, G. L., Lacy, R. C., & Kozánek, M. (2015) · Waste Management · doi:10.1016/j.wasman.2014.09.026 · Cited by 624
Losses, inefficiencies and waste in the global food system
Alexander, P., Brown, C., Arneth, A., Finnigan, J., Moran, D., & Rounsevell, M. D. A. (2017) · Agricultural Systems · doi:10.1016/j.agsy.2017.01.014 · Cited by 524
How important is intraspecific genetic admixture to the success of colonising populations?
Rius, M., & Darling, J. A. (2014) · Trends in Ecology & Evolution · doi:10.1016/j.tree.2014.02.003 · Cited by 494
The ade4 Package--II: Two-table and K-table Methods
Dray, S., Dufour, A., & Chessel, D. (2007) · HAL · Cited by 487
Rearing Methods for the Black Soldier Fly (Diptera: Stratiomyidae): Table 1
Sheppard, D. C., Tomberlin, J. K., Joyce, J. A., Kiser, B. C., & Sumner, S. M. (2002) · Journal of Medical Entomology · doi:10.1603/0022-2585-39.4.695 · Cited by 479
Self-citationSmetana, S. M., Schmitt, É., & Mathys, A. (2019) · Resources Conservation and Recycling · doi:10.1016/j.resconrec.2019.01.042 · Cited by 471
What we still don't know about invasion genetics
Bock, D. G., Caseys, C., Cousens, R. D., Hahn, M. A., Heredia, S. M., Hübner, S., Turner, K. G., Whitney, K. D., & Rieseberg, L. H. (2014) · Molecular Ecology · doi:10.1111/mec.13032 · Cited by 465
Bioconversion of organic wastes into biodiesel and animal feed via insect farming
Surendra, K. C., Olivier, R., Tomberlin, J. K., Jha, R., & Khanal, S. K. (2016) · Renewable Energy · doi:10.1016/j.renene.2016.03.022 · Cited by 453
Self-citationGenome-wide analysis of a long-term evolution experiment with Drosophila
Burke, M. K., Dunham, J. P., Shahrestani, P., Thornton, K. R., Rose, M. R., & Long, A. D. (2010) · Nature · doi:10.1038/nature09352 · Cited by 448 · cited 1×
“Yet, the absence of severe genetic bottlenecks across BSF farms utilising domesticated strains, even after isolation for more than a decade (as per several captive populations investigated), may also point at mechanisms stabilising genetic diversity in artificial BSF regimes, as shown for other domesticated animals an…”
BackgroundIs There a Genetic Paradox of Biological Invasion?
Estoup, A., Ravigné, V., Hufbauer, R. A., Vitalis, R., Gautier, M., & Facon, B. (2016) · Annual Review of Ecology Evolution and Systematics · doi:10.1146/annurev-ecolsys-121415-032116 · Cited by 425
Impacts of feeding less food-competing feedstuffs to livestock on global food system sustainability
Schader, C., Müller, A. W., Scialabba, N. E., Hecht, J., Isensee, A., Erb, K., Smith, P., Makkar, H. P. S., Klocke, P., Leiber, F., et al. (2015) · Journal of The Royal Society Interface · doi:10.1098/rsif.2015.0891 · Cited by 405
Self-citationForecasting potential global environmental costs of livestock production 2000–2050
Pelletier, N. L., & Tyedmers, P. H. (2010) · Proceedings of the National Academy of Sciences · doi:10.1073/pnas.1004659107 · Cited by 401
Insect meals in fish nutrition
Mérida, S. N., Gobbi, P., Józefiak, D., Mazurkiewicz, J., Dudek, K., Rawski, M., Kierończyk, B., & Józefiak, A. (2018) · Reviews in Aquaculture · doi:10.1111/raq.12281 · Cited by 365
Dlugosch, K. M., Anderson, S. R., Braasch, J., Cang, F. A., & Gillette, H. D. (2015) · Molecular Ecology · doi:10.1111/mec.13183 · Cited by 357
Supervised Multiblock Analysis in R with the ade4 Package
Bougeard, S., & Dray, S. (2018) · Journal of Statistical Software · doi:10.18637/jss.v086.i01 · Cited by 340
Ecological genetics of invasive alien species
Handley, L. L., Estoup, A., Evans, D. M., Thomas, C. E., Lombaert, É., Facon, B., Aebi, A., & Roy, H. E. (2011) · BioControl · doi:10.1007/s10526-011-9386-2 · Cited by 321
A population genetics view of animal domestication
Larson, G., & Bürger, J. (2013) · Trends in Genetics · doi:10.1016/j.tig.2013.01.003 · Cited by 309
Dabbou, S., Gai, F., Biasato, I., Capucchio, M. T., Biasibetti, E., Dezzutto, D., Meneguz, M., Plachá, I., Gasco, L., & Schiavone, A. (2018) · Journal of Animal Science and Biotechnology/Journal of animal science and biotechnology · doi:10.1186/s40104-018-0266-9 · Cited by 299
Self-citationHufbauer, R. A., Facon, B., Ravigné, V., Turgeon, J., Foucaud, J., Lee, C. E., Rey, O., & Estoup, A. (2011) · Evolutionary Applications · doi:10.1111/j.1752-4571.2011.00211.x · Cited by 291
Linkage disequilibrium due to random genetic drift in finite subdivided populations
Ohta, T. (1982) · Proceedings of the National Academy of Sciences · doi:10.1073/pnas.79.6.1940 · Cited by 289
Animals Fed Insect-Based Diets: State-of-the-Art on Digestibility, Performance and Product Quality
Gasco, L., Biasato, I., Dabbou, S., Schiavone, A., & Gai, F. (2019) · Animals · doi:10.3390/ani9040170 · Cited by 282
Self-citationNutrient utilisation by black soldier flies fed with chicken, pig, or cow manure
Oonincx, D. G. A. B., van Huis, A., & van Loon, J. J. A. (2015) · Journal of Insects as Food and Feed · doi:10.3920/jiff2014.0023 · Cited by 278
stratag : An r package for manipulating, summarizing and analysing population genetic data
Archer, F. I., Adams, P. E., & Schneiders, B. B. (2016) · Molecular Ecology Resources · doi:10.1111/1755-0998.12559 · Cited by 268
Bosch, G., van Zanten, H. H. E., Zamprogna, A., Veenenbos, M., Meijer, N., van der Fels‐Klerx, H. J., & van Loon, J. J. A. (2019) · Journal of Cleaner Production · doi:10.1016/j.jclepro.2019.02.270 · Cited by 268
Zhan, S., Fang, G., Cai, M., Kou, Z., Xu, J. Q., Cao, Y., Bai, L., Zhang, Y., Jiang, Y., Luo, X., et al. (2019) · Cell Research · doi:10.1038/s41422-019-0252-6 · Cited by 265
Self-citationInsects as food and feed: From production to consumption
Jensen, K., Kristensen, T. N., Heckmann, L., & Sørensen, J. G. (2017) · Wageningen Academic Publishers eBooks · doi:10.3920/978-90-8686-849-0 · Cited by 256
Zhou, F., Tomberlin, J. K., Zheng, L., Yu, Z., & Zhang, J. (2013) · Journal of Medical Entomology · doi:10.1603/me13021 · Cited by 252
Self-citationWynants, E., Frooninckx, L., Crauwels, S., Verreth, C., De Smet, J., Sandrock, C., Wohlfahrt, J., Van Schelt, J., Depraetere, S., Lievens, B., et al. (2019) · Microbial Ecology · doi:10.1007/s00248-018-1286-x · Cited by 241
Self-citationChakraborty, R., & Li, J. (1993) · Birkhäuser Basel eBooks · doi:10.1007/978-3-0348-8583-6_14 · Cited by 225
Chia, S. Y., Tanga, C. M., Khamis, F. M., Mohamed, S. A., Salifu, D., Sevgan, S., Fiaboe, K. K. M., Niassy, S., van Loon, J. J. A., Dicke, M., et al. (2018) · PLOS ONE · doi:10.1371/journal.pone.0206097 · Cited by 221
Self-citationBiasato, I., Renna, M., Gai, F., Dabbou, S., Meneguz, M., Perona, G. E., Martínez-Miró, S., Barroeta, A. C., Bergagna, S., Sardi, L., et al. (2019) · Journal of Animal Science and Biotechnology/Journal of animal science and biotechnology · doi:10.1186/s40104-019-0325-x · Cited by 211
Self-citationInbreeding Depression Is Purged in the Invasive Insect Harmonia axyridis
Facon, B., Hufbauer, R. A., Tayeh, A., Loiseau, A., Lombaert, É., Vitalis, R., Guillemaud, T., Lundgren, J. G., & Estoup, A. (2011) · Current Biology · doi:10.1016/j.cub.2011.01.068 · Cited by 210
Rehman, K. U., Cai, M., Xiao, X., Zheng, L., Wang, H. Z., Soomro, A. A., Zhou, Y., Li, W., Yu, Z., & Zhang, J. (2017) · Journal of Environmental Management · doi:10.1016/j.jenvman.2017.03.047 · Cited by 199
Leong, S. Y., Kutty, S. R. M., Malakahmad, A., & Khun, T. C. (2015) · Waste Management · doi:10.1016/j.wasman.2015.03.030 · Cited by 183
Complex patterns of global spread in invasive insects: eco-evolutionary and management consequences
Garnas, J. R., Auger‐Rozenberg, M., Alain Roques, B., Bertelsmeier, C., Wingfield, M. J., Saccaggi, D. L., Roy, H. E., & Slippers, B. (2016) · Biological Invasions · doi:10.1007/s10530-016-1082-9 · Cited by 180
Jucker, C., Erba, D., Leonardi, M. G., Lupi, D., & Savoldelli, S. (2017) · Environmental Entomology · doi:10.1093/ee/nvx154 · Cited by 179
Linkage Disequilibrium and Demographic History of Wild and Domestic Canids
GRAY, M. M., Granka, J. M., Bustamante, C. D., Sutter, N. B., Boyko, A. R., Zhu, L., Ostrander, E. A., & Wayne, R. K. (2009) · Genetics · doi:10.1534/genetics.108.098830 · Cited by 177
Bridgehead Effects and Role of Adaptive Evolution in Invasive Populations
Bertelsmeier, C., & Keller, L. (2018) · Trends in Ecology & Evolution · doi:10.1016/j.tree.2018.04.014 · Cited by 170
Management increases genetic diversity of honey bees via admixture
Harpur, B. A., Minaei, S., Kent, C. F., & Zayed, A. (2012) · Molecular Ecology · doi:10.1111/j.1365-294x.2012.05614.x · Cited by 166
Vorburger, C., Sandrock, C., Gouskov, A., Castañeda, L. E., & Ferrari, J. (2009) · Evolution · doi:10.1111/j.1558-5646.2009.00660.x · Cited by 163
Self-citationLombaert, É., Guillemaud, T., Thomas, C. E., Handley, L. L., Li, J., WANG, S., Pang, H., Goryacheva, I. I., Zakharov, I. A., Jousselin, E., et al. (2011) · Molecular Ecology · doi:10.1111/j.1365-294x.2011.05322.x · Cited by 155
Deciphering the routes of invasion of Drosophila suzukii by means of ABC random forest
Fraimout, A., Debat, V., Fellous, S., Hufbauer, R. A., Foucaud, J., Pudlo, P., Marin, J., Price, D. K., Cattel, J., Chen, X., et al. (2017) · Molecular Biology and Evolution · doi:10.1093/molbev/msx050 · Cited by 155
Self-citationTomberlin, J. K., & van Huis, A. (2020) · Journal of Insects as Food and Feed · doi:10.3920/jiff2020.0003 · Cited by 154 · cited 1×
“1758; Diptera: Stratiomyidae), is a particularly promising candidate and considered the ‘crown jewel’ of the fastgrowing insect-farming industry [14].”
BackgroundSelf-citationKapun, M., Barrón, M. G., Staubach, F., Obbard, D. J., Wiberg, R. A. W., Vieira, J., Goubert, C., Rota‐Stabelli, O., Kankare, M., Bogaerts-Márquez, M., et al. (2020) · Molecular Biology and Evolution · doi:10.1093/molbev/msaa120 · Cited by 150
Self-citationBooth, D. C., & Sheppard, C. (1984) · Environmental Entomology · doi:10.1093/ee/13.2.421 · Cited by 145
Hermetia illucens meal as fish meal replacement for rainbow trout on farm
Stadtlander, T., Stamer, A., Buser, A., Wohlfahrt, J., Leiber, F., & Sandrock, C. (2017) · Journal of Insects as Food and Feed · doi:10.3920/jiff2016.0056 · Cited by 142
Self-citationProgress and prospects in mapping recent selection in the genome
Thornton, K., Jensen, J. D., Becquet, C., & Andolfatto, P. (2007) · Heredity · doi:10.1038/sj.hdy.6800967 · Cited by 137
Heuel, M., Sandrock, C., Leiber, F., Mathys, A., Gold, M., Zurbrügg, C., Gangnat, I. D. M., Kreuzer, M., & Terranova, M. (2021) · Poultry Science · doi:10.1016/j.psj.2021.101034 · Cited by 137
Self-citationRossi, M., Bitocchi, E., Bellucci, E., Nanni, L., Rau, D., Attene, G., & Papa, R. (2009) · Evolutionary Applications · doi:10.1111/j.1752-4571.2009.00082.x · Cited by 132
Goubert, C., Minard, G., Vieira, C. P., & Boulesteix, M. (2016) · Heredity · doi:10.1038/hdy.2016.35 · Cited by 129
The impact of human-made ecological changes on the genetic architecture of Daphnia species
Brede, N., Sandrock, C., Straile, D., Spaak, P., Jankowski, T., Streit, B., & Schwenk, K. (2009) · Proceedings of the National Academy of Sciences · doi:10.1073/pnas.0807187106 · Cited by 128
Self-citationA fast likelihood solution to the genetic clustering problem
Beugin, M., Gayet, T., Pontier, D., Devillard, S., & Jombart, T. (2018) · Methods in Ecology and Evolution · doi:10.1111/2041-210x.12968 · Cited by 128
A world catalog of the stratiomyidae (insecta: diptera)
Woodley, N. E. (2001) · Cited by 127
A high-quality, chromosome-level genome assembly of the Black Soldier Fly ( Hermetia illucens L.)
Generalovic, T. N., McCarthy, S., Warren, I. A., Wood, J. M. D., Torrance, J., Sims, Y., Quail, M. A., Howe, K., Pipan, M., Durbin, R. M., et al. (2021) · G3 Genes Genomes Genetics · doi:10.1093/g3journal/jkab085 · Cited by 116
Self-citationDeciphering the genetic basis of animal domestication
Wiener, P., & Wilkinson, S. (2011) · Proceedings of the Royal Society B Biological Sciences · doi:10.1098/rspb.2011.1376 · Cited by 113
Elevated Proportions of Deleterious Genetic Variation in Domestic Animals and Plants
Makino, T., Rubin, C., Carneiro, M., Axelsson, E., Andersson, L., & Webster, M. T. (2018) · Genome Biology and Evolution · doi:10.1093/gbe/evy004 · Cited by 112
Gruber, B., & Adamack, A. T. (2015) · Molecular Ecology Resources · doi:10.1111/1755-0998.12381 · Cited by 103
Drosophila suzukii: The Genetic Footprint of a Recent, Worldwide Invasion
Adrion, J. R., Kousathanas, A., Pascual, M., Burrack, H. J., Haddad, N. M., Bergland, A. O., Machado, H. E., Sackton, T. B., Schlenke, T. A., Watada, M., et al. (2014) · Molecular Biology and Evolution · doi:10.1093/molbev/msu246 · Cited by 95
Marshall, S. A., Woodley, N. E., & Hauser, M. (2015) · The Journal of the Entomological Society of Ontario · doi:10.21083/jeso.v146i0.3696 · Cited by 92
Self-citationJaval, M., Lombaert, É., Tsykun, T., Courtin, C., Kerdelhué, C., Prospero, S., Alain Roques, B., & Roux, G. (2019) · Molecular Ecology · doi:10.1111/mec.15030 · Cited by 91
Khamis, F. M., Ombura, F. L. O., Akutse, K. S., Subramanian, S., Mohamed, S. A., Fiaboe, K. K. M., Saijuntha, W., van Loon, J. J. A., Dicke, M., Dubois, T., et al. (2020) · Frontiers in Microbiology · doi:10.3389/fmicb.2020.01538 · Cited by 89
Self-citationEvolutionary and functional genetics of insect diapause: a call for greater integration
Ragland, G. J., Armbruster, P., & Meuti, M. E. (2019) · Current Opinion in Insect Science · doi:10.1016/j.cois.2019.08.003 · Cited by 83
Genetic changes during laboratory domestication of an olive fly SIT strain
Zygouridis, N. E., Argov, Y., Nemny‐Lavy, E., Augustinos, A. A., Nestel, D., & Mathiopoulos, K. D. (2013) · Journal of Applied Entomology · doi:10.1111/jen.12042 · Cited by 78
Cooper, B. S., Ginsberg, P., Turelli, M., & Matute, D. R. (2016) · Genetics · doi:10.1534/genetics.116.196238 · Cited by 77
Ståhls, G., Meier, R., Sandrock, C., Hauser, M., Šašić Zorić, L., Laiho, E., Aracil, A., Doderović, J., Badenhorst, R., Unadirekkul, P., et al. (2020) · BMC Evolutionary Biology · doi:10.1186/s12862-020-01627-2 · Cited by 70
Self-citationLower temperature threshold of black soldier fly (Diptera: Stratiomyidae) development
Holmes, L. A., VanLaerhoven, S. L., & Tomberlin, J. K. (2016) · Journal of Insects as Food and Feed · doi:10.3920/jiff2016.0008 · Cited by 70
Self-citationWang, S., Michaud, J. P., RUNZHI, Z., Zhang, F., & Liu, S. (2009) · Ecological Entomology · doi:10.1111/j.1365-2311.2008.01075.x · Cited by 68
Lehmann, P., Lyytinen, A., Piiroinen, S., & Lindström, L. (2015) · Evolutionary Ecology · doi:10.1007/s10682-015-9755-x · Cited by 67
Cold Hardiness of the Black Soldier Fly (Diptera: Stratiomyidae)
Spranghers, T., Noyez, A., Schildermans, K., & CLERCQ, P. D. (2017) · Journal of Economic Entomology · doi:10.1093/jee/tox142 · Cited by 65
Global reduction fisheries and their products in the context of sustainable limits
Cashion, T., Tyedmers, P. H., & Parker, R. W. R. (2017) · Fish and Fisheries · doi:10.1111/faf.12222 · Cited by 64
Neumann, C., Velten, S., & Liebert, F. (2018) · Animals · doi:10.3390/ani8100172 · Cited by 63
The Laboratory Domestication of Zebrafish: From Diverse Populations to Inbred Substrains
Suurväli, J., Whiteley, A. R., Zheng, Y., Gharbi, K., Leptin, M., & Wiehe, T. (2019) · Molecular Biology and Evolution · doi:10.1093/molbev/msz289 · Cited by 62
Sandrock, C., Schirrmeister, B. E., & Vorburger, C. (2011) · BMC Evolutionary Biology · doi:10.1186/1471-2148-11-348 · Cited by 59
Self-citationRhode, C., Badenhorst, R., Hull, K. L., Greenwood, M. P., Bester‐van der Merwe, A. E., Andere, A. A., Picard, C. J., & Richards, C. (2020) · Animal Genetics · doi:10.1111/age.12961 · Cited by 58
Self-citationLayton, E. M., On, J., Perlmutter, J. I., Bordenstein, S. R., & Shropshire, J. D. (2019) · mBio · doi:10.1128/mbio.01879-19 · Cited by 50
Soro, A., Quezada‐Euán, J. J. G., Theodorou, P., Moritz, R. F. A., & Paxton, R. J. (2016) · Conservation Genetics · doi:10.1007/s10592-016-0912-8 · Cited by 47
Ewusie, E. A., Kwapong, P., Ofosu-Budu, G. K., Sandrock, C., Akumah, A. M., Nartey, E. K., Tetegaga, C., & Agyakwah, S. K. (2019) · Scientific African · doi:10.1016/j.sciaf.2019.e00134 · Cited by 47
Self-citationIndustrial rearing of edible insects could be a major source of new biological invasions
Bang, A., & Courchamp, F. (2020) · Ecology Letters · doi:10.1111/ele.13646 · Cited by 43
Benelli, G., Canale, A., Raspi, A., & Fornaciari, G. (2014) · Journal of Archaeological Science · doi:10.1016/j.jas.2014.05.015 · Cited by 33
Akoğul, S., & Erişoğlu, M. (2016) · Mathematical and Computational Applications · doi:10.3390/mca21030034 · Cited by 33
Wang, Y., Kapun, M., Waidele, L., Küenzel, S., Bergland, A. O., & Staubach, F. (2020) · Environmental Microbiology Reports · doi:10.1111/1758-2229.12826 · Cited by 32
Self-citationEvolution in biocontrol strains: insight from the harlequin ladybird H armonia axyridis
Tayeh, A., Estoup, A., Laugier, G. J. M., Loiseau, A., Turgeon, J., Toepfer, S., & Facon, B. (2012) · Evolutionary Applications · doi:10.1111/j.1752-4571.2012.00274.x · Cited by 32
Samayoa, A. C., & Hwang, S. (2018) · Journal of Economic Entomology · doi:10.1093/jee/toy078 · Cited by 29
Self-citationBlanckenhorn, W. U. (2009) · Zurich Open Repository and Archive (University of Zurich) · doi:10.5167/uzh-17951 · Cited by 28
Self-citationZeender, V., Roy, J., Wegmann, A., Schäfer, M. A., Gourgoulianni, N., Blanckenhorn, W. U., & Rohner, P. T. (2019) · Oecologia · doi:10.1007/s00442-019-04378-0 · Cited by 27
Self-citationRevision of the Hermetiinae of Australia (Diptera: Stratiomyidae)
Lessard, B. D., Yeates, D. K., & Woodley, N. E. (2018) · Austral Entomology · doi:10.1111/aen.12333 · Cited by 26
Causes and Consequences of Phenotypic Plasticity in Body Size
Blanckenhorn, W. U. (2009) · Science Publishers eBooks · doi:10.1201/b10201-11 · Cited by 24
Self-citationEwusie, E. A., Kwapong, P., Ofosu-Budu, G. K., Sandrock, C., Akumah, A. M., Nartey, E., Teye-Gaga, C., Agyarkwah, S., & Adamtey, N. (2018) · Asian Journal of Biotechnology and Bioresource Technology · doi:10.9734/ajb2t/2018/42371 · Cited by 21
Self-citationInsects of Hawaii. Volume 10, Diptera: Nematocera-Brachycera (except Dolichopodidae).
Hardy, D. E. (1960) · ScholarSpace (University of Hawaii at Manoa) · Cited by 19
Estimation and Tests of Hierarchical F-Statistics [R package hierfstat version 0.5-7]
Goudet, J., & Jombart, T. (2020) · Cited by 16
Dalapicolla, J., do Prado, J. R., Percequillo, A. R., & Knowles, L. L. (2021) · Journal of Biogeography · doi:10.1111/jbi.14281 · Cited by 13
Kupferschmidt, K. (2015) · Science · doi:10.1126/science.350.6258.267 · Cited by 13
Kuys, R. D., Roodt‐Wilding, R., & Rhode, C. (2020) · Aquaculture · doi:10.1016/j.aquaculture.2020.735002 · Cited by 7
Self-citation[About Hermetia illucens (Linnaeus, 1758) (soldier fly) (Diptera, Stratiomyidae: Hermetiinae)]
Leclercq, M. (1997) · Cited by 5
Research works printed but not linked: 5
- Kupferschmidt K. Buzz Food. Science. 2015;350:267–9.
- Sandrock C, Leupi S, Wohlfahrt J, Leiber F, Kreuzer M. Genotype × environment interactions in black soldier fly larvae grown on different feed substrates. 70th Annual Meeting of the European Federation of Animal Science. Ghent: Wageningen Academic publishers; 2019. p. 239.
- Rozkosný R. A biosystematic study of the European Stratiomyidae (Diptera). In: Spencer, KA, editor. Clitellariinae, Hermetiinae, Pachygasterinae and Bibliography. Series Entomol. 1983;2:172-176.
- Mantel N. The detection of disease clustering and a generalized regression approach. Cancer Res. 1967;27(2):209–20.
- Grosjean P. SciViews-R. Belgium: University of Mons; 2019. http://www.sciviews.org/SciViews-R
Cited by
Sorted by citations
Liu, T., Klammsteiner, T., Dregulo, A. M., Kumar, V., Zhou, Y., Zhang, Z., & Awasthi, M. K. (2022) · The Science of The Total Environment · doi:10.1016/j.scitotenv.2022.155122 · Cited by 180
Seyedalmoosavi, M. M., Mielenz, M., Veldkamp, T., Daş, G., & Metges, C. C. (2022) · Journal of Animal Science and Biotechnology/Journal of animal science and biotechnology · doi:10.1186/s40104-022-00682-7 · Cited by 155
Salam, M., Shahzadi, A., Zheng, H., Alam, F., Nabi, G., Dezhi, S., Ullah, W., Ammara, S., Ali, N., & Bilal, M. (2022) · Environmental Technology & Innovation · doi:10.1016/j.eti.2022.102649 · Cited by 137
Advancing edible insects as food and feed in a circular economy
van Huis, A., Rumpold, B. A., van der Fels‐Klerx, H. J., & Tomberlin, J. K. (2021) · Journal of Insects as Food and Feed · doi:10.3920/jiff2021.x005 · Cited by 99
Self-citationKoutsos, E. A., Modica, B., & Freel, T. A. (2022) · Translational Animal Science · doi:10.1093/tas/txac084 · Cited by 71
Metadata
- Authors
- Kaya, C., Generalovic, T. N., Ståhls, G., Hauser, M., Samayoa, A. C., Nunes-Silva, C. G., Roxburgh, H., Wohlfahrt, J., Ewusie, E. A., Kenis, M., Hanboonsong, Y., Orozco, J., Carrejo, N., Nakamura, S., Gasco, L., Rojo, S., Tanga, C. M., Meier, R., Rhode, C., Picard, C. J., Jiggins, C. D., Leiber, F., Tomberlin, J. K., Hasselmann, M., Blanckenhorn, W. U., Kapun, M., & Sandrock, C.
- Affiliations
- University of Zurich (CH)
- University of Cambridge (GB)
- Finnish Museum of Natural History (FI)
- California Department of Food and Agriculture (US)
- National Chung Hsing University (TW)
- Universidade Federal do Amazonas (BR)
- University of Stirling (GB)
- Forschungsinstitut für Biologischen Landbau (CH)
- Ghana Atomic Energy Commission (GH)
- CABI Switzerland (CH)
- Khon Kaen University (TH)
- Universidad del Valle (CO)
- Japan International Research Center for Agricultural Sciences (JP)
- University of Turin (IT)
- University of Alicante (ES)
- International Centre of Insect Physiology and Ecology (KE)
- National University of Singapore (SG)
- Stellenbosch University (ZA)
- Indiana University Indianapolis (US)
- Texas A&M University (US)
- University of Hohenheim (DE)
- Corresponding author
- Sandrock, Christoph
- ORCID
- Generalovic, Tomas N.
- Ståhls, Gunilla
- Hauser, Martin
- Nunes-Silva, Carlos G.
- Roxburgh, Heather
- Ewusie, Ebenezer A.
- Kenis, Marc
- Hanboonsong, Yupa
- Carrejo, Nancy
- Nakamura, Satoshi
- Gasco, Laura
- Rojo, Santos
- Tanga, Chrysantus M.
- Meier, Rudolf
- Rhode, Clint
- Picard, Christine J.
- Jiggins, Chris D.
- Leiber, Florian
- Tomberlin, Jeffery K.
- Hasselmann, Martin
- Blanckenhorn, Wolf U.
- Kapun, Martin
- Sandrock, Christoph
- Venue
- BMC Biology
- Published
- 2021-05-05
- Volume
- 19
- Issue
- 1
- Pages
- 94-94
- ISSN
- 1741-7007 (ISSN-L)
- PMC
- PMC8101212
- OpenAlex
- W3157995364
- Cited by
- 149
- References
- 135
- Citations by year
- 2026: 29 · 2025: 34 · 2024: 29 · 2023: 21 · 2022: 26 · 2021: 10
- FWCI
- 12.16
- Type
- journal article
- Language
- en
- Open access
- gold
- doi.org
- Locations
- BMC Biology (publishedVersion, cc-by)
- PubMed Central (publishedVersion, cc-by)
- PubMed (publishedVersion)
- Zurich Open Repository and Archive (University of Zurich) (acceptedVersion, cc-by)
- IUScholarWorks (Indiana University) (submittedVersion, cc-by)
- Työväentutkimus Vuosikirja (submittedVersion)
- Institutional Research Information System University of Turin (University of Turin) (submittedVersion, other-oa)
- SUNScholar (Stellenbosch University) (submittedVersion)
- National University of Singapore (submittedVersion, cc-by)
- DOAJ (DOAJ: Directory of Open Access Journals) (submittedVersion, cc-by-sa)
- Stirling Online Research Repository (University of Stirling) (submittedVersion, cc-by)
- RUA, Repositorio Institucional de la Universidad de Alicante (Universidad de Alicante) (submittedVersion, cc-by)
- Apollo (University of Cambridge) (submittedVersion, cc-by)
- Zurich Open Repository and Archive (University of Zurich) (submittedVersion, cc-by)
- Apollo
- Apollo (cc-by)
- Zurich Open Repository and Archive (University of Zurich)
- Funders
- Bundesamt für Landwirtschaft (627000824)
- Swiss National Science Foundation (IZ01Z0_147278, 400540_152154)
- Austrian Science Foundation (FWF P32275)
- Australian Centre for International Agricultural Research (108866-001)
- National Research Foundation, South Africa (CSRP170506229933)
- Topics
- Life Sciences › Biochemistry, Genetics and Molecular Biology › Genetics › Genetic diversity and population structure
- Life Sciences › Agricultural and Biological Sciences › Insect Science › Insect Utilization and Effects
- Life Sciences › Agricultural and Biological Sciences › Ecology, Evolution, Behavior and Systematics › Diptera species taxonomy and behavior
- Keywords
- Hermetia illucens, population structure, demographic history, microsatellite markers, domestication, introgression, invasive species, range expansion, founder events, genetic diversity, insect farming, organic waste bioconversion, captive populations
- MeSH terms
- Animals, Animal Feed, Demography, Diptera, Genetics, Population, Humans, Larva
About these checks
Registry, retraction, Cites and statistics results are computed, not judged, with one exception: a printed reference that no index lists is read once by a model before it counts as a citation error. Claims are extracted by a model and kept only when their quote appears verbatim in the text; each cited source is then checked, with a model’s help, for whether it says what the claim relies on. Those verdicts can be wrong — read the claim’s quote and the cited source before relying on one.
Statistics and arithmetic are recomputed, not judged.
Confidence bands are shown only for fields calibrated on our annotated test set. None is calibrated yet, so no band is shown.
What counts as a claim ›How we measure confidence ›How we check this ›
Are you an author, or do you see a problem with this page? Request a review
