Student or educator? Sign up with your school email and get 6 months of Pro free.
Cited by 71

The DOI matches its Crossref record; 50 of the 50 references it cites were found in a registry or an index.

Monocyte infiltration rather than microglia proliferation dominates the early immune response to rapid photoreceptor degeneration

Karlen, Sarah J., Miller, Eric B., Wang, Xinlei, Levine, Emily S., Zawadzki, Robert J., Burns, Marie E.·2018·Journal of Neuroinflammation

Abstract

BACKGROUND: Activation of resident microglia accompanies every known form of neurodegeneration, but the involvement of peripheral monocytes that extravasate and rapidly transform into microglia-like macrophages within the central nervous system during degeneration is far less clear. METHODS: Using a combination of in vivo ocular imaging, flow cytometry, and immunohistochemistry, we investigated the response of infiltrating cells in a light-inducible mouse model of photoreceptor degeneration. RESULTS: cell extravasation from the retinal vasculature. Proliferation of microglia and monocytes occurred concurrently; however, there was no indication of proliferation in either population until 72-96 h after neurodegeneration began. Eliminating CCL2-CCR2 signaling blocked monocyte recruitment, but did not alter the extent of retinal degeneration. CONCLUSIONS: These results demonstrate that the immune response to photoreceptor degeneration includes both resident microglia and monocytes, even at very early times. Surprisingly, preventing monocyte infiltration did not block neurodegeneration, suggesting that in this model, degeneration is limited by cell clearance from other phagocytes or by the timing of intrinsic cell death programs. These results show monocyte involvement is not limited to disease states that overwhelm or deplete the resident microglial population and that interventions focused on modulating the peripheral immune system are not universally beneficial for staving off degeneration.

Overview

The claims and statistics of this paper haven’t been checked yet.

Run the check — free, no account needed. It reads the open-access text and checks the sources it cites.

A few free checks a day · papers already verified open instantly · results are public

Integrity signals

Registry

Crossref · 10.1186/s12974-018-1365-4

Cites

50 of 50 references verified0 citation errors · 0 not checkable

Statistics

Figures

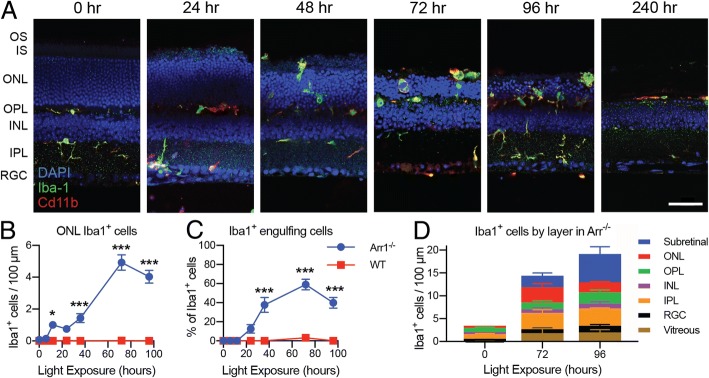
Fig. 1 Timecourse of microglia activation and photoreceptor clearance. a IHC of retinal sections of dark-reared (0 h) and light-exposed Arr1−/− mice (24–240 h). Light induced widespread migration of Iba1+ cells (green) into the outer retina. By 72 h, the outer retina (OS, IS, ONL) was markedly thinned and by 240 h had nearly vanished. b–d Quantification of Iba1+ cells in IHC sections. b The number of Iba1+ cells in the ONL per 100 μm increased significantly in two phases after light onset in Arr1−/− but did not change in dark-reared wild type (WT) controls. c The percent of Iba1+ cells actively engulfing photoreceptors increased significantly at 36 h in Arr1−/− and remained elevated through 96 h; there was no change in WT. Data in B and C re-analyzed from Levine et al., 2014. d In Arr1−/− mice, the majority of Iba1+ cells in dark-reared animals (0 h) were located in the plexiform layers, but after 72–96 h of light exposure, Iba1+ cells were also observed in the vitreous, RGC, ONL, and subretinal layers. Note that the discrepancy in quantification between 1B and 1D is due to the inclusion of subretinal and vitreal Iba1+ cells in 1D, which were not counted in the first study. Vitreal Cd11b+ cells may include a population of hyalocytes. Scale bar is 50 μm in A. OS photoreceptor outer segment layer, IS photoreceptor inner segment layer, ONL outer nuclear layer, OPL outer plexiform layer, INL inner nuclear layer, IPL inner plexiform layer, RGC retinal ganglion cell layer. *p < 0.05, **p < 0.01, ***p < 0.001; error bars are SEM, n = 7–18 locations per time point (locations selected from 3 to 9 sections across 2–3 mice per strain per time)
Fig. 1 Timecourse of microglia activation and photoreceptor clearance. a IHC of retinal sections of dark-reared (0 h) and light-exposed Arr1−/− mice (24–240 h). Light induced widespread migration of Iba1+ cells (green) into the outer retina. By 72 h, the outer retina (OS, IS, ONL) was markedly thinned and by 240 h had nearly vanished. b–d Quantification of Iba1+ cells in IHC sections. b The number of Iba1+ cells in the ONL per 100 μm increased significantly in two phases after light onset in Arr1−/− but did not change in dark-reared wild type (WT) controls. c The percent of Iba1+ cells actively engulfing photoreceptors increased significantly at 36 h in Arr1−/− and remained elevated through 96 h; there was no change in WT. Data in B and C re-analyzed from Levine et al., 2014. d In Arr1−/− mice, the majority of Iba1+ cells in dark-reared animals (0 h) were located in the plexiform layers, but after 72–96 h of light exposure, Iba1+ cells were also observed in the vitreous, RGC, ONL, and subretinal layers. Note that the discrepancy in quantification between 1B and 1D is due to the inclusion of subretinal and vitreal Iba1+ cells in 1D, which were not counted in the first study. Vitreal Cd11b+ cells may include a population of hyalocytes. Scale bar is 50 μm in A. OS photoreceptor outer segment layer, IS photoreceptor inner segment layer, ONL outer nuclear layer, OPL outer plexiform layer, INL inner nuclear layer, IPL inner plexiform layer, RGC retinal ganglion cell layer. *p < 0.05, **p < 0.01, ***p < 0.001; error bars are SEM, n = 7–18 locations per time point (locations selected from 3 to 9 sections across 2–3 mice per strain per time)CC BY · PubMed Central
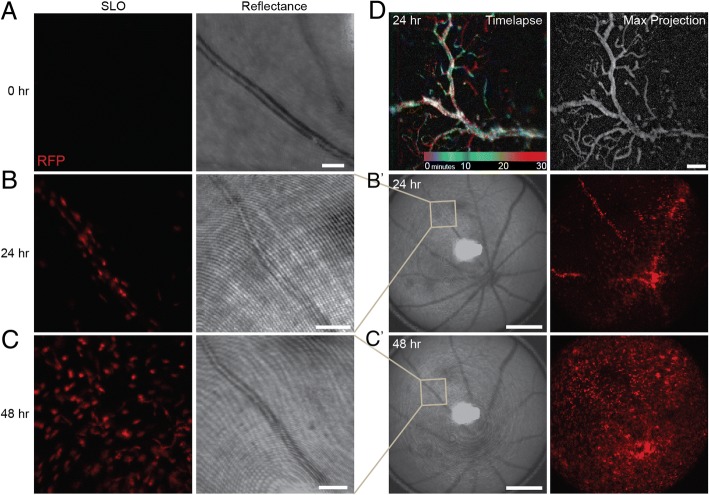
Fig. 2 In vivo imaging of monocyte infiltration through retinal vasculature during early neurodegeneration. In vivo retinal images of Arr1−/− CCR2+/rfp mice before and during photoreceptor degeneration. The fluorescence images (SLO) showed only fleeting RFP+ signal prior to degeneration (a), but in the same vessel 24 h later, RFP+ cells studded the interior (b) and could also be seen in other large caliber vessels and within the parenchyma of the central retinal (b′). By 48 h, RFP+ cells had escaped the vasculature and appeared throughout the retina (c, c′). The bright field (reflectance) images taken concurrently with the fluorescence (SLO) show the position of the blood vessel in the same animal over time. SLO images are frames from Additional file 2: Video 0 h; Additional file 3: Video 24 h; Additional file 5: Video 48 h. (d) Color-coded representation of Additional file 4: Video ext 24 h (different Arr1−/− CCR2+/rfp animal, 24 h), where each pixel was colorized based on the time epoch of the video in which RFP+ cells appeared. The largest diameter vessel is largely white because the corresponding pixels were RFP+ throughout the entire session due to persistent RFP+ cell adherence to the vessel walls. Notice transient epochs of cell adherence to finer capillaries as revealed by streaks of blue, green, red, etc. The grayscale projection of maximal pixel intensities over time (right) outlines the vascular network in greater detail. Scale bars are 100 μm in a, b, c, d, and 500 μm in b′, c′
Fig. 2 In vivo imaging of monocyte infiltration through retinal vasculature during early neurodegeneration. In vivo retinal images of Arr1−/− CCR2+/rfp mice before and during photoreceptor degeneration. The fluorescence images (SLO) showed only fleeting RFP+ signal prior to degeneration (a), but in the same vessel 24 h later, RFP+ cells studded the interior (b) and could also be seen in other large caliber vessels and within the parenchyma of the central retinal (b′). By 48 h, RFP+ cells had escaped the vasculature and appeared throughout the retina (c, c′). The bright field (reflectance) images taken concurrently with the fluorescence (SLO) show the position of the blood vessel in the same animal over time. SLO images are frames from Additional file 2: Video 0 h; Additional file 3: Video 24 h; Additional file 5: Video 48 h. (d) Color-coded representation of Additional file 4: Video ext 24 h (different Arr1−/− CCR2+/rfp animal, 24 h), where each pixel was colorized based on the time epoch of the video in which RFP+ cells appeared. The largest diameter vessel is largely white because the corresponding pixels were RFP+ throughout the entire session due to persistent RFP+ cell adherence to the vessel walls. Notice transient epochs of cell adherence to finer capillaries as revealed by streaks of blue, green, red, etc. The grayscale projection of maximal pixel intensities over time (right) outlines the vascular network in greater detail. Scale bars are 100 μm in a, b, c, d, and 500 μm in b′, c′CC BY · PubMed Central
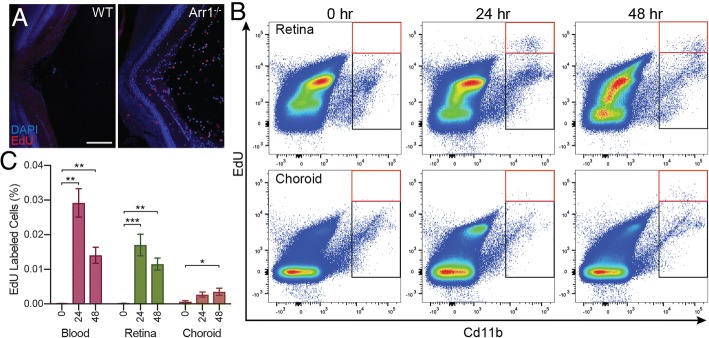
Fig. 3 Infiltrating cells are recruited from the retinal vasculature. To determine whether leukocytes were primarily infiltrating through the retinal vasculature or the choroidal vasculature, IP injections of EdU were performed at light onset to label dividing cells. a IHC of a section through the optic nerve head of WT and Arr1−/− retinas at 24 h showed EdU staining (red) predominantly of infiltrating cells at the vitreoretinal surface of Arr1−/− mice. Scale bar 100 μm. Similar results were observed in 2–3 sections from 2 to 4 mice of both genotypes. b Flow cytometry was used to quantify CD11b+ EdU+ cells (red box) from retina, choroid, and blood of Arr1−/− mice. Black box indicates the number of CD11b+ not labeled with EdU. c CD11b+ EdU+ labeled cells were abundant in the retina at 24 and 48 h. In contrast, CD11b+ EdU+ cells in the choroid did not significantly increase until 48 h and even then were far more rare than in blood and retina. Blood samples were used to verify EdU incorporation and, as expected, showed a significant increase at 24 and 48 h. *p < 0.05, **p < 0.01, ***p < 0.001; error bars are SEM from 3 mice (blood) or 6 retina/choroid per time point
Fig. 3 Infiltrating cells are recruited from the retinal vasculature. To determine whether leukocytes were primarily infiltrating through the retinal vasculature or the choroidal vasculature, IP injections of EdU were performed at light onset to label dividing cells. a IHC of a section through the optic nerve head of WT and Arr1−/− retinas at 24 h showed EdU staining (red) predominantly of infiltrating cells at the vitreoretinal surface of Arr1−/− mice. Scale bar 100 μm. Similar results were observed in 2–3 sections from 2 to 4 mice of both genotypes. b Flow cytometry was used to quantify CD11b+ EdU+ cells (red box) from retina, choroid, and blood of Arr1−/− mice. Black box indicates the number of CD11b+ not labeled with EdU. c CD11b+ EdU+ labeled cells were abundant in the retina at 24 and 48 h. In contrast, CD11b+ EdU+ cells in the choroid did not significantly increase until 48 h and even then were far more rare than in blood and retina. Blood samples were used to verify EdU incorporation and, as expected, showed a significant increase at 24 and 48 h. *p < 0.05, **p < 0.01, ***p < 0.001; error bars are SEM from 3 mice (blood) or 6 retina/choroid per time pointCC BY · PubMed Central
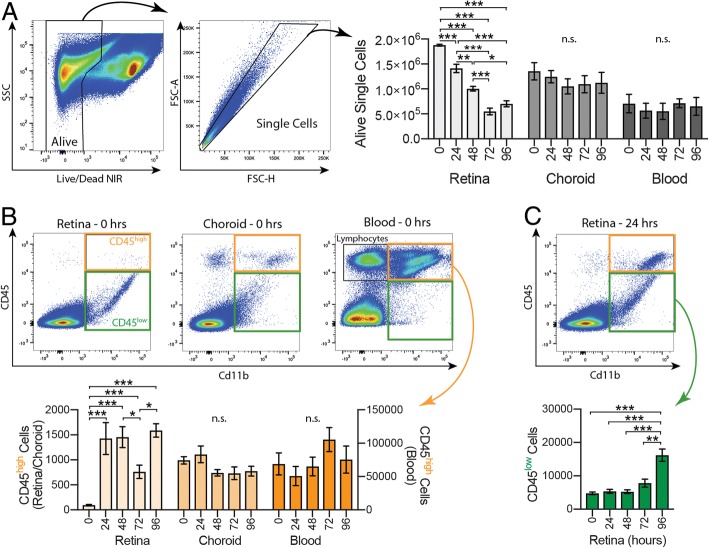
Fig. 4 Increased Cd11b+ CD45high cells during early neurodegeneration. Flow cytometry was used to identify cell types recruited during retinal degeneration. a Dissociated cell suspensions were gated to select alive, single cells. There was a significant decrease in the number of alive, single cells in the retinal samples at all time points except between 72 and 96 h (light gray), but no significant difference in the choroid (medium gray) or blood (dark gray) samples. b Cd11b+ cells were gated into CD45high (orange) and CD45low (green) populations. There were very few Cd11b+ CD45high cells in the retina at 0 h (light orange); however, by 24 h the number increased dramatically and remained well above baseline at 96 h. There were no significant changes in the choroid (medium orange) or blood (dark orange). c The number of retinal Cd11b+ CD45low cells (green) remained constant through the first 72 h, then showed a significant population increase at 96 h. *p < 0.05, **p < 0.01, ***p < 0.001; n.s. = not significant; error bars are SEM from 3 to 5 mice (blood) or 6–9 retinas/choroids per time point
Fig. 4 Increased Cd11b+ CD45high cells during early neurodegeneration. Flow cytometry was used to identify cell types recruited during retinal degeneration. a Dissociated cell suspensions were gated to select alive, single cells. There was a significant decrease in the number of alive, single cells in the retinal samples at all time points except between 72 and 96 h (light gray), but no significant difference in the choroid (medium gray) or blood (dark gray) samples. b Cd11b+ cells were gated into CD45high (orange) and CD45low (green) populations. There were very few Cd11b+ CD45high cells in the retina at 0 h (light orange); however, by 24 h the number increased dramatically and remained well above baseline at 96 h. There were no significant changes in the choroid (medium orange) or blood (dark orange). c The number of retinal Cd11b+ CD45low cells (green) remained constant through the first 72 h, then showed a significant population increase at 96 h. *p < 0.05, **p < 0.01, ***p < 0.001; n.s. = not significant; error bars are SEM from 3 to 5 mice (blood) or 6–9 retinas/choroids per time pointCC BY · PubMed Central
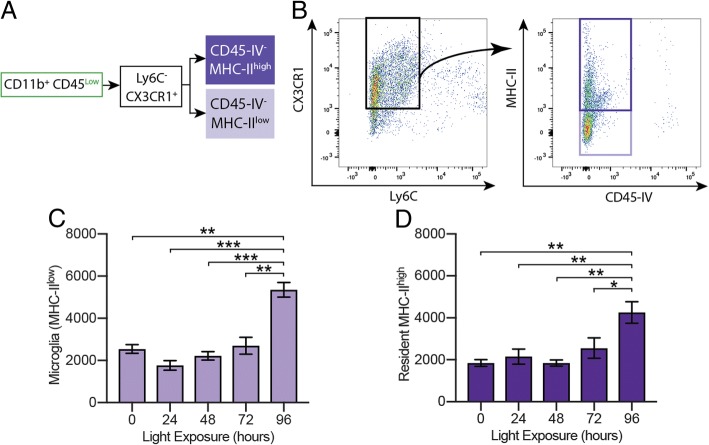
Fig. 5 Microglia numbers are stable during a dramatic period of cell clearance. a, b CD45low populations were gated on Ly6C and Cx3CR1 expression; MHC-II was used to distinguish microglia from resident macrophages, and CD45-IV was used to remove cells within or associated with the vasculature. c Microglia, the resident MHC-IIlow cells, remained at constant for the first 72 h, then increased at 96 h (lavender). d The number of resident MHC-IIhigh cells was also stable until 96 h (dark purple). Together, these data show that the number of resident immune cells is stable during early retinal degeneration. *p < 0.05, **p < 0.01, ***p < 0.001; error bars are SEM, n = 6–9 retinas per time point
Fig. 5 Microglia numbers are stable during a dramatic period of cell clearance. a, b CD45low populations were gated on Ly6C and Cx3CR1 expression; MHC-II was used to distinguish microglia from resident macrophages, and CD45-IV was used to remove cells within or associated with the vasculature. c Microglia, the resident MHC-IIlow cells, remained at constant for the first 72 h, then increased at 96 h (lavender). d The number of resident MHC-IIhigh cells was also stable until 96 h (dark purple). Together, these data show that the number of resident immune cells is stable during early retinal degeneration. *p < 0.05, **p < 0.01, ***p < 0.001; error bars are SEM, n = 6–9 retinas per time pointCC BY · PubMed Central
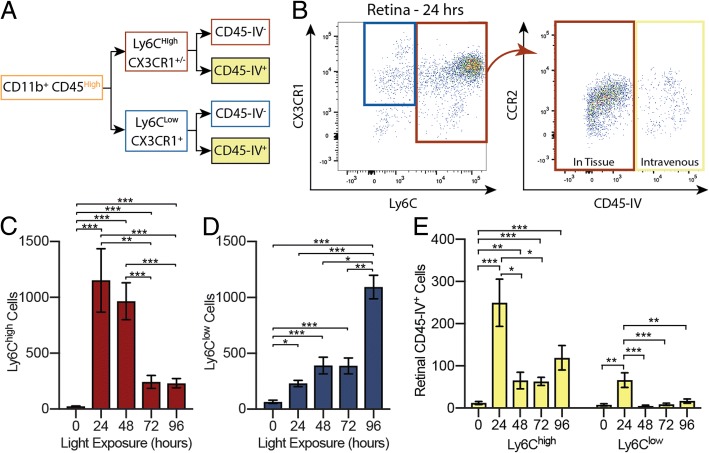
Fig. 6 Infiltrating cells are primarily CCR2+ Ly6Chigh. a, b CD45high populations were gated on Ly6C, Cx3CR1, CCR2, and CD45-IV expression. c The number of Ly6Chigh cells increased dramatically at 24 h and remained high before falling at 72 and 96 h (red). d Ly6Clow cells were less abundant at early times, slowly increasing over the first 48 h before abruptly doubling between 72 and 96 h (blue). e CD45-IV+ populations from retinal samples were examined to determine the Ly6C status of cells trapped within the retinal vasculature (yellow). The number of Ly6Chigh cells increased sharply by 24 h and did not return to baseline by 96 h; the number of Ly6Clow cells increased briefly at 24 h before returning to baseline. *p < 0.05, **p < 0.01, ***p < 0.001; error bars are SEM, n = 6–9 retinas per time point
Fig. 6 Infiltrating cells are primarily CCR2+ Ly6Chigh. a, b CD45high populations were gated on Ly6C, Cx3CR1, CCR2, and CD45-IV expression. c The number of Ly6Chigh cells increased dramatically at 24 h and remained high before falling at 72 and 96 h (red). d Ly6Clow cells were less abundant at early times, slowly increasing over the first 48 h before abruptly doubling between 72 and 96 h (blue). e CD45-IV+ populations from retinal samples were examined to determine the Ly6C status of cells trapped within the retinal vasculature (yellow). The number of Ly6Chigh cells increased sharply by 24 h and did not return to baseline by 96 h; the number of Ly6Clow cells increased briefly at 24 h before returning to baseline. *p < 0.05, **p < 0.01, ***p < 0.001; error bars are SEM, n = 6–9 retinas per time pointCC BY · PubMed Central
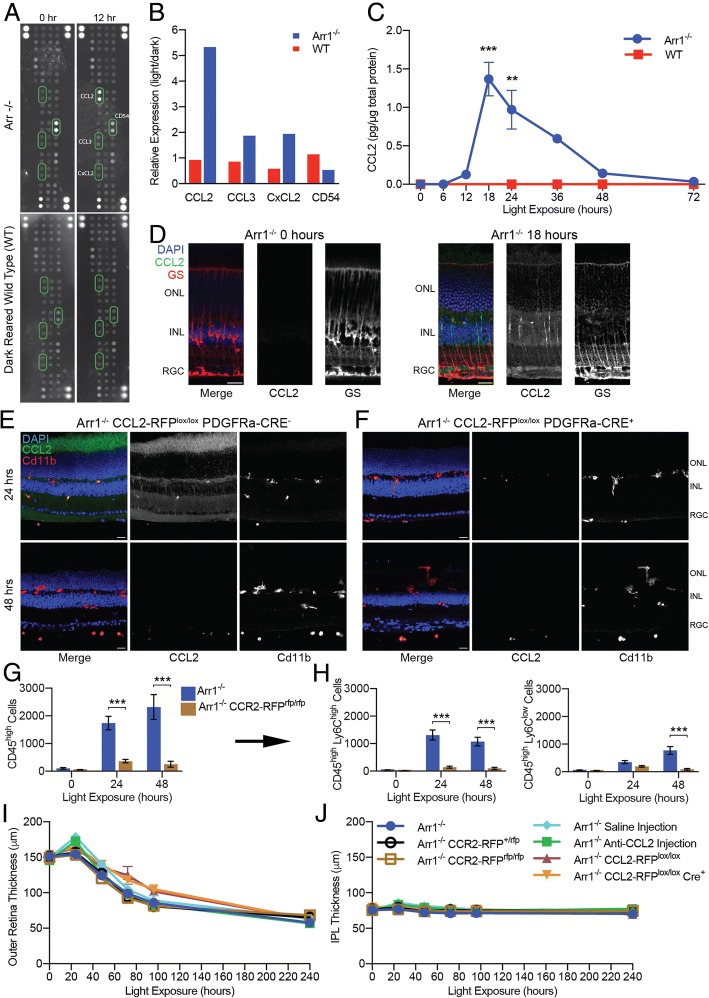
Fig. 7 CCL2-CCR2 mediated signaling recruits monocytes but does not limit the rate of retinal thinning. a, b Cytokine array screening of retinal homogenates of dark-reared Arr1−/− and WT mice before (0 h) and after 12 h of light exposure. There were few light-dependent changes overall, other than a striking increase in CCL2 expression in Arr1−/− retinas. Representative results from 8 blots, 4 from each genotype. c ELISA analysis of dark-reared Arr1−/− and WT mice revealed that CCL2 levels rose rapidly after 12 h of light exposure, peaking at 18 h (n = 3–5 mice per time point). d IHC of retinal sections of dark-reared (0 h) and light-exposed (18 h) Arr1−/− mice showed early CCL2 expression (green) in Müller glial cells (red). e Expression of fluorescently tagged CCL2 (green) was observed abundantly throughout the retina at 24 h but not at 48 h, consistent with the previous IHC and ELISA data. f In PDGFRa-Cre+ mice, the LoxP sites flanking CCL2 were excised only in Müller glia cells, preventing these cells from producing CCL2, and resulting in an almost complete absence of CCL2 in the retina of Cre+ mice at 24 h. Only punctate staining was observed in circulating and infiltrating monocytes, which did not lose their ability to produce CCL2. Representative images from 2 to 3 sections from 2 mice per strain per time point. These data demonstrate that Müller glia cells are the primary producers of CCL2 in the retina. g Knocking out CCR2, the primary receptor for CCL2, resulted in an almost complete loss of recruited CD45high cells. h There was a significant loss of both CD45high Ly6Chigh and CD45high Ly6Clow subpopulations (n = 4–6 retinas per strain per time point). i, j In vivo OCT B-scans were used to measure the thickness of the outer and inner retinal layers during degeneration. i Blocking CCL2-CCR2 signaling did not affect the extent of outer retinal thinning in CCR2-RFPrfp/rfp knockout mice (compare Arr1−/− (blue), Arr1−/− CCR2-RFP+/rfp (black), and Arr1−/− CCR2-RFPrfp/rfp (brown)), by using an intravitreal injection of CCL2 neutralizing antibody (compare saline (light blue) to anti-CCL2 (green)), or with a conditional CCL2 knockout in Müller glia (compare Arr1−/− CCL2-RFPlox/lox PDGFRa-Cre− (purple) to Arr1−/− CCL2-RFPlox/lox PDGFRa-Cre+ (orange)). j No appreciable change was detected in the thickness of the inner plexiform layer (IPL) in any of the mice, confirming that retinal degeneration was limited to the photoreceptor layer (n = 3–4 retinas from 2 mice per strain per time point). Error bars represent SEM; **p < 0.01, ***p < 0.001; ONL outer nuclear layer, INL inner nuclear layer, RGC retinal ganglion cell layer. Scale bar is 20 μm in d–f
Fig. 7 CCL2-CCR2 mediated signaling recruits monocytes but does not limit the rate of retinal thinning. a, b Cytokine array screening of retinal homogenates of dark-reared Arr1−/− and WT mice before (0 h) and after 12 h of light exposure. There were few light-dependent changes overall, other than a striking increase in CCL2 expression in Arr1−/− retinas. Representative results from 8 blots, 4 from each genotype. c ELISA analysis of dark-reared Arr1−/− and WT mice revealed that CCL2 levels rose rapidly after 12 h of light exposure, peaking at 18 h (n = 3–5 mice per time point). d IHC of retinal sections of dark-reared (0 h) and light-exposed (18 h) Arr1−/− mice showed early CCL2 expression (green) in Müller glial cells (red). e Expression of fluorescently tagged CCL2 (green) was observed abundantly throughout the retina at 24 h but not at 48 h, consistent with the previous IHC and ELISA data. f In PDGFRa-Cre+ mice, the LoxP sites flanking CCL2 were excised only in Müller glia cells, preventing these cells from producing CCL2, and resulting in an almost complete absence of CCL2 in the retina of Cre+ mice at 24 h. Only punctate staining was observed in circulating and infiltrating monocytes, which did not lose their ability to produce CCL2. Representative images from 2 to 3 sections from 2 mice per strain per time point. These data demonstrate that Müller glia cells are the primary producers of CCL2 in the retina. g Knocking out CCR2, the primary receptor for CCL2, resulted in an almost complete loss of recruited CD45high cells. h There was a significant loss of both CD45high Ly6Chigh and CD45high Ly6Clow subpopulations (n = 4–6 retinas per strain per time point). i, j In vivo OCT B-scans were used to measure the thickness of the outer and inner retinal layers during degeneration. i Blocking CCL2-CCR2 signaling did not affect the extent of outer retinal thinning in CCR2-RFPrfp/rfp knockout mice (compare Arr1−/− (blue), Arr1−/− CCR2-RFP+/rfp (black), and Arr1−/− CCR2-RFPrfp/rfp (brown)), by using an intravitreal injection of CCL2 neutralizing antibody (compare saline (light blue) to anti-CCL2 (green)), or with a conditional CCL2 knockout in Müller glia (compare Arr1−/− CCL2-RFPlox/lox PDGFRa-Cre− (purple) to Arr1−/− CCL2-RFPlox/lox PDGFRa-Cre+ (orange)). j No appreciable change was detected in the thickness of the inner plexiform layer (IPL) in any of the mice, confirming that retinal degeneration was limited to the photoreceptor layer (n = 3–4 retinas from 2 mice per strain per time point). Error bars represent SEM; **p < 0.01, ***p < 0.001; ONL outer nuclear layer, INL inner nuclear layer, RGC retinal ganglion cell layer. Scale bar is 20 μm in d–fCC BY · PubMed Central

Verification

Claims the paper makes

The claims and statistics of this paper haven’t been checked yet.

Run the check — free, no account needed. It reads the open-access text and checks the sources it cites.

A few free checks a day · papers already verified open instantly · results are public

Claims other papers make about this one

Each is checked against this paper’s own text: does it say what the citing paper says it does?

Self-check

Percentages, sums and reported differences re-computed from the paper’s own numbers.

The self-check needs the paper’s full text.

Citations

Cites

Show all 50 references

Cited by

See all 71

Metadata

Authors
Karlen, S. J., Miller, E. B., Wang, X., Levine, E. S., Zawadzki, R. J., & Burns, M. E.
Venue
Journal of Neuroinflammation
Published
2018-12
Volume
15
Issue
1
ISSN
1742-2094
Cited by
71
References
50
Language
en
Licence
Funders
  • National Eye Institute (R01-EY24320, P30-EY012576)
  • National Institutes of Health (T32-GM007377, T32-EY105387, NIH S10OD018223)

About these checks

Registry, retraction, Cites and statistics results are computed, not judged, with one exception: a printed reference that no index lists is read once by a model before it counts as a citation error. Claims are extracted by a model and kept only when their quote appears verbatim in the text; each cited source is then checked, with a model’s help, for whether it says what the claim relies on. Those verdicts can be wrong — read the claim’s quote and the cited source before relying on one.

Statistics and arithmetic are recomputed, not judged.

Confidence bands are shown only for fields calibrated on our annotated test set. None is calibrated yet, so no band is shown.

What counts as a claim ›How we measure confidence ›How we check this ›

Are you an author, or do you see a problem with this page? Request a review

How to cite

Cite CoChat for the checks on this page, and the paper for its own findings.

This page
CoChat. (2026). Citation check: Monocyte infiltration rather than microglia proliferation dominates the early immune response to rapid photoreceptor degeneration. https://app.cochat.ai/papers/10.1186/s12974-018-1365-4
The paper
Karlen, S. J., Miller, E. B., Wang, X., Levine, E. S., Zawadzki, R. J., & Burns, M. E. (2018). Monocyte infiltration rather than microglia proliferation dominates the early immune response to rapid photoreceptor degeneration. Journal of Neuroinflammation. https://doi.org/10.1186/s12974-018-1365-4

Data sources

Bibliographic data: Semantic Scholar, OpenAlex, Crossref.

Contains information from the Semantic Scholar Academic Graph Datasets, made available under the ODC Attribution License (ODC-BY 1.0).

Semantic Scholar’s data is described in: Kinney, R., et al. (2023). The Semantic Scholar Open Data Platform. arXiv:2301.10140.