

The DOI matches its Crossref record; 13 of the 13 references it cites were found in a registry or an index.
Visceral adipose tissue imparts peripheral macrophage influx into the hypothalamus
Abstract
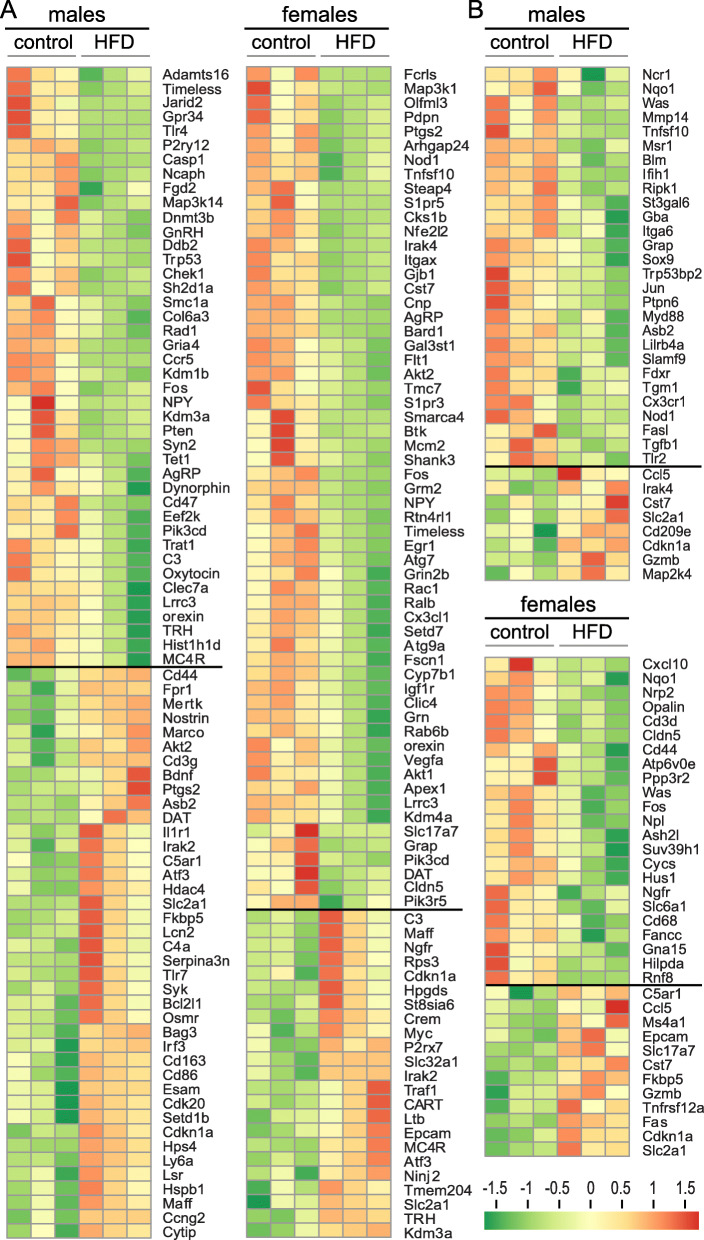
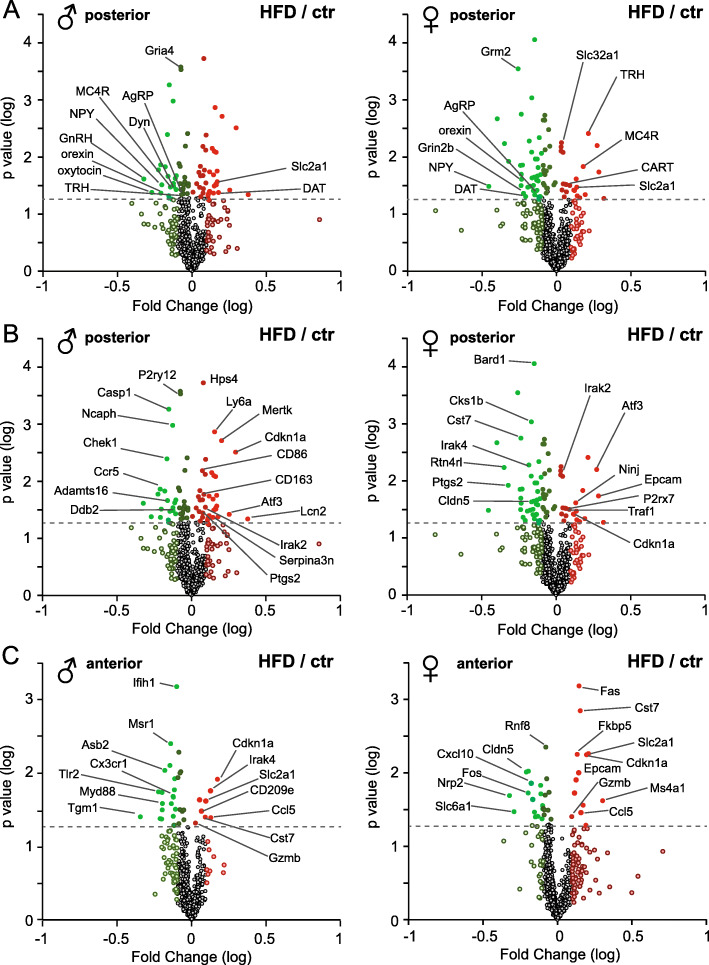
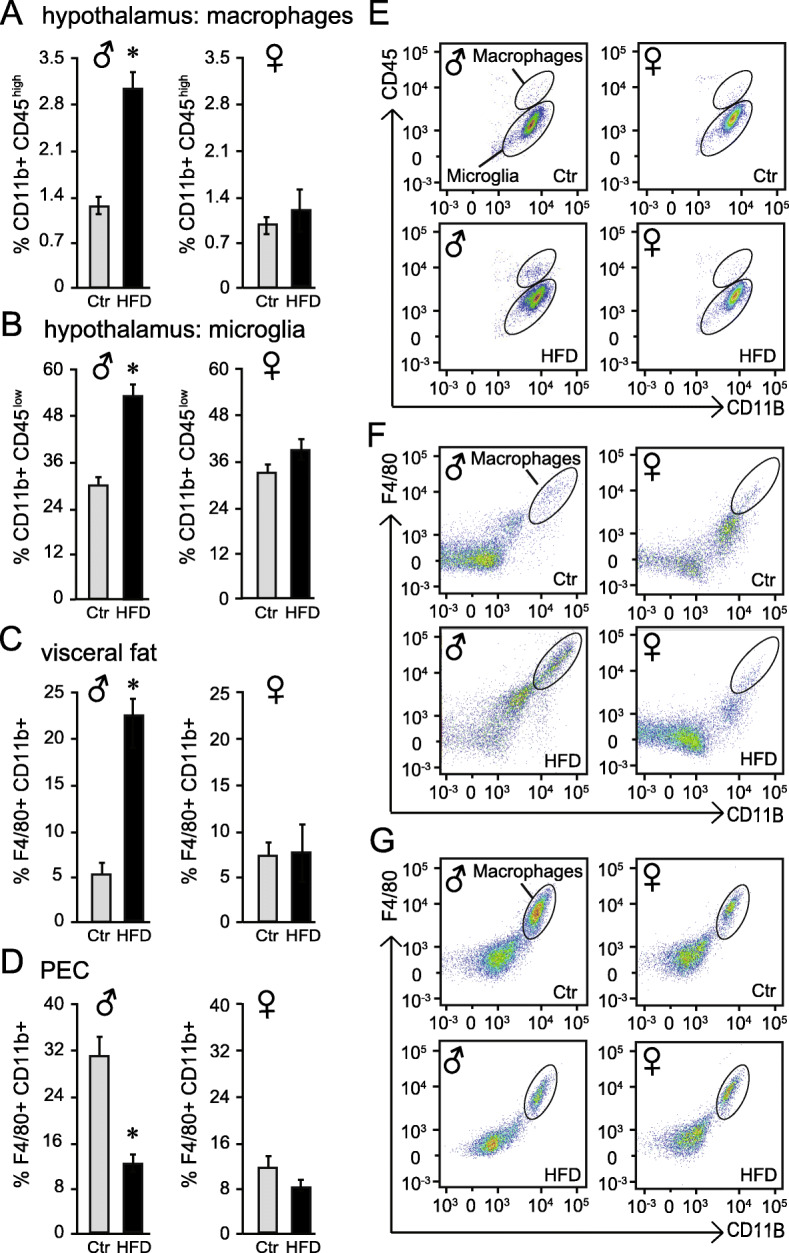
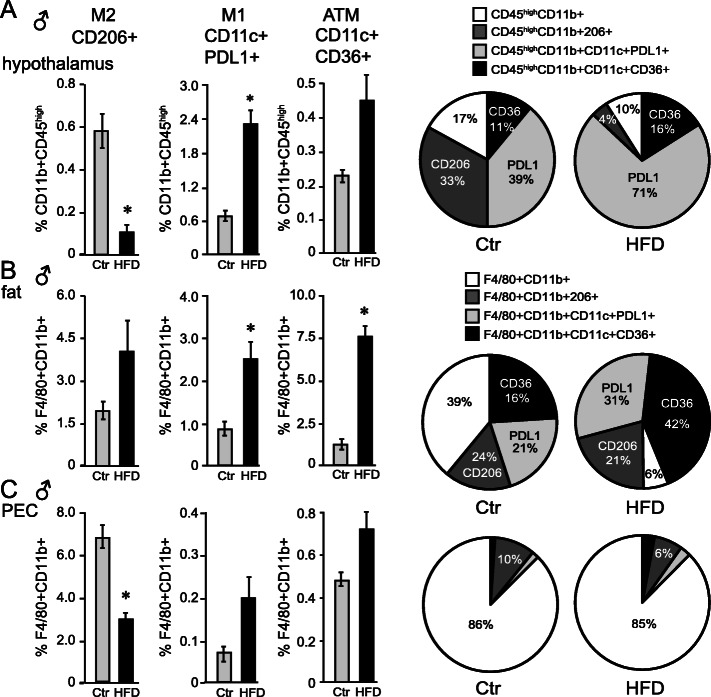
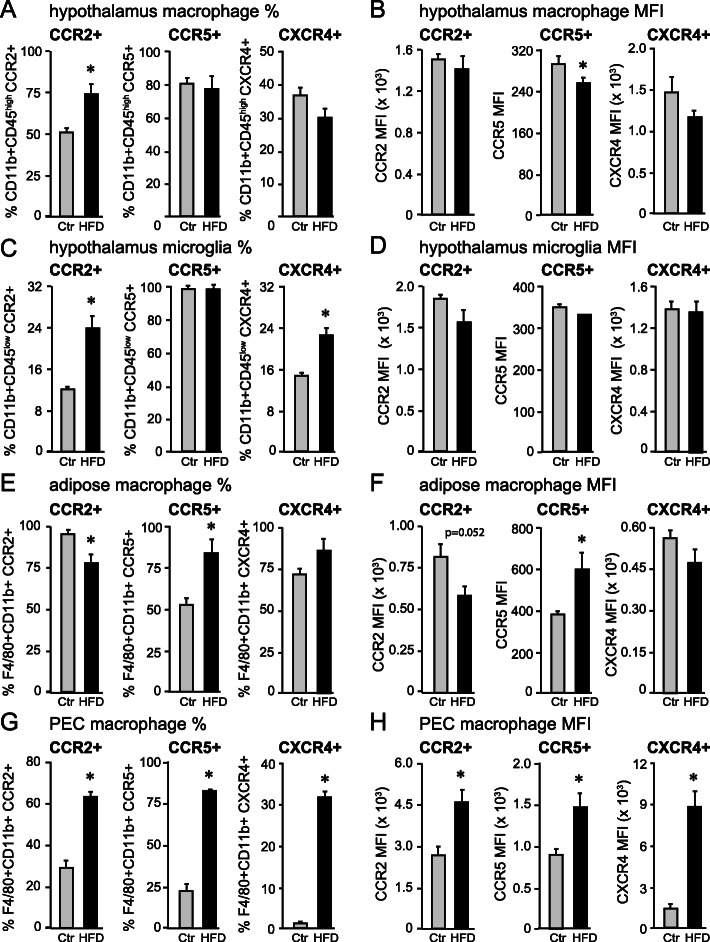
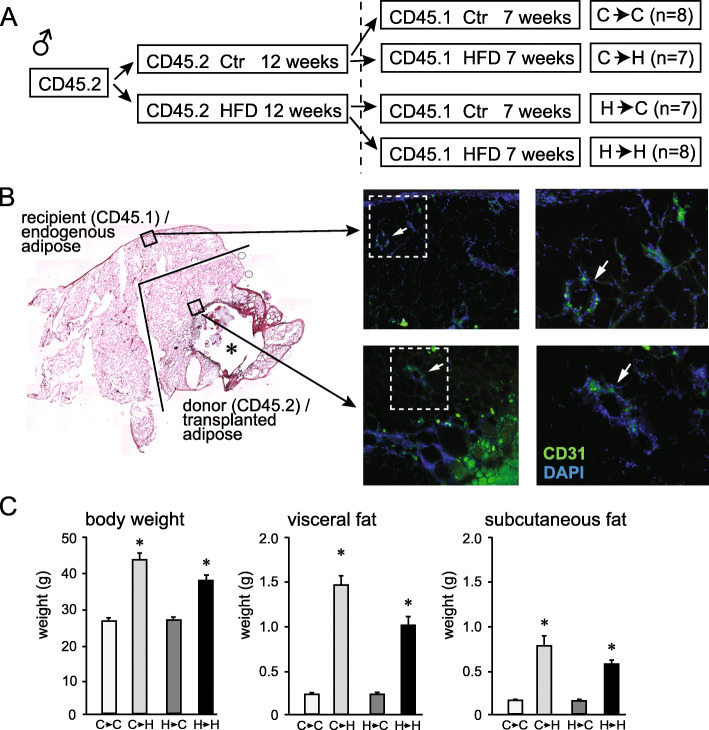
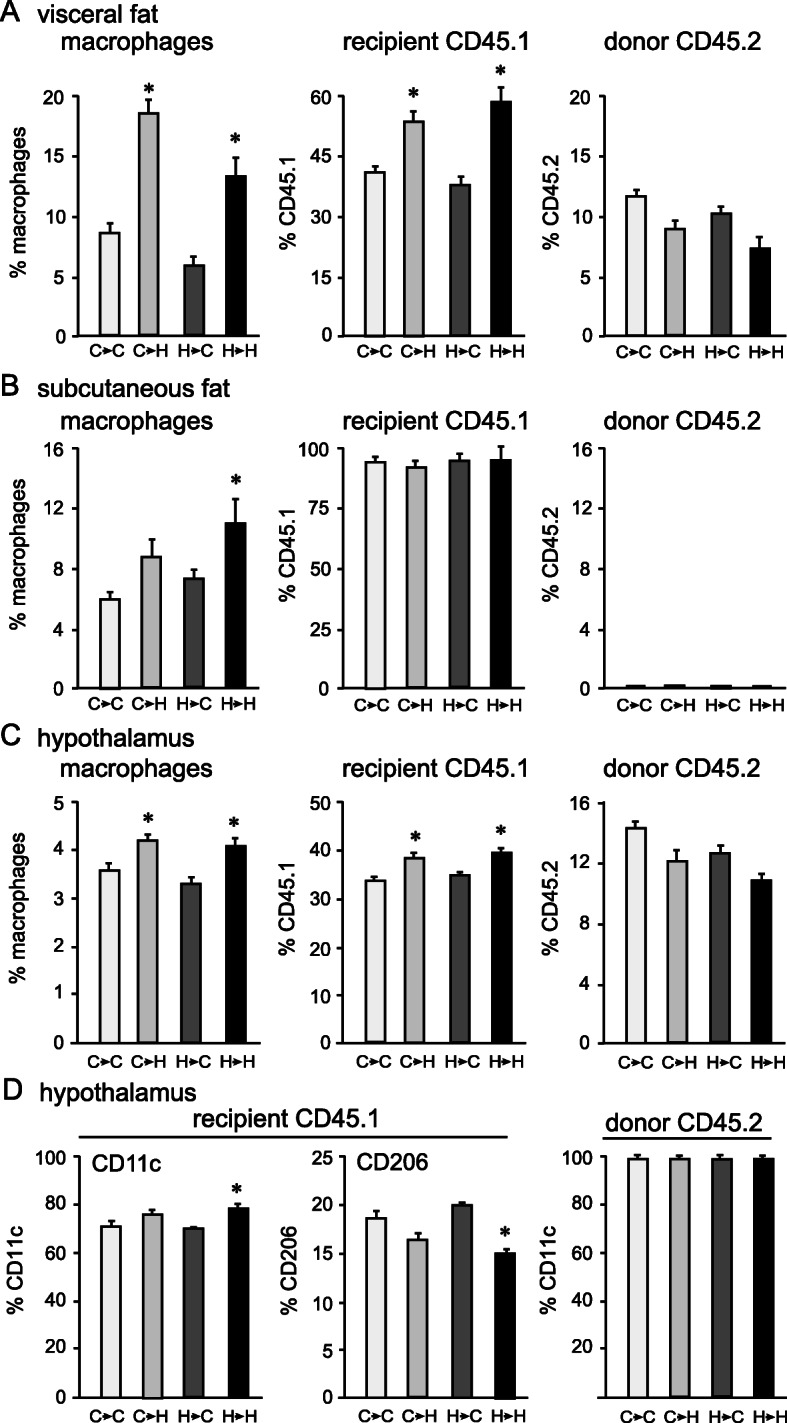
Background: Obesity is characterized by a systemic inflammation and hypothalamic neuroinflammation. Systemic inflammation is caused by macrophages that infiltrate obese adipose tissues. We previously demonstrated that high-fat diet (HFD)-fed male mice exhibited peripheral macrophage infiltration into the hypothalamus, in addition to activation of resident microglia. Since this infiltration contributes to neuroinflammation and neuronal impairment, herein we characterize the phenotype and origin of these hypothalamic macrophages in HFD mice. Methods: C57BL/6J mice were fed HFD (60% kcal from fat) or control diet with matching sucrose levels, for 12–16 weeks. Males and females were analyzed separately to determine sex-specific responses to HFD. Differences in hypothalamic gene expression in HFD-fed male and female mice, compared to their lean controls, in two different areas of the hypothalamus, were determined using the NanoString neuroinflammation panel. Phenotypic changes in macrophages that infiltrated the hypothalamus in HFD-fed mice were determined by analyzing cell surface markers using flow cytometry and compared to changes in macrophages from the adipose tissue and peritoneal cavity. Adipose tissue transplantation was performed to determine the source of hypothalamic macrophages. Results: We determined that hypothalamic gene expression profiles demonstrate sex-specific and region-specific diet-induced changes. Sex-specific changes included larger changes in males, while region-specific changes included larger changes in the area surrounding the median eminence. Several genes were identified that may provide partial protection to female mice. We also identified diet-induced changes in macrophage migration into the hypothalamus, adipose tissue, and peritoneal cavity, specifically in males. Further, we determined that hypothalamus-infiltrating macrophages express pro-inflammatory markers and markers of metabolically activated macrophages that were identical to markers of adipose tissue macrophages in HFD-fed mice. Employing adipose tissue transplant, we demonstrate that hypothalamic macrophages can originate from the visceral adipose tissue. Conclusion: HFD-fed males experience higher neuroinflammation than females, likely because they accumulate more visceral fat, which provides a source of pro-inflammatory macrophages that migrate to other tissues, including the hypothalamus. Our findings may explain the male bias for neuroinflammation and the metabolic syndrome. Together, our results demonstrate a new connection between the adipose tissue and the hypothalamus in obesity that contributes to neuroinflammation and hypothalamic pathologies.
Overview
The claims and statistics of this paper haven’t been checked yet.
Run the check — free, no account needed. It reads the open-access text and checks the sources it cites.
Integrity signals
Registry
Cites
Statistics
Figures
Verification
Claims the paper makes
The claims and statistics of this paper haven’t been checked yet.
Run the check — free, no account needed. It reads the open-access text and checks the sources it cites.
Claims other papers make about this one
Each is checked against this paper’s own text: does it say what the citing paper says it does?
The cited source says what the claim attributes to it.
In the citing paper
“Additionally, prolonged exposure to an HFD has been associated with macrophage infiltration into the hypothalamic region, further amplifying the local immune response and exacerbating neuroinflammatory conditions [7].”
From The Resistin/TLR4/miR-155-5p axis: a novel signaling pathway in the onset of hypothalamic neuroinflammation (2025) · cites this paper as [7]
Self-check
Percentages, sums and reported differences re-computed from the paper’s own numbers.
The self-check needs the paper’s full text.
Citations
Cites
Neurotoxic reactive astrocytes are induced by activated microglia
Liddelow, S. A., Guttenplan, K. A., Clarke, L. E., Bennett, F. C., Bohlen, C. J., Schirmer, L., Bennett, M. L., Münch, A. E., Chung, W.-S., Peterson, T. C., et al. (2017) · Nature · doi:10.1038/nature21029 · Cited by 7,971
Sex differences in immune responses
Klein, S. L., & Flanagan, K. L. (2016) · Nature Reviews Immunology · doi:10.1038/nri.2016.90 · Cited by 6,370
Development, maintenance and disruption of the blood-brain barrier
Obermeier, B., Daneman, R., & Ransohoff, R. M. (2013) · Nature Medicine · doi:10.1038/nm.3407 · Cited by 2,452
Adipose-derived circulating miRNAs regulate gene expression in other tissues
Thomou, T., Mori, M. A., Dreyfuss, J. M., Konishi, M., Sakaguchi, M., Wolfrum, C., Rao, T. N., Winnay, J. N., Garcia-Martin, R., Grinspoon, S. K., et al. (2017) · Nature · doi:10.1038/nature21365 · Cited by 1,539
Brown adipose tissue regulates glucose homeostasis and insulin sensitivity
Stanford, K. I., Middelbeek, R. J. W., Townsend, K. L., An, D., Nygaard, E. B., Hitchcox, K. M., Markan, K. R., Nakano, K., Hirshman, M. F., Tseng, Y.-H., et al. (2013) · Journal of Clinical Investigation · doi:10.1172/jci62308 · Cited by 1,180
Inflammation and insulin resistance
de Luca, C., & Olefsky, J. M. (2008) · FEBS Letters · doi:10.1016/j.febslet.2007.11.057 · Cited by 1,161
Ectopic Fat in Insulin Resistance, Dyslipidemia, and Cardiometabolic Disease
Shulman, G. I. (2014) · New England Journal of Medicine · doi:10.1056/nejmra1011035 · Cited by 1,126
Two physically, functionally, and developmentally distinct peritoneal macrophage subsets
Ghosn, E. E. B., Cassado, A. A., Govoni, G. R., Fukuhara, T., Yang, Y., Monack, D. M., Bortoluci, K. R., Almeida, S. R., Herzenberg, L. A., & Herzenberg, L. A. (2010) · Proceedings of the National Academy of Sciences · doi:10.1073/pnas.0915000107 · Cited by 689
Valdearcos, M., Douglass, J. D., Robblee, M. M., Dorfman, M. D., Stifler, D. R., Bennett, M. L., Gerritse, I., Fasnacht, R., Barres, B. A., Thaler, J. P., et al. (2017) · Cell Metabolism · doi:10.1016/j.cmet.2017.05.015 · Cited by 477
Rapid sensing of circulating ghrelin by hypothalamic appetite-modifying neurons
Schaeffer, M., Langlet, F., Lafont, C., Molino, F., Hodson, D. J., Roux, T., Lamarque, L., Verdié, P., Bourrier, E., Dehouck, B., et al. (2013) · Proceedings of the National Academy of Sciences · doi:10.1073/pnas.1212137110 · Cited by 325
Research works printed but not linked: 81
- The Lancet Public, H. Tackling obesity seriously: the time has come. Lancet Public Health. 2018;3(4):e153. · DOI
- McNelis JC, Olefsky JM. Macrophages, immunity, and metabolic disease. Immunity. 2014;41(1):36–48. https://doi.org/10.1016/j.immuni.2014.05.010. · DOI
- Olefsky JM, Glass CK. Macrophages, inflammation, and insulin resistance. Annu Rev Physiol. 2010;72(1):219–46. https://doi.org/10.1146/annurev-physiol-021909-135846. · DOI · Paper page
- Dorfman MD, Thaler JP. Hypothalamic inflammation and gliosis in obesity. Curr Opin Endocrinol Diabetes Obes. 2015;22(5):325–30. https://doi.org/10.1097/MED.0000000000000182. · DOI
- Chavarro JE, Ehrlich S, Colaci DS, Wright DL, Toth TL, Petrozza JC, et al. Body mass index and short-term weight change in relation to treatment outcomes in women undergoing assisted reproduction. Fertil Steril. 2012;98(1):109–16. https://doi.org/10.1016/j.fertnstert.2012.04.012. · DOI
- Sermondade N, Faure C, Fezeu L, Shayeb AG, Bonde JP, Jensen TK, et al. BMI in relation to sperm count: an updated systematic review and collaborative meta-analysis. Hum Reprod Update. 2013;19(3):221–31. https://doi.org/10.1093/humupd/dms050. · DOI
- Lainez NM, Coss D. Obesity, Neuroinflammation, and reproductive function. Endocrinology. 2019;160(11):2719–36. https://doi.org/10.1210/en.2019-00487. · DOI
- Lainez NM, Jonak CR, Nair MG, Ethell IM, Wilson EH, Carson MJ, et al. Diet-induced obesity elicits macrophage infiltration and reduction in spine density in the hypothalami of male but not female mice. Front Immunol. 2018;9(1992):1992. https://doi.org/10.3389/fimmu.2018.01992. · DOI
- Thaler JP, Guyenet SJ, Dorfman MD, Wisse BE, Schwartz MW. Hypothalamic inflammation: marker or mechanism of obesity pathogenesis? Diabetes. 2013;62(8):2629–34. https://doi.org/10.2337/db12-1605. · DOI
- Thaler JP, Yi CX, Schur EA, Guyenet SJ, Hwang BH, Dietrich MO, et al. Obesity is associated with hypothalamic injury in rodents and humans. J Clin Invest. 2012;122(1):153–62. https://doi.org/10.1172/JCI59660. · DOI · Paper page
- Schafer DP, Lehrman EK, Stevens B. The "quad-partite" synapse: microglia-synapse interactions in the developing and mature CNS. Glia. 2013;61(1):24–36. https://doi.org/10.1002/glia.22389. · DOI · Paper page
- Yang H, Graham LC, Reagan AM, Grabowska WA, Schott WH, Howell GR. Transcriptome profiling of brain myeloid cells revealed activation of Itgal, Trem1, and Spp1 in western diet-induced obesity. J Neuroinflammation. 2019;16(1):169. https://doi.org/10.1186/s12974-019-1527-z. · DOI
- Baufeld C, Osterloh A, Prokop S, Miller KR, Heppner FL. High-fat diet-induced brain region-specific phenotypic spectrum of CNS resident microglia. Acta Neuropathol. 2016;132(3):361–75. https://doi.org/10.1007/s00401-016-1595-4. · DOI
- Lee CH, Shin SH, Kang GM, Kim S, Kim J, Yu R, et al. Cellular source of hypothalamic macrophage accumulation in diet-induced obesity. J Neuroinflammation. 2019;16(1):221. https://doi.org/10.1186/s12974-019-1607-0. · DOI
- Kim DW, Glendining KA, Grattan DR, Jasoni CL. Maternal obesity in the mouse compromises the blood-brain barrier in the arcuate nucleus of offspring. Endocrinology. 2016;157(6):2229–42. https://doi.org/10.1210/en.2016-1014. · DOI
- Van Dyken P, Lacoste B. Impact of metabolic syndrome on neuroinflammation and the blood-brain barrier. Front Neurosci. 2018;12:930. https://doi.org/10.3389/fnins.2018.00930. · DOI
- Miyata S. New aspects in fenestrated capillary and tissue dynamics in the sensory circumventricular organs of adult brains. Front Neurosci. 2015;9:390. · DOI
- McKinley MJ, et al. From sensory circumventricular organs to cerebral cortex: neural pathways controlling thirst and hunger. J Neuroendocrinol. 2019;31(3):e12689. https://doi.org/10.1111/jne.12689. · DOI
- Ciofi P, Garret M, Lapirot O, Lafon P, Loyens A, Prévot V, et al. Brain-endocrine interactions: a microvascular route in the mediobasal hypothalamus. Endocrinology. 2009;150(12):5509–19. https://doi.org/10.1210/en.2009-0584. · DOI
- Weisberg SP, McCann D, Desai M, Rosenbaum M, Leibel RL, Ferrante AW Jr. Obesity is associated with macrophage accumulation in adipose tissue. J Clin Invest. 2003;112(12):1796–808. https://doi.org/10.1172/JCI200319246. · DOI · Paper page
- Curat CA, Wegner V, Sengenès C, Miranville A, Tonus C, Busse R, et al. Macrophages in human visceral adipose tissue: increased accumulation in obesity and a source of resistin and visfatin. Diabetologia. 2006;49(4):744–7. https://doi.org/10.1007/s00125-006-0173-z. · DOI · Paper page
- Xu H, Barnes GT, Yang Q, Tan G, Yang D, Chou CJ, et al. Chronic inflammation in fat plays a crucial role in the development of obesity-related insulin resistance. J Clin Invest. 2003;112(12):1821–30. https://doi.org/10.1172/JCI200319451. · DOI · Paper page
- Kanda H, Tateya S, Tamori Y, Kotani K, Hiasa K, Kitazawa R, et al. MCP-1 contributes to macrophage infiltration into adipose tissue, insulin resistance, and hepatic steatosis in obesity. J Clin Invest. 2006;116(6):1494–505. https://doi.org/10.1172/JCI26498. · DOI · Paper page
- Kaplan JL, Marshall MA, C. McSkimming C, Harmon DB, Garmey JC, Oldham SN, et al. Adipocyte progenitor cells initiate monocyte chemoattractant protein-1-mediated macrophage accumulation in visceral adipose tissue. Mol Metab. 2015;4(11):779–94. https://doi.org/10.1016/j.molmet.2015.07.010. · DOI
- Chen KE, Lainez NM, Coss D. Sex differences in macrophage responses to obesity-mediated changes determine migratory and inflammatory traits.J Immunol. 2021; 206(1):141–53. https://doi.org/10.4049/jimmunol.2000490. · DOI
- Gruen ML, Hao M, Piston DW, Hasty AH. Leptin requires canonical migratory signaling pathways for induction of monocyte and macrophage chemotaxis. Am J Phys Cell Phys. 2007;293(5):C1481–8. https://doi.org/10.1152/ajpcell.00062.2007. · DOI
- Conde J, Scotece M, Gómez R, Gómez-Reino JJ, Lago F, Gualillo O. At the crossroad between immunity and metabolism: focus on leptin. Expert Rev Clin Immunol. 2010;6(5):801–8. https://doi.org/10.1586/eci.10.48. · DOI
- Kitade H, Sawamoto K, Nagashimada M, Inoue H, Yamamoto Y, Sai Y, et al. CCR5 plays a critical role in obesity-induced adipose tissue inflammation and insulin resistance by regulating both macrophage recruitment and M1/M2 status. Diabetes. 2012;61(7):1680–90. https://doi.org/10.2337/db11-1506. · DOI
- Nara N, Nakayama Y, Okamoto S, Tamura H, Kiyono M, Muraoka M, et al. Disruption of CXC motif chemokine ligand-14 in mice ameliorates obesity-induced insulin resistance. J Biol Chem. 2007;282(42):30794–803. https://doi.org/10.1074/jbc.M700412200. · DOI · Paper page
- Lu J, et al. CXCL14 as an emerging immune and inflammatory modulator. J Inflamm (London, England). 2016;13:1–1. · DOI
- Tanegashima K, Suzuki K, Nakayama Y, Tsuji K, Shigenaga A, Otaka A, et al. CXCL14 is a natural inhibitor of the CXCL12–CXCR4 signaling axis. FEBS Lett. 2013;587(12):1731–5. https://doi.org/10.1016/j.febslet.2013.04.046. · DOI
- Réaux-Le Goazigo A, et al. Current status of chemokines in the adult CNS. Prog Neurobiol. 2013;104:67–92. https://doi.org/10.1016/j.pneurobio.2013.02.001. · DOI
- Guyon A. CXCL12 chemokine and its receptors as major players in the interactions between immune and nervous systems. Front Cell Neurosci. 2014;8(65). https://doi.org/10.3389/fncel.2014.00065. · DOI
- Deng ZB, Liu Y, Liu C, Xiang X, Wang J, Cheng Z, et al. Immature myeloid cells induced by a high-fat diet contribute to liver inflammation. Hepatology. 2009;50(5):1412–20. https://doi.org/10.1002/hep.23148. · DOI
- Obstfeld AE, Sugaru E, Thearle M, Francisco AM, Gayet C, Ginsberg HN, et al. C-C chemokine receptor 2 (CCR2) regulates the hepatic recruitment of myeloid cells that promote obesity-induced hepatic steatosis. Diabetes. 2010;59(4):916–25. https://doi.org/10.2337/db09-1403. · DOI
- Varma V, Yao-Borengasser A, Rasouli N, Nolen GT, Phanavanh B, Starks T, et al. Muscle inflammatory response and insulin resistance: synergistic interaction between macrophages and fatty acids leads to impaired insulin action. Am J Physiol Endocrinol Metab. 2009;296(6):E1300–10. https://doi.org/10.1152/ajpendo.90885.2008. · DOI · Paper page
- Wang X, Zhao D, Cui Y, Lu S, Gao D, Liu J. Proinflammatory macrophages impair skeletal muscle differentiation in obesity through secretion of tumor necrosis factor-alpha via sustained activation of p38 mitogen-activated protein kinase. J Cell Physiol. 2019;234(3):2566–80. https://doi.org/10.1002/jcp.27012. · DOI
- Dorrance AM, Matin N, Pires PW. The effects of obesity on the cerebral vasculature. Curr Vasc Pharmacol. 2014;12(3):462–72. https://doi.org/10.2174/1570161112666140423222411. · DOI
- Sochocka M, Diniz BS, Leszek J. Inflammatory response in the CNS: friend or foe? Mol Neurobiol. 2017;54(10):8071–89. https://doi.org/10.1007/s12035-016-0297-1. · DOI · Paper page
- Hao S, Dey A, Yu X, Stranahan AM. Dietary obesity reversibly induces synaptic stripping by microglia and impairs hippocampal plasticity. Brain Behav Immun. 2016;51:230–9. https://doi.org/10.1016/j.bbi.2015.08.023. · DOI
- Link JC, Reue K. Genetic basis for sex differences in obesity and lipid metabolism. Annu Rev Nutr. 2017;37(1):225–45. https://doi.org/10.1146/annurev-nutr-071816-064827. · DOI
- Gerdts E, Regitz-Zagrosek V. Sex differences in cardiometabolic disorders. Nat Med. 2019;25(11):1657–66. https://doi.org/10.1038/s41591-019-0643-8. · DOI
- Camporez JP, Lyu K, Goldberg EL, Zhang D, Cline GW, Jurczak MJ, et al. Anti-inflammatory effects of oestrogen mediate the sexual dimorphic response to lipid-induced insulin resistance. J Physiol. 2019;597(15):3885–903. https://doi.org/10.1113/JP277270. · DOI · Paper page
- Lumeng CN, Bodzin JL, Saltiel AR. Obesity induces a phenotypic switch in adipose tissue macrophage polarization. J Clin Invest. 2007;117(1):175–84. https://doi.org/10.1172/JCI29881. · DOI · Paper page
- Tran TT, Yamamoto Y, Gesta S, Kahn CR. Beneficial effects of subcutaneous fat transplantation on metabolism. Cell Metab. 2008;7(5):410–20. https://doi.org/10.1016/j.cmet.2008.04.004. · DOI
- Morita S, Miyata S. Different vascular permeability between the sensory and secretory circumventricular organs of adult mouse brain. Cell Tissue Res. 2012;349(2):589–603. https://doi.org/10.1007/s00441-012-1421-9. · DOI
- Lainez NM, Coss D. Leukemia inhibitory factor represses GnRH gene expression via cFOS during inflammation in male mice. Neuroendocrinology. 2019;108(4):291–307. https://doi.org/10.1159/000496754. · DOI
- Tortoriello DV, McMinn J, Chua SC. Dietary-induced obesity and hypothalamic infertility in female DBA/2J mice. Endocrinology. 2004;145(3):1238–47. https://doi.org/10.1210/en.2003-1406. · DOI
- Nam KN, Mounier A, Wolfe CM, Fitz NF, Carter AY, Castranio EL, et al. Effect of high fat diet on phenotype, brain transcriptome and lipidome in Alzheimer's model mice. Sci Rep. 2017;7(1):4307. https://doi.org/10.1038/s41598-017-04412-2. · DOI
- Bandurska-Stankiewicz E. Thyroid hormones – obesity and metabolic syndrome. Thyroid Res. 2013;6(Suppl 2):A5. https://doi.org/10.1186/1756-6614-6-S2-A5. · DOI
- Reinehr T. Obesity and thyroid function. Mol Cell Endocrinol. 2010;316(2):165–71. https://doi.org/10.1016/j.mce.2009.06.005. · DOI
- Baldini G, Phelan KD. The melanocortin pathway and control of appetite-progress and therapeutic implications. J Endocrinol. 2019;241(1):R1–r33. https://doi.org/10.1530/JOE-18-0596. · DOI
- Klepper J, Wang D, Fischbarg J, Vera JC, Jarjour IT, O'Driscoll KR, et al. Defective glucose transport across brain tissue barriers: a newly recognized neurological syndrome. Neurochem Res. 1999;24(4):587–94. https://doi.org/10.1023/A:1022544131826. · DOI
- Galimberti VE, Rothlin CV, Ghosh S. Funerals and feasts: the immunological rites of cell death. Yale J Biol Med. 2019;92(4):663–74.
- Hai T, Wolford CC, Chang Y-S. ATF3, a hub of the cellular adaptive-response network, in the pathogenesis of diseases: is modulation of inflammation a unifying component? Gene Expr. 2010;15(1):1–11. https://doi.org/10.3727/105221610X12819686555015. · DOI
- Mishra SK, Kumar BSH, Khushu S, Singh AK, Gangenahalli G. Early monitoring and quantitative evaluation of macrophage infiltration after experimental traumatic brain injury: a magnetic resonance imaging and flow cytometric analysis. Mol Cell Neurosci. 2017;78:25–34. https://doi.org/10.1016/j.mcn.2016.11.008. · DOI
- Hernandez A, et al. Differential detection of impact site versus rotational site injury by magnetic resonance imaging and microglial morphology in an unrestrained mild closed head injury model. J Neurochem. 2016;136(Suppl 1)):18–28. · DOI
- Bain CC, Jenkins SJ. The biology of serous cavity macrophages. Cell Immunol. 2018;330:126–35. https://doi.org/10.1016/j.cellimm.2018.01.003. · DOI
- Kennedy DJ, Kuchibhotla S, Westfall KM, Silverstein RL, Morton RE, Febbraio M. A CD36-dependent pathway enhances macrophage and adipose tissue inflammation and impairs insulin signalling. Cardiovasc Res. 2010;89(3):604–13. https://doi.org/10.1093/cvr/cvq360. · DOI
- Cai L, Wang Z, Ji A, Meyer JM, van der Westhuyzen DR. Scavenger receptor CD36 expression contributes to adipose tissue inflammation and cell death in diet-induced obesity. PLoS One. 2012;7(5):e36785. https://doi.org/10.1371/journal.pone.0036785. · DOI
- Nicholls HT, Kowalski G, Kennedy DJ, Risis S, Zaffino LA, Watson N, et al. Hematopoietic cell-restricted deletion of CD36 reduces high-fat diet-induced macrophage infiltration and improves insulin signaling in adipose tissue. Diabetes. 2011;60(4):1100–10. https://doi.org/10.2337/db10-1353. · DOI
- Oldenhove G, et al. PD-1 is involved in the dysregulation of type 2 innate lymphoid cells in a murine model of obesity. Cell Rep. 2018;25(8):2053–60 e4. https://doi.org/10.1016/j.celrep.2018.10.091. · DOI
- Albright AV, et al. Microglia express CCR5, CXCR4, and CCR3, but of these, CCR5 is the principal coreceptor for human immunodeficiency virus type 1 dementia isolates. J Virol. 1999;73(1):205–13. https://doi.org/10.1128/JVI.73.1.205-213.1999. · DOI
- Hattori Y, Miyata T. Microglia extensively survey the developing cortex via the CXCL12/CXCR4 system to help neural progenitors to acquire differentiated properties. Genes Cells. 2018;23(10):915–22. https://doi.org/10.1111/gtc.12632. · DOI
- Strissel KJ, Stancheva Z, Miyoshi H, Perfield JW, DeFuria J, Jick Z, et al. Adipocyte death, adipose tissue remodeling, and obesity complications. Diabetes. 2007;56(12):2910–8. https://doi.org/10.2337/db07-0767. · DOI · Paper page
- Stubbins RE, Holcomb VB, Hong J, Núñez NP. Estrogen modulates abdominal adiposity and protects female mice from obesity and impaired glucose tolerance. Eur J Nutr. 2012;51(7):861–70. https://doi.org/10.1007/s00394-011-0266-4. · DOI
- Palmer BF, Clegg DJ. The sexual dimorphism of obesity. Mol Cell Endocrinol. 2015;402:113–9. https://doi.org/10.1016/j.mce.2014.11.029. · DOI · Paper page
- Sam S. Differential effect of subcutaneous abdominal and visceral adipose tissue on cardiometabolic risk. Horm Mol Biol Clin Invest. 2018;33(1). https://doi.org/10.1515/hmbci-2018-0014. · DOI
- Guo DH, Yamamoto M, Hernandez CM, Khodadadi H, Baban B, Stranahan AM. Visceral adipose NLRP3 impairs cognition in obesity via IL-1R1 on CX3CR1+ cells. J Clin Invest. 2020;130(4):1961–76. https://doi.org/10.1172/JCI126078. · DOI
- de Souza CUT, et al. Consumption of a fat-rich diet activates a proinflammatory response and induces insulin resistance in the hypothalamus. Endocrinology. 2005;146(10):4192–9. https://doi.org/10.1210/en.2004-1520. · DOI · Paper page
- Daemen S, Schilling JD. The interplay between tissue niche and macrophage cellular metabolism in obesity. Front Immunol. 2020;10(3133). https://doi.org/10.3389/fimmu.2019.03133. · DOI
- Robb JL, et al. Immunometabolic changes in glia - a potential role in the pathophysiology of obesity and diabetes. Neuroscience. 2020;447:167–181.https://doi.org/10.1016/j.neuroscience.2019.10.021. · DOI
- Russo L, Lumeng CN. Properties and functions of adipose tissue macrophages in obesity. Immunology. 2018;155(4):407–17. https://doi.org/10.1111/imm.13002. · DOI
- Hill AA, Reid Bolus W, Hasty AH. A decade of progress in adipose tissue macrophage biology. Immunol Rev. 2014;262(1):134–52. https://doi.org/10.1111/imr.12216. · DOI
- Ito A, Suganami T, Yamauchi A, Degawa-Yamauchi M, Tanaka M, Kouyama R, et al. Role of CC chemokine receptor 2 in bone marrow cells in the recruitment of macrophages into obese adipose tissue. J Biol Chem. 2008;283(51):35715–23. https://doi.org/10.1074/jbc.M804220200. · DOI
- Guyon A. CXCL12 chemokine and GABA neurotransmitter systems crosstalk and their putative roles. Front Cell Neurosci. 2014;5:115. · DOI
- Wang J, Kubes P. A reservoir of mature cavity macrophages that can rapidly invade visceral organs to affect tissue repair. Cell. 2016;165(3):668–78. https://doi.org/10.1016/j.cell.2016.03.009. · DOI · Paper page
- Rehermann B. Mature peritoneal macrophages take an avascular route into the injured liver and promote tissue repair. Hepatology (Baltimore, Md). 2017;65(1):376–9. · DOI
- Gubbels Bupp MR. Sex, the aging immune system, and chronic disease. Cell Immunol. 2015;294(2):102–10. https://doi.org/10.1016/j.cellimm.2015.02.002. · DOI
- Chowen JA, et al. Sex differences in the neuroendocrine control of metabolism and the implication of astrocytes. Front Neuroendocrinol. 2018;48:3–12. https://doi.org/10.1016/j.yfrne.2017.05.003. · DOI
- Singer K, Maley N, Mergian T, DelProposto J, Cho KW, Zamarron BF, et al. Differences in hematopoietic stem cells contribute to sexually dimorphic inflammatory responses to high fat diet-induced obesity. J Biol Chem. 2015;290(21):13250–62. https://doi.org/10.1074/jbc.M114.634568. · DOI
Cited by
Sorted by citations
Mączka, K., Stasiak, O., Przybysz, P., Grymowicz, M., & Smolarczyk, R. (2024) · International Journal of Molecular Sciences · doi:10.3390/ijms25179391 · Cited by 38
Prévost, M., Crépin, D., Rifai, S. A., Poizat, G., Gonçalves, M., van Barneveld, F., Shadpay, R., Taouis, K., Riffault, L., Benomar, Y., et al. (2025) · Journal of Neuroinflammation · doi:10.1186/s12974-025-03522-3 · Cited by 19
Metadata
- Authors
- Chen, K.-H. E., Lainez, N. M., Nair, M. G., & Coss, D.
- ORCID
- Coss, Djurdjica
- Venue
- Journal of Neuroinflammation
- Published
- 2021-06-21
- Volume
- 18
- Issue
- 1
- ISSN
- 1742-2094
- PMC
- PMC8218389
- Cited by
- 38
- References
- 13
- Language
- en
- Funders
- National Institutes of Health (HD091167 NICHD, AI153195)
About these checks
Registry, retraction, Cites and statistics results are computed, not judged, with one exception: a printed reference that no index lists is read once by a model before it counts as a citation error. Claims are extracted by a model and kept only when their quote appears verbatim in the text; each cited source is then checked, with a model’s help, for whether it says what the claim relies on. Those verdicts can be wrong — read the claim’s quote and the cited source before relying on one.
Statistics and arithmetic are recomputed, not judged.
Confidence bands are shown only for fields calibrated on our annotated test set. None is calibrated yet, so no band is shown.
What counts as a claim ›How we measure confidence ›How we check this ›
Are you an author, or do you see a problem with this page? Request a review
