

The DOI matches its Crossref record; 87 of the 87 references it cites were found in a registry or an index.
Selective reduction of astrocyte apoE3 and apoE4 strongly reduces Aβ accumulation and plaque-related pathology in a mouse model of amyloidosis
Open accessAbstract
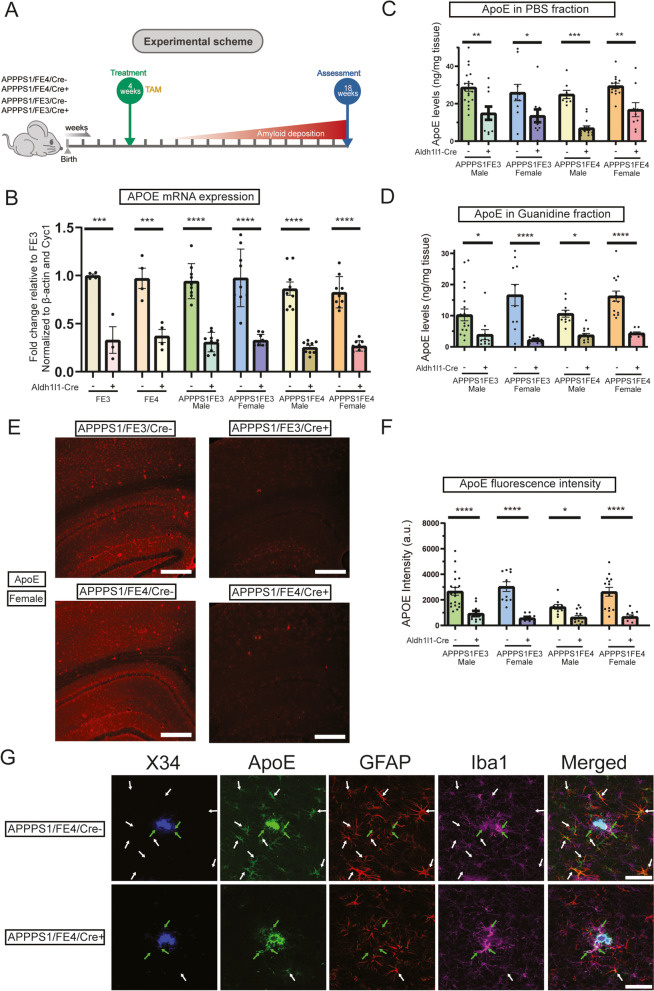
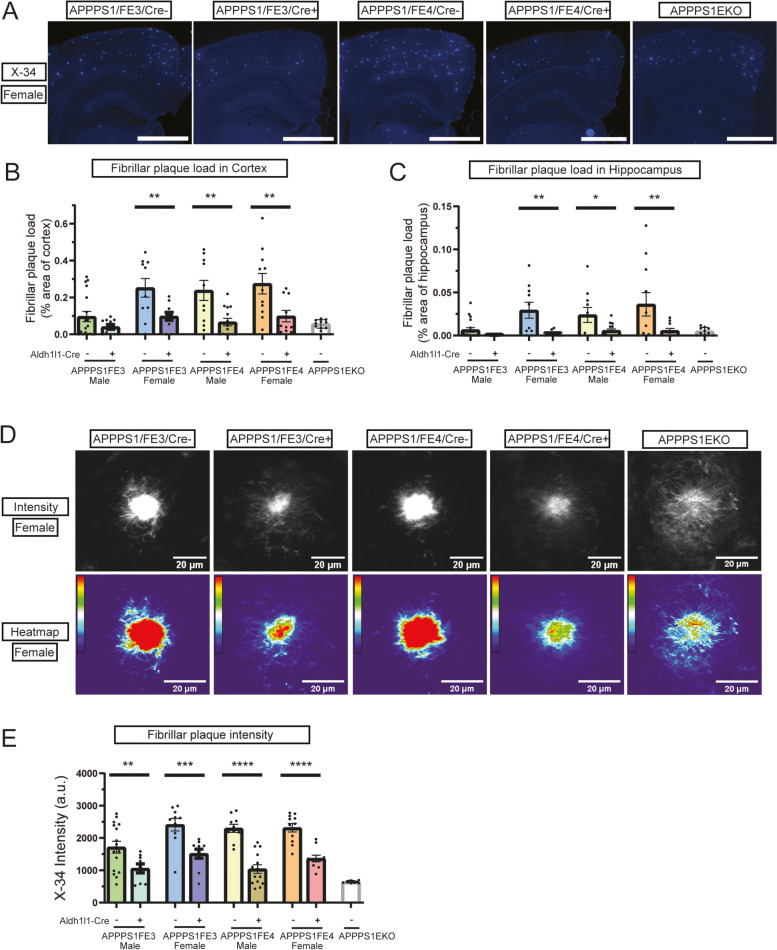
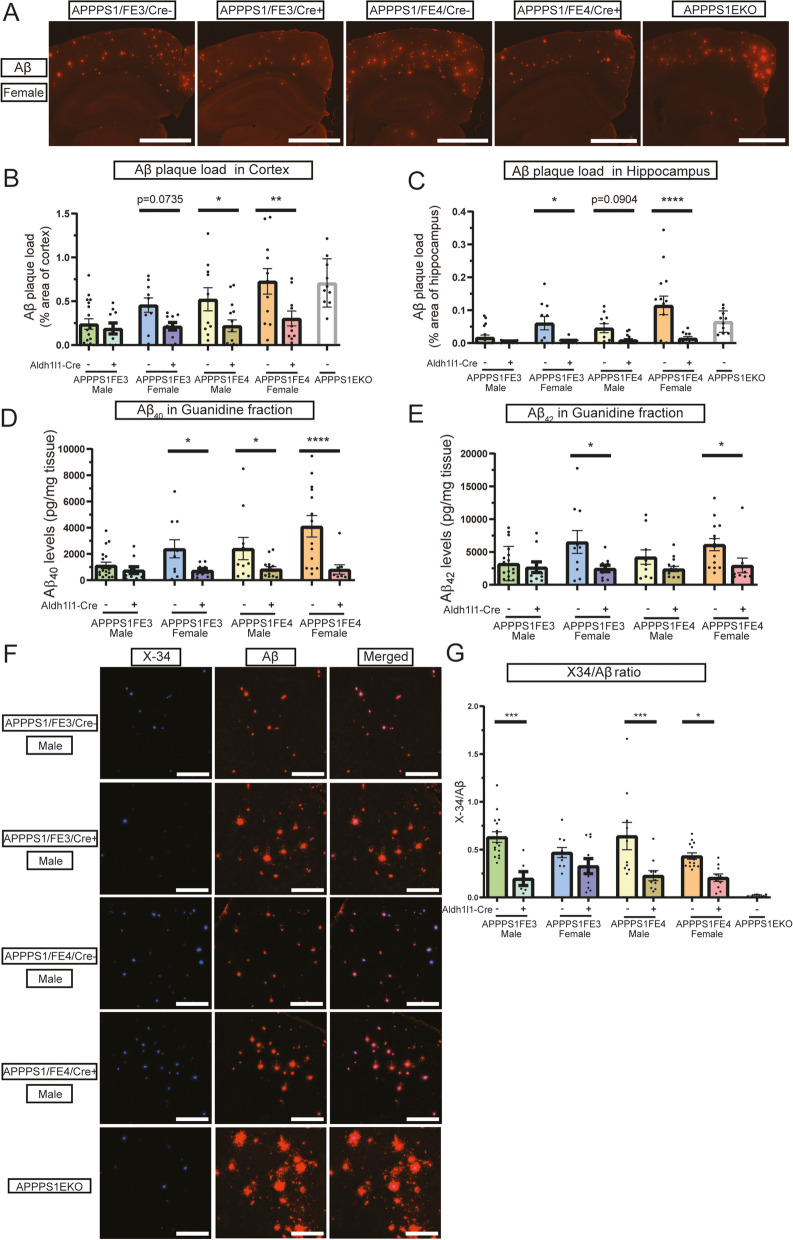
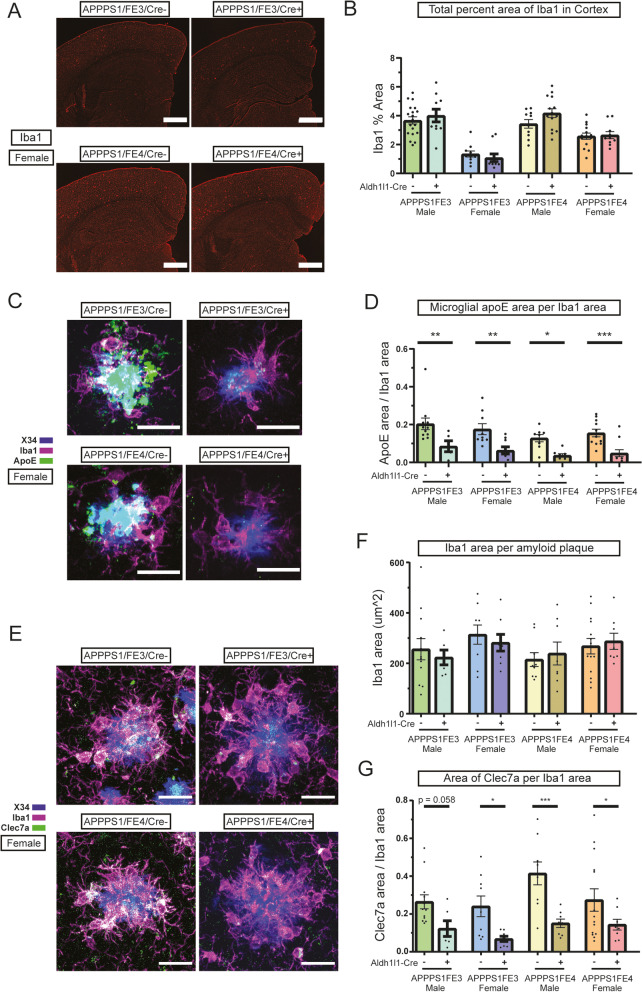
Background: One of the key pathological hallmarks of Alzheimer disease (AD) is the accumulation of the amyloid-β (Aβ) peptide into amyloid plaques. The apolipoprotein E (APOE) gene is the strongest genetic risk factor for late-onset AD and has been shown to influence the accumulation of Aβ in the brain in an isoform-dependent manner. ApoE can be produced by different cell types in the brain, with astrocytes being the largest producer of apoE, although reactive microglia also express high levels of apoE. While studies have shown that altering apoE levels in the brain can influence the development of Aβ plaque pathology, it is not fully known how apoE produced by specific cell types, such as astrocytes, contributes to amyloid pathology. Methods: We utilized APOE knock-in mice capable of having APOE selectively removed from astrocytes in a tamoxifen-inducible manner and crossed them with the APP/PS1-21 mouse model of amyloidosis. We analyzed the changes to Aβ plaque levels and assessed the impact on cellular responses to Aβ plaques when astrocytic APOE is removed. Results: Tamoxifen administration was capable of strongly reducing apoE levels in the brain by markedly reducing astrocyte apoE, while microglial apoE expression remained. Reduction of astrocytic apoE3 and apoE4 led to a large decrease in Aβ plaque deposition and less compact plaques. While overall Iba1+ microglia were unchanged in the cortex after reducing astrocyte apoE, the expression of the disease-associated microglial markers Clec7a and apoE were lower around amyloid plaques, indicating decreased microglial activation. Additionally, astrocyte GFAP levels are unchanged around amyloid plaques, but overall GFAP levels are reduced in the cortex of female apoE4 mice after a reduction in astrocytic apoE. Finally, while the amount of neuritic dystrophy around remaining individual plaques was increased with the removal of astrocytic apoE, the overall amount of cortical amyloid-associated neuritic dystrophy was significantly decreased. Conclusion: This study reveals an important role of astrocytic apoE3 and apoE4 on the deposition and accumulation of Aβ plaques as well as on certain Aβ-associated downstream effects.
Overview
The claims and statistics of this paper haven’t been checked yet.
Run the check — free, no account needed. It reads the open-access text and checks the sources it cites.
Integrity signals
Registry
Cites
Statistics
Figures
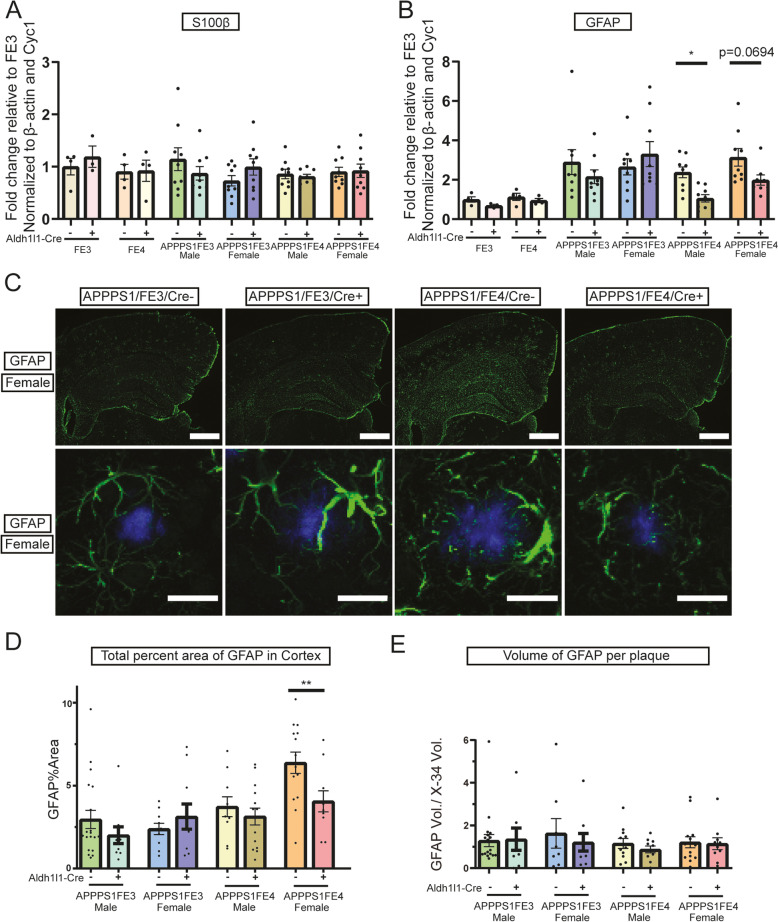
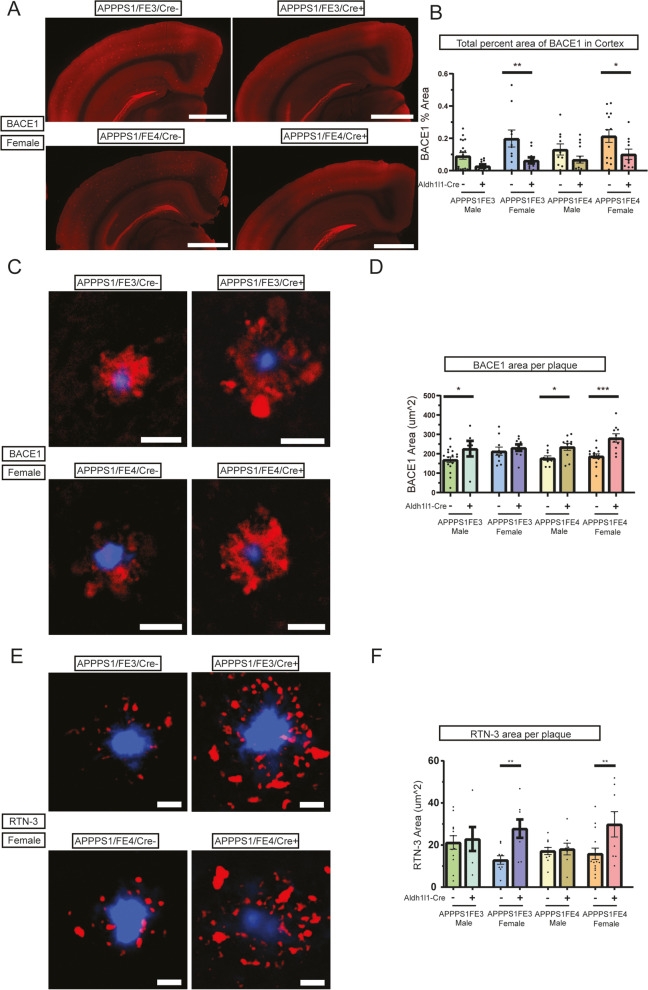
Verification
Claims the paper makes
The claims and statistics of this paper haven’t been checked yet.
Run the check — free, no account needed. It reads the open-access text and checks the sources it cites.
Claims other papers make about this one
Each is checked against this paper’s own text: does it say what the citing paper says it does?
The source backs part of the claim, not all of it — or backs it for a different population, condition or comparison.
In the citing paper
“Studies have demonstrated that APOE4 drives Aβ- and tau-mediated neurodegeneration by inducing microglial and astrocytic activation.174–179”
From Microbiota–gut–brain axis and its therapeutic applications in neurodegenerative diseases (2024) · cites this paper as [176]
Experimental — accuracy not yet measuredThe source backs part of the claim, not all of it — or backs it for a different population, condition or comparison.
In the citing paper
“removal of both astrocytic APOE3 and APOE4 is protective against Aβ deposition in plaque-depositing mice; specifically, plaque burden was lowered to the levels of Apoe knockout mice148.”
From Multifaceted roles of APOE in Alzheimer disease (2024) · cites this paper as [148]
Experimental — accuracy not yet measuredThe source backs part of the claim, not all of it — or backs it for a different population, condition or comparison.
In the citing paper
“removal of astrocytic APOE reduced microglial reaction to Aβ plaques and neurofibrillary tangles, but that astrocyte response to plaques and tangles was largely unchanged148,149”
From Multifaceted roles of APOE in Alzheimer disease (2024) · cites this paper as [148]
Experimental — accuracy not yet measuredThe source backs part of the claim, not all of it — or backs it for a different population, condition or comparison.
In the citing paper
“Restoration of APOE expression in astrocytes alone is sufficient to induce formation of fibrillar plaques and microglia reactivity, extending findings from previous studies (Holtzman et al, 2000a; Liu et al, 2017b; Mahan et al, 2022).”
From APOE from astrocytes restores Alzheimer’s Aβ-pathology and DAM-like responses in APOE deficient microglia (2024) · cites this paper as Mahan et al, 2022
Experimental — accuracy not yet measuredThe source backs part of the claim, not all of it — or backs it for a different population, condition or comparison.
In the citing paper
“Total body apoE knockout as well as astrocyte specific ApoE knockout results in markedly decreased fibrillar amyloid deposition and in less compact Aβ plaques as well as decreasing neuronal loss and reactive gliosis in a tauopathy model [96, 99, 100].”
From ApoE lipoproteins in the central nervous system under homeostasis and role in Alzheimer’s disease and related disorders (2026) · cites this paper as [96]
Experimental — accuracy not yet measured
The source backs part of the claim, not all of it — or backs it for a different population, condition or comparison.
In the citing paper
“Knockout of ApoE in astrocytes versus microglia has differing impacts on disease pathogenesis in mouse models of Aβ amyloidosis suggesting that ApoE produced from different cell types may differentially affect disease outcomes [96, 97].”
From ApoE lipoproteins in the central nervous system under homeostasis and role in Alzheimer’s disease and related disorders (2026) · cites this paper as [96]
Experimental — accuracy not yet measuredThe source backs part of the claim, not all of it — or backs it for a different population, condition or comparison.
In the citing paper
“as evidenced by studies showing astrocyte-specific knockout of ApoE results in markedly decreased Aβ pathology and tau-mediated neurodegeneration (13, 14, 15).”
From Lipidome and proteome of astrocyte and microglia ApoE lipoprotein reveal differences based on cell type and ApoE isoform (2026) · cites this paper as [14]
Experimental — accuracy not yet measuredThe cited source says what the claim attributes to it.
In the citing paper
“findings from a study by Mahan et al.36 suggested a role for astrocyte-derived ApoE in amyloid reduction and associated gliosis.”
From APOE4 to APOE2 allelic switching in mice improves Alzheimer’s disease-related metabolic signatures, neuropathology and cognition (2025) · cites this paper as Mahan et al.36
The cited source says what the claim attributes to it.
In the citing paper
“While that study did not report decreases in IBA1 as those seen in this study, they observed a similar decrease in reactive microglia using Clec7a, and a reduction in plaque-associated ApoE.”
From APOE4 to APOE2 allelic switching in mice improves Alzheimer’s disease-related metabolic signatures, neuropathology and cognition (2025) · cites this paper as Mahan et al.36
The cited source says what the claim attributes to it.
In the citing paper
“the characterization of microglia in astrocyte-specific Apoe knockout mice certainly indicates that microglia are affected by astrocytic APOE148,149.”
From Multifaceted roles of APOE in Alzheimer disease (2024) · cites this paper as [148]
The cited source says what the claim attributes to it.
In the citing paper
“reports of astrocyte-specific deletion of APOE reducing amyloid pathology and associated toxicity [19].”
From Astrocytic APOE3-Christchurch expression ameliorates brain amyloid-β pathology in 5xFAD mice (2026) · cites this paper as [19]
The cited source says what the claim attributes to it.
In the citing paper
“Knockout of human ApoE3 and ApoE4 in astrocytes of transgenic mice results in markedly decreased Aβ plaque pathology despite microglia continuing to produce ApoE [96].”
From ApoE lipoproteins in the central nervous system under homeostasis and role in Alzheimer’s disease and related disorders (2026) · cites this paper as [96]
The cited source says what the claim attributes to it.
In the citing paper
“Knockout of ApoE in astrocytes versus microglia has differing impacts on disease pathogenesis in mouse models of Aβ amyloidosis suggesting that ApoE produced from different cell types may differentially affect disease outcomes [96, 97].”
From ApoE lipoproteins in the central nervous system under homeostasis and role in Alzheimer’s disease and related disorders (2026) · cites this paper as [96]
The cited source says what the claim attributes to it.
In the citing paper
“Although there are very few true amyloid plaques in the absence of mouse apoE, there is greater neuritic dystrophy around the remaining plaques [96, 99].”
From ApoE lipoproteins in the central nervous system under homeostasis and role in Alzheimer’s disease and related disorders (2026) · cites this paper as [96]
The cited source says what the claim attributes to it.
In the citing paper
“Astrocytes account for the bulk of ApoE secretion under homeostatic conditions (14).”
From Lipidome and proteome of astrocyte and microglia ApoE lipoprotein reveal differences based on cell type and ApoE isoform (2026) · cites this paper as [14]
Self-check
Percentages, sums and reported differences re-computed from the paper’s own numbers.
The self-check needs the paper’s full text.
Citations
Cites
Corder, E. H., Saunders, A. M., Strittmatter, W. J., Schmechel, D. E., Gaskell, P. C., Small, G. W., Roses, A. D., Haines, J. L., & Pericak-Vance, M. A. (1993) · Science · doi:10.1126/science.8346443 · Cited by 9,429
A Unique Microglia Type Associated with Restricting Development of Alzheimer’s Disease
Keren-Shaul, H., Spinrad, A., Weiner, A., Matcovitch-Natan, O., Dvir-Szternfeld, R., Ulland, T. K., David, E., Baruch, K., Lara-Astaiso, D., Toth, B., et al. (2017) · Cell · doi:10.1016/j.cell.2017.05.018 · Cited by 5,493
Strittmatter, W. J., Saunders, A. M., Schmechel, D., Pericak-Vance, M., Enghild, J., Salvesen, G. S., & Roses, A. D. (1993) · Proceedings of the National Academy of Sciences · doi:10.1073/pnas.90.5.1977 · Cited by 4,268
Clinical and biomarker changes in dominantly inherited Alzheimer's disease
Bateman, R. J., Xiong, C., Benzinger, T. L. S., Fagan, A. M., Goate, A., Fox, N. C., Marcus, D. S., Cairns, N. J., Xie, X., Blazey, T. M., et al. (2012) · New England Journal of Medicine · doi:10.1056/nejmoa1202753 · Cited by 3,814
Self-citationAlzheimer Disease: An Update on Pathobiology and Treatment Strategies
Long, J. M., & Holtzman, D. M. (2019) · Cell · doi:10.1016/j.cell.2019.09.001 · Cited by 3,204
Self-citationKrasemann, S., Madore, C., Cialic, R., Baufeld, C., Calcagno, N., El Fatimy, R., Beckers, L., O’Loughlin, E., Xu, Y., Fanek, Z., et al. (2017) · Immunity · doi:10.1016/j.immuni.2017.08.008 · Cited by 2,979
Self-citationReactive astrocyte nomenclature, definitions, and future directions
Escartin, C., Galea, E., Lakatos, A., O’Callaghan, J. P., Petzold, G. C., Serrano-Pozo, A., Steinhäuser, C., Volterra, A., Carmignoto, G., Agarwal, A., et al. (2021) · Nature Neuroscience · doi:10.1038/s41593-020-00783-4 · Cited by 2,513 · cited 1×
“It will be important in future studies to utilize methods such as single cell RNA sequencing of astrocytes, to more fully explore the apoE isoform and sex-dependent changes in reactive astrogliosis that are present in different disease conditions, including in the presence of amyloid [76].”
Background2021 Alzheimer's disease facts and figures
Anonymous (2021) · Alzheimer s & Dementia · doi:10.1002/alz.12328 · Cited by 2,339
The role of apolipoprotein E in Alzheimer's disease
Kim, J., Basak, J. M., & Holtzman, D. M. (2009) · Neuron · doi:10.1016/j.neuron.2009.06.026 · Cited by 1,661
Self-citationPrevalence of Cerebral Amyloid Pathology in Persons Without Dementia: A Meta-analysis
Jansen, W. J., Ossenkoppele, R., Knol, D. L., Tijms, B. M., Scheltens, P., Verhey, F. R. J., Visser, P. J., Aalten, P., Aarsland, D., Alcolea, D., et al. (2015) · JAMA · doi:10.1001/jama.2015.4668 · Cited by 1,610
Research works printed but not linked: 1
- International AD, Guerchet M, Prince M. Numbers of people with dementia around the world. 2020.
Cited by
Sorted by citations
Microbiota–gut–brain axis and its therapeutic applications in neurodegenerative diseases
Loh, J. S., Mak, W. Q., Tan, L. K. S., Ng, C. X., Chan, H. H., Yeow, S. H., Foo, J. B., Ong, Y. S., How, C. W., & Khaw, K. Y. (2024) · Signal Transduction and Targeted Therapy · doi:10.1038/s41392-024-01743-1 · Cited by 1,193
ApoE in Alzheimer’s disease: pathophysiology and therapeutic strategies
Raulin, A.-C., Doss, S. V., Trottier, Z. A., Ikezu, T. C., Bu, G., & Liu, C.-C. (2022) · Molecular Neurodegeneration · doi:10.1186/s13024-022-00574-4 · Cited by 756
Astrocytes in human central nervous system diseases: a frontier for new therapies
Verkhratsky, A., Butt, A., Li, B., Illes, P., Zorec, R., Semyanov, A., Tang, Y., & Sofroniew, M. V. (2023) · Signal Transduction and Targeted Therapy · doi:10.1038/s41392-023-01628-9 · Cited by 428
Emerging roles of innate and adaptive immunity in Alzheimer’s disease
Chen, X., & Holtzman, D. M. (2022) · Immunity · doi:10.1016/j.immuni.2022.10.016 · Cited by 297
Self-citationThe gut microbiome in Alzheimer’s disease: what we know and what remains to be explored
Chandra, S., Sisodia, S. S., & Vassar, R. J. (2023) · Molecular Neurodegeneration · doi:10.1186/s13024-023-00595-7 · Cited by 278
Cell type‐specific roles of APOE4 in Alzheimer disease
Blumenfeld, J., Yip, O., Kim, M. J., & Huang, Y. (2024) · Nature Reviews Neuroscience · doi:10.1038/s41583-023-00776-9 · Cited by 202
Updates in Alzheimer's disease: from basic research to diagnosis and therapies
Liu, E., Zhang, Y., & Wang, J. (2024) · Translational Neurodegeneration · doi:10.1186/s40035-024-00432-x · Cited by 241
APOE4 impairs the microglial response in Alzheimer’s disease by inducing TGFβ-mediated checkpoints
Yin, Z., Rosenzweig, N., Kleemann, K. L., Zhang, X., Brandão, W., Margeta, M. A., Schroeder, C., Sivanathan, K. N., Silveira, S., Gauthier, C., et al. (2023) · Nature Immunology · doi:10.1038/s41590-023-01627-6 · Cited by 202
Self-citationMultifaceted roles of APOE in Alzheimer disease
Jackson, R. J., Hyman, B. T., & Serrano-Pozo, A. (2024) · Nature Reviews Neurology · doi:10.1038/s41582-024-00988-2 · Cited by 193
Anti-inflammatory clearance of amyloid-β by a chimeric Gas6 fusion protein
Jung, H., Lee, S. Y., Lim, S., Choi, H. R., Choi, Y., Kim, M., Kim, S., Lee, Y., Han, K. H., Chung, W., et al. (2022) · Nature Medicine · doi:10.1038/s41591-022-01926-9 · Cited by 91
Astrocyte-Mediated Neuroinflammation in Neurological Conditions
Zhao, Y., Huang, Y., Cao, Y., & Yang, J. H. (2024) · Biomolecules · doi:10.3390/biom14101204 · Cited by 106
Cholesterol Metabolism in Aging and Age-Related Disorders
Saher, G. (2023) · Annual Review of Neuroscience · doi:10.1146/annurev-neuro-091922-034237 · Cited by 88
Peripheral and central neuroimmune mechanisms in Alzheimer’s disease pathogenesis
Zhang, S., Gao, Y., Zhao, Y., Huang, T. Y., Zheng, Q., & Wang, X. (2025) · Molecular Neurodegeneration · doi:10.1186/s13024-025-00812-5 · Cited by 78
Gedam, M., Comerota, M. M., Propson, N. E., Chen, T., Jin, F., Wang, M. C., & Zheng, H. (2023) · Journal of Clinical Investigation · doi:10.1172/jci167501 · Cited by 74
Tian, Y., Zhao, M., Chen, Y., Yang, M., & Wang, Y. (2022) · Biomolecules · doi:10.3390/biom12060748 · Cited by 69
Anfray, A., Schaeffer, S., Hattori, Y., Santisteban, M. M., Casey, N., Wang, G., Strickland, M., Zhou, P., Holtzman, D. M., Anrather, J., et al. (2024) · Nature Neuroscience · doi:10.1038/s41593-024-01757-6 · Cited by 53
Self-citationReactive Astrocytes and Emerging Roles in Central Nervous System (CNS) Disorders
Liddelow, S. A., Olsen, M. L., & Sofroniew, M. V. (2024) · Cold Spring Harbor Perspectives in Biology · doi:10.1101/cshperspect.a041356 · Cited by 55
Li, Z., Yin, B., Zhang, S., Lan, Z., & Zhang, L. (2023) · European Journal of Medicinal Chemistry · doi:10.1016/j.ejmech.2023.115817 · Cited by 54
The role of glial autophagy in Alzheimer’s disease
Litwiniuk, A., Juszczak, G. R., Stankiewicz, A. M., & Urbańska, K. (2023) · Molecular Psychiatry · doi:10.1038/s41380-023-02242-5 · Cited by 54
Neurodegeneration cell per cell
Balusu, S., Praschberger, R., Lauwers, E., Strooper, B. D., & Verstreken, P. (2023) · Neuron · doi:10.1016/j.neuron.2023.01.016 · Cited by 53
Vance, J. M., Farrer, L. A., Huang, Y., Cruchaga, C., Hyman, B. T., Pericak‐Vance, M. A., Goate, A. M., Greicius, M. D., Griswold, A. J., Haines, J. L., et al. (2024) · Annals of Neurology · doi:10.1002/ana.26864 · Cited by 52
Self-citationZhang, X., Yuan, T., Chen, X., Liu, X., Hu, J., & Liu, Z. (2023) · Progress in Lipid Research · doi:10.1016/j.plipres.2023.101256 · Cited by 51
Alzheimer’s disease pathogenesis: standing at the crossroad of lipid metabolism and immune response
Wang, Z., Zhang, L., & Qin, C. (2025) · Molecular Neurodegeneration · doi:10.1186/s13024-025-00857-6 · Cited by 60
Ullah, R., & Lee, E. J. (2023) · Experimental Neurobiology · doi:10.5607/en23014 · Cited by 51
Revealing cell vulnerability in Alzheimer’s disease by single-cell transcriptomics
Saura, C. A., Deprada-Fernandez, Á., Capilla-López, M. D., & Parra‐Damas, A. (2022) · Seminars in Cell and Developmental Biology · doi:10.1016/j.semcdb.2022.05.007 · Cited by 48
Astrocyte and oligodendrocyte pathology in Alzheimer's disease
Ziar, R., Tesar, P. J., & Clayton, B. L. L. (2025) · Neurotherapeutics · doi:10.1016/j.neurot.2025.e00540 · Cited by 47
Xiong, M., Wang, C., Gratuze, M., Saadi, F., Bao, X., Bosch, M. E., Lee, C., Jiang, H., Serrano, J. R., Gonzales, E. R., et al. (2023) · Molecular Neurodegeneration · doi:10.1186/s13024-023-00610-x · Cited by 41
Self-citationRao, A. T., Chen, N., Kim, M. J., Blumenfeld, J. R., Yip, O., Liang, Z., Shostak, D. M., Hao, Y., Nelson, M. R., Koutsodendris, N., et al. (2024) · Cell stem cell · doi:10.1016/j.stem.2024.10.005 · Cited by 48
Astrocytes in Neurodegeneration: Inspiration From Genetics
Huang, J., Li, C., & Shang, H. (2022) · Frontiers in Neuroscience · doi:10.3389/fnins.2022.882316 · Cited by 40
Xiao, S., Liu, Y.-J., Wang, L., Sha, Z., Che, X., Yu, Z., & Lee, S. (2022) · Frontiers in Cellular Neuroscience · doi:10.3389/fncel.2022.875138 · Cited by 41
Liu, Y., Tan, Y., Zhang, Z., Li, H., Yi, M., Zhang, Z., Hui, S., & Peng, W. (2022) · Ageing Research Reviews · doi:10.1016/j.arr.2022.101831 · Cited by 34
Preman, P., Moechars, D., Fertan, E., Wolfs, L., Serneels, L., Shah, D., Lamote, J., Poovathingal, S., Snellinx, A., Mancuso, R., et al. (2024) · EMBO Molecular Medicine · doi:10.1038/s44321-024-00162-7 · Cited by 32
Zhang, X., Chen, C., & Liu, Y. (2024) · Alzheimer's Research & Therapy · doi:10.1186/s13195-024-01430-x · Cited by 34
Gut microbiota–astrocyte axis: new insights into age-related cognitive decline
Zhang, L., Wei, J., Liu, X., Li, D., Pang, X., Chen, F., Cao, H., & Lei, P. (2024) · Neural Regeneration Research · doi:10.4103/nrr.nrr-d-23-01776 · Cited by 28
St‐Pierre, M., VanderZwaag, J., Loewen, S. M., & Tremblay, M. (2022) · Frontiers in Cellular Neuroscience · doi:10.3389/fncel.2022.932572 · Cited by 27
Chen, K., Morizawa, Y. M., Nuriel, T., Al‐Dalahmah, O., Xie, Z., & Yang, G. (2025) · Neuron · doi:10.1016/j.neuron.2025.04.027 · Cited by 27
Li, F., Eteleeb, A. M., Buchser, W., Sohn, C., Wang, G., Xiong, C., Payne, P., McDade, E., Karch, C. M. M., Harari, O., et al. (2022) · Frontiers in Aging Neuroscience · doi:10.3389/fnagi.2022.935279 · Cited by 27
Johnson, N. R., Wang, A. C.-J., Coughlan, C. M., Sillau, S., Lucero, E., Viltz, L., Markham, N. E., Allen, C., Dhanasekaran, A. R., Chial, H. J., et al. (2022) · Alzheimer s Research & Therapy · doi:10.1186/s13195-022-01020-9 · Cited by 24
Kim, H., Kim, S., Cho, B., Shin, J., & Kim, J. (2022) · Translational Neurodegeneration · doi:10.1186/s40035-022-00319-9 · Cited by 22
Ding, Y., Palecek, S. P., & Shusta, E. V. (2024) · Fluids and Barriers of the CNS · doi:10.1186/s12987-024-00580-2 · Cited by 22
Asante, I., Louie, S. G., & Yassine, H. N. (2022) · Annals of the New York Academy of Sciences · doi:10.1111/nyas.14907 · Cited by 23
Zhao, Y., Guo, Q., Tian, J., Liu, W., & Wang, X. (2024) · Ageing Research Reviews · doi:10.1016/j.arr.2024.102596 · Cited by 23
Liu, Y., Meng, X.-K., Shao, W.-Z., Liu, Y.-Q., Tang, C., Deng, S.-S., Tang, C., Zheng, L., & Guo, W. (2024) · Neurochemical Research · doi:10.1007/s11064-024-04108-w · Cited by 22
Current insights into apolipoprotein E and the immune response in Alzheimer's disease
Lin, P. B., & Holtzman, D. M. (2024) · Immunological Reviews · doi:10.1111/imr.13414 · Cited by 19
Self-citationNew insights into innate immunity in Alzheimer’s disease: From APOE protective variants to therapies
Chen, Y., & Holtzman, D. M. (2024) · Trends in Immunology · doi:10.1016/j.it.2024.08.001 · Cited by 19
Self-citationGolden, L. R., Siano, D. S., Stephens, I. O., MacLean, S. M., Saito, K., Nolt, G. L., Funnell, J. L., Pallerla, A. V., Lee, S., Smith, C., et al. (2025) · Nature Neuroscience · doi:10.1038/s41593-025-02094-y · Cited by 18
Hu, H., Wan, S., Hu, Y., Wang, Q., Li, H., & Zhang, N. (2025) · Annals of Medicine · doi:10.1080/07853890.2024.2445194 · Cited by 20
Alzheimer’s disease: an axonal injury disease?
Liang, D., & Zhang, Z. (2023) · Frontiers in Aging Neuroscience · doi:10.3389/fnagi.2023.1264448 · Cited by 21
Zhang, W.-X., Yang, Y.-L., Yu, J., Jia, L., & Huang, H. (2025) · Biochemical and Biophysical Research Communications · doi:10.1016/j.bbrc.2025.152335 · Cited by 19
Tangles and Plaques: A deep dive into the pathological hallmarks of Alzheimer’s disease
Vanya, Kumari, S., Bagri, K., & Deshmukh, R. R. (2025) · Neuroscience · doi:10.1016/j.neuroscience.2025.10.050 · Cited by 18
The role of ADAM10 in astrocytes: Implications for Alzheimer’s disease
Elsworthy, R. J., Hill, E. J., Dunleavy, C., & Aldred, S. (2022) · Frontiers in Aging Neuroscience · doi:10.3389/fnagi.2022.1056507 · Cited by 17
Neuroimmune interactions and their roles in neurodegenerative diseases
Chen, B.-R., Wu, T., Chen, T.-H., & Wang, Y. (2023) · Fundamental Research · doi:10.1016/j.fmre.2023.04.002 · Cited by 18
G-protein coupled receptors in neuroinflammation, neuropharmacology, and therapeutics
Singh, A. P., Shadangi, S., & Rana, S. (2025) · Biochemical Pharmacology · doi:10.1016/j.bcp.2025.117301 · Cited by 16
Lou, T.-W., Tao, B., & Chen, M. (2023) · Neuroscience · doi:10.1016/j.neuroscience.2023.01.032 · Cited by 17
Wan, B., Lin, P., Wang, M., Zhong, J., Lü, P., Tang, X., Wang, L., Tang, F., Liang, Y., Liu, X., et al. (2023) · Frontiers in Nutrition · doi:10.3389/fnut.2023.1279721 · Cited by 15
Mao, S., Qiao, R., Wang, Q., Shen, L., Li, D., Huo, X., Wang, J., Liu, K., Chen, W., Zhu, T., et al. (2025) · MedComm · doi:10.1002/mco2.70329 · Cited by 17
Fluorescent Sensing Platforms for Detecting and Imaging the Biomarkers of Alzheimer’s Disease
Liu, X., Liu, Y., & Liu, Q. (2023) · Biosensors · doi:10.3390/bios13050515 · Cited by 13
Risk factors and predictive models in the progression from MCI to Alzheimer’s disease
Li, C., Wang, S., Xia, Y., Shi, F., Tang, L., Yang, Q., Feng, J., & Li, C. (2024) · Neuroscience · doi:10.1016/j.neuroscience.2024.11.056 · Cited by 12
Mettl3 regulates the pathogenesis of Alzheimer’s disease via fine-tuning Lingo2
Zhao, X., Ma, C., Sun, Q., Huang, X., Qu, W., Chen, Y., Liu, Z., Bao, A., Sun, B., Yang, Y., et al. (2025) · Molecular Psychiatry · doi:10.1038/s41380-025-02984-4 · Cited by 10
Fei, Z., Pan, B., Pei, R., Ye, S., Wang, Z., Ma, L., Zhang, R., Li, C., Du, X., & Cao, H. (2023) · The Journal of Prevention of Alzheimer s Disease · doi:10.14283/jpad.2023.56 · Cited by 11
Focused ultrasound‐mediated APOE4 knockdown in mouse brain
Zheng, K., Tsitsos, F. N., Batts, A. J., Ji, R., Nuriel, T., Konofagou, E. E., & Leong, K. W. (2025) · Alzheimer's & Dementia · doi:10.1002/alz.70464 · Cited by 8
Astrocytes as Therapeutic Targets in Neurodegenerative Disorders
Salas, I. H., Alfonso-Triguero, M., Castro, B. D., Elazar, N., Escartin, C., Akl, C. F., Hill, S. A., Quintana, F. J., & Arranz, A. M. (2025) · Journal of Neuroscience · doi:10.1523/jneurosci.1379-25.2025 · Cited by 10
Building in vitro models of the brain to understand the role ofAPOEin Alzheimer’s disease
Pinals, R. L., & Tsai, L. (2022) · Life Science Alliance · doi:10.26508/lsa.202201542 · Cited by 10
Fowler, C. G., Tarantino, M. I., Gillett, A. E., Muñiz, V., Anderson, M. A., Bonner, R. L., & Vichaya, E. G. (2025) · Brain Behavior and Immunity · doi:10.1016/j.bbi.2025.05.010 · Cited by 8
Recent advances in Alzheimer’s disease: From molecular mechanisms to therapeutic strategies
Rudman, M. D., Ulrich, J. D., & Holtzman, D. M. (2026) · Cell · doi:10.1016/j.cell.2026.06.006 · Cited by 12
Self-citationEndothelial Cell APOE3 Regulates Neurovascular, Neuronal, and Behavioral Function
Marottoli, F. M., Zhang, H., Flores-Barrera, E., de la Villarmois, E. A., Damen, F. C., Fernández, A. M. M. M., Blesson, H. V., Chaudhary, R., Nguyen, A. L., Nwokeji, A. E., et al. (2023) · Arteriosclerosis Thrombosis and Vascular Biology · doi:10.1161/atvbaha.123.319816 · Cited by 7
Strickland, M. R., Wang, Z., Golden, L. R., Wang, H., Lu, P., Ren, Y., Tabor, G. T., Zhao, N., Ulrich, J. D., Han, X., et al. (2026) · Journal of Lipid Research · doi:10.1016/j.jlr.2026.101000 · Cited by 8
Self-citationGrenon, M. B., Papavergi, M.-T., Bathini, P., Sadowski, M. J., & Lemere, C. A. (2024) · International Journal of Molecular Sciences · doi:10.3390/ijms25115754 · Cited by 7
The role of the gut microbiome in the regulation of astrocytes in Alzheimer's disease
Chandra, S., & Vassar, R. J. (2024) · Neurotherapeutics · doi:10.1016/j.neurot.2024.e00425 · Cited by 7
Astrocyte–Neuron Interactions in Alzheimer’s Disease
Muñoz‐Castro, C., & Serrano‐Pozo, A. (2024) · Advances in neurobiology · doi:10.1007/978-3-031-64839-7_14 · Cited by 7
Affaneh, A., Linden, A. K., Tunc‐Ozcan, E., Tsai, Y., Peng, C., & Kessler, J. A. (2024) · Annals of Neurology · doi:10.1002/ana.27149 · Cited by 7
APOE4 drives transcriptional heterogeneity and maladaptive immunometabolic responses of astrocytesPreprint
Lee, S., Williams, H. C., Gorman, A. A., Devanney, N. A., Harrison, D. A., Walsh, A. E., Goulding, D. S., Tuck, T., Schwartz, J. L., Zajac, D. J., et al. (2023) · bioRxiv (Cold Spring Harbor Laboratory) · doi:10.1101/2023.02.06.527204 · Cited by 7
Glial Regulation of Circuit Wiring, Firing, and Expiring in theDrosophilaCentral Nervous SystemPreprint
Coutinho‐Budd, J., Freeman, M. R., & Ackerman, S. D. (2024) · Cold Spring Harbor Perspectives in Biology · doi:10.1101/cshperspect.a041347 · Cited by 8
Ai, H., Zhang, S., Si, C., Liu, T., Zheng, X., Tian, X., & Bai, W. (2025) · Behavioral and Brain Functions · doi:10.1186/s12993-025-00285-y · Cited by 7
The emerging role of disulfidptosis in Alzheimer's disease
Zhou, Q., Zheng, N., Chen, Z., Xie, L., Yang, X., Sun, Q., Lin, J., Li, B., & Li, L. (2025) · European Journal of Pharmacology · doi:10.1016/j.ejphar.2025.178085 · Cited by 10
Mao, X., Wang, Y., Luan, Y., Wang, Y., Wang, J., Dai, W., Guan, Y., Huang, Q., Gunn, R. N., Ossenkoppele, R., et al. (2025) · Molecular Neurodegeneration · doi:10.1186/s13024-025-00906-0 · Cited by 9
APOEε4 alters ApoE and Fabp7 in frontal cortex white matter in prodromal Alzheimer's disease
Moreno‐Rodríguez, M., Perez, S. E., Malek‐Ahmadi, M. H., & Mufson, E. J. (2025) · Journal of Neuroinflammation · doi:10.1186/s12974-025-03349-y · Cited by 8
Astrocytes at the intersection of ageing, obesity, and neurodegeneration
Firth, W., Pye, K. R., & Potter, P. G. W. (2024) · Clinical Science · doi:10.1042/cs20230148 · Cited by 6
Zhang, J., Huang, Y., Chen, Y., Zhang, Y., Chen, J., Huang, Y., Zhong, H., He, H., Dai, X., Yan, X., et al. (2026) · Immunity · doi:10.1016/j.immuni.2026.03.007 · Cited by 6
Unraveling APOE4's Role in Alzheimer's Disease: Pathologies and Therapeutic Strategies
Tripathi, S., Sharma, Y., & Kumar, D. (2024) · Current Protein and Peptide Science · doi:10.2174/0113892037326839241014054430 · Cited by 5
Pluta, R. M., Kocki, J., Bogucki, J., Bogucka‐Kocka, A., & Czuczwar, S. J. (2024) · Journal of Alzheimer s Disease · doi:10.1177/13872877241303950 · Cited by 5
The role of lipid metabolism in cognitive impairment
Xu, M., Wang, L., Meng, Y., Kang, G., Jiang, Q., Yan, T., & Che, F. (2025) · Arquivos de Neuro-Psiquiatria · doi:10.1055/s-0044-1792097 · Cited by 5
Wei, H., Zhang, G., Xu, Y., Zhao, A., Zheng, Y., Shao, Y. W., Yang, L., Wang, J., & Jiang, X. (2025) · Phytomedicine · doi:10.1016/j.phymed.2025.157238 · Cited by 3
Zhang, R., Chen, D., Qin, Y., Han, H., & Yu, H. (2026) · BMC Medical Informatics and Decision Making · doi:10.1186/s12911-026-03387-3 · Cited by 3
Reduced Prefrontal-Thalamic Theta Flow During Working Memory Retrieval in APP/PS1 Mice
Zhang, S., Ai, H., Wang, J., Liu, T., Zheng, X., Tian, X., & Bai, W. (2024) · Journal of Alzheimer s Disease · doi:10.3233/jad-231078 · Cited by 3
Yuan, F., Tang, Y., Zheng, F., & Xie, Q. (2024) · Journal of Innate Immunity · doi:10.1159/000541542 · Cited by 3
Jhaldiyal, A., Kumari, M., Tripathi, T., Khan, R. H., Wang, J. L., Guttman, L. C., Biswas, D., Pasupuleti, A., Aggarwal, A., Pandya, S., et al. (2025) · bioRxiv (Cold Spring Harbor Laboratory) · doi:10.1101/2025.09.06.674313 · Cited by 3
ApoE expression across the CNS: Who, What, Where, When, and How (much)?
Nolt, G. L., Lucido, C. C., Smith, L. M., & Johnson, L. A. (2026) · Molecular Neurodegeneration Advances · doi:10.1186/s44477-026-00028-x · Cited by 2
Chen, J., Zhang, X., Chen, X., Yu, W., Jia, M., Zhu, L., Liu, Z., & Hu, J. (2025) · BMJ Open · doi:10.1136/bmjopen-2025-099591 · Cited by 2
Gyimesi, M., Okolicsanyi, R. K., & Haupt, L. M. (2025) · Biochemical Society Transactions · doi:10.1042/bst20253088 · Cited by 2
APOE4 drives maladaptive heterogeneity and immunometabolic responses of astrocytes
Lee, S., Williams, H. C., Gorman, A. A., Devanney, N. A., Harrison, D. A., Walsh, A. E., Goulding, D. S., Tuck, T., Schwartz, J. L., Zajac, D. J., et al. (2026) · Journal of Neuroinflammation · doi:10.1186/s12974-026-03698-2 · Cited by 8
Jhaldiyal, A., Kumari, M., Guttman, L. C., Tripathi, T., Khan, M. R., Wang, J., Biswas, D., Pasupuleti, A., Aggarwal, A., Pandya, S., et al. (2026) · Proceedings of the National Academy of Sciences · doi:10.1073/pnas.2525028123 · Cited by 6
Mitochondrial Fragmentation as a Key Driver of Neurodegenerative Disease
Chaplygina, A. V., & Zhdanova, D. (2025) · Current Alzheimer Research · doi:10.2174/0115672050366194250107050650 · Cited by 2
Vanherle, S., Janssen, A., de Ravé, M. G., Janssen, B., Lodder, C., Lucena, P. B., Kessels, S., Hardy, J., Vandeput, E., Wang, Y., et al. (2025) · Molecular Psychiatry · doi:10.1038/s41380-025-03036-7 · Cited by 4
Blumenfeld, J. R., Li, Y., Kim, M. J., Yip, O., Yao, L., Leon, S. D., Fulthorpe, R., Shostak, D. M., Platow, Z., Suan, K., et al. (2025) · bioRxiv (Cold Spring Harbor Laboratory) · doi:10.1101/2025.11.25.690488 · Cited by 2
Fei, Z., Pei, R., Pan, B., Ye, S., Zhang, R., Ma, L., Wang, Z., Li, C., Du, X., & Cao, H. (2023) · International Journal of Molecular Sciences · doi:10.3390/ijms24065549 · Cited by 1
N-Alkylamino Stilbene Compounds as Amyloid β Inhibitors for Alzheimer’s Disease Research
Gutiérrez, C., Sun, L., Huang, Y., Gui, K., Terpstra, K., & Mirica, L. M. (2025) · Molecules · doi:10.3390/molecules30112471 · Cited by 1
Francia, M., Ramesh, N., Boltz, T. A., Bot, M. H. M., van der Flier, W. M., Visser, P. J., van der Lee, S. J., Teunissen, C. E., Pijnenburg, Y. A. L., den Braber, A., et al. (2025) · Journal of Alzheimer s Disease · doi:10.1177/13872877251389924 · Cited by 2
Zeng, Y., Cook, N., Yang, C., Sivasankaran, S. K., Fujita, M., Gardell, Z. A., Guen, Y. L., Shigemizu, D., Ozaki, K., Morizono, T., et al. (2026) · Alzheimer s & Dementia · doi:10.1002/alz.71552 · Cited by 2
Pluta, R. M., Ułamek-Kozioł, M., Kocki, J., Bogucka‐Kocka, A., Bogucki, J., & Czuczwar, S. J. (2025) · International Journal of Molecular Sciences · doi:10.3390/ijms27010326 · Cited by 1
Metadata
- Authors
- Mahan, T. E., Wang, C., Bao, X., Choudhury, A., Ulrich, J. D., & Holtzman, D. M.
- Affiliations
- Washington University in St. Louis (US)
- Corresponding author
- Holtzman, David M.
- Venue
- Molecular Neurodegeneration
- Published
- 2022-02-02
- Volume
- 17
- Issue
- 1
- Pages
- 13-13
- ISSN
- 1750-1326 (ISSN-L)
- PMC
- PMC8811969
- OpenAlex
- W4210382695
- Cited by
- 134
- References
- 87
- Citations by year
- 2026: 19 · 2025: 35 · 2024: 31 · 2023: 29 · 2022: 20
- FWCI
- 17.78
- Type
- journal article
- Language
- en
- Open access
- gold
- doi.org
- Locations
- Molecular Neurodegeneration (publishedVersion, cc-by)
- PubMed Central (publishedVersion, cc-by)
- PubMed (publishedVersion)
- Digital Commons@Becker (Washington University School of Medicine) (submittedVersion, cc-by)
- DOAJ (DOAJ: Directory of Open Access Journals) (submittedVersion, cc-by-sa)
- Funders
- cure alzheimer's fund
- jpb foundation
- national institute of neurological disorders and stroke (NS090932)
- national institute on aging (AG047644)
- Topics
- Life Sciences › Neuroscience › Cellular and Molecular Neuroscience › Alzheimer's disease research and treatments
- Life Sciences › Neuroscience › Neurology › Neuroinflammation and Neurodegeneration Mechanisms
- Health Sciences › Medicine › Psychiatry and Mental health › Dementia and Cognitive Impairment Research
- Keywords
- apolipoprotein E, astrocytes, APOE3, APOE ε4, amyloid-beta, amyloid plaques, Alzheimer's disease, APP/PS1 mice, microglial activation, Dectin-1, glial fibrillary acidic protein, neuritic dystrophy
- MeSH terms
- Alzheimer Disease, Amyloidosis, Animals, Astrocytes, Female, Mice, Transgenic, Amyloid beta-Peptides, Amyloid beta-Protein Precursor, Mice, Apolipoprotein E3, Apolipoprotein E4, Plaque, Amyloid
About these checks
Registry, retraction, Cites and statistics results are computed, not judged, with one exception: a printed reference that no index lists is read once by a model before it counts as a citation error. Claims are extracted by a model and kept only when their quote appears verbatim in the text; each cited source is then checked, with a model’s help, for whether it says what the claim relies on. Those verdicts can be wrong — read the claim’s quote and the cited source before relying on one.
Statistics and arithmetic are recomputed, not judged.
Confidence bands are shown only for fields calibrated on our annotated test set. None is calibrated yet, so no band is shown.
What counts as a claim ›How we measure confidence ›How we check this ›
Are you an author, or do you see a problem with this page? Request a review
