

The DOI matches its Crossref record; 69 of the 69 references it cites were found in a registry or an index.
Allele-specific binding of ZFP57 in the epigenetic regulation of imprinted and non-imprinted monoallelic expression
Open accessAbstract
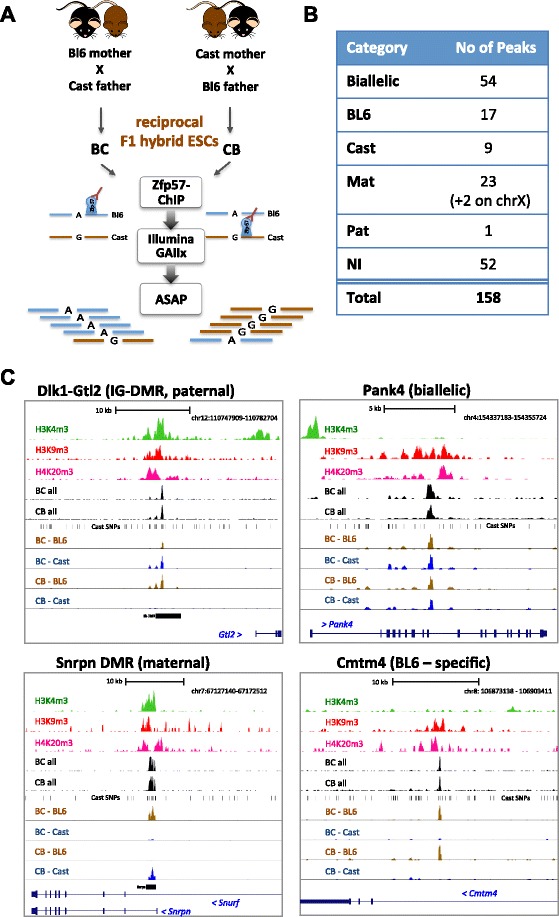
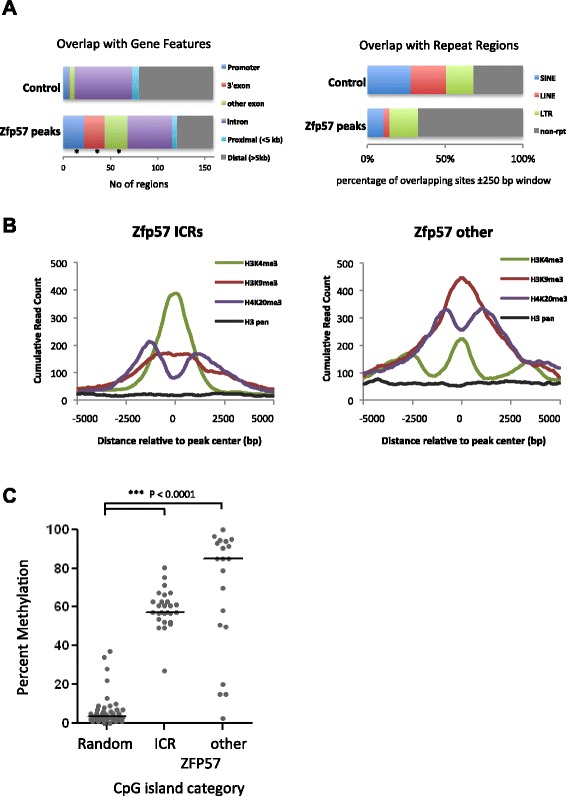
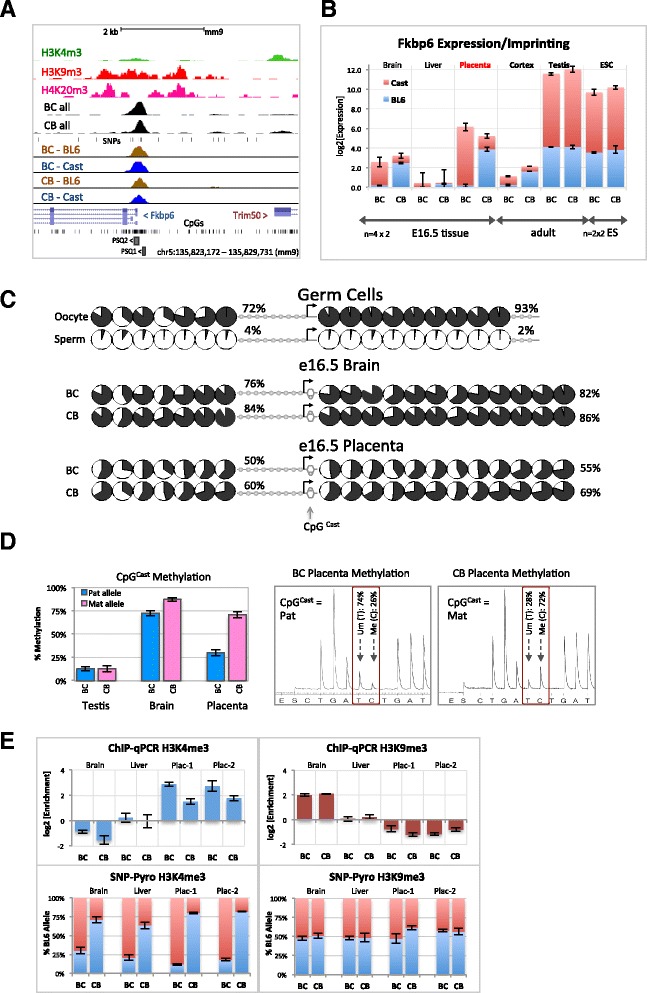
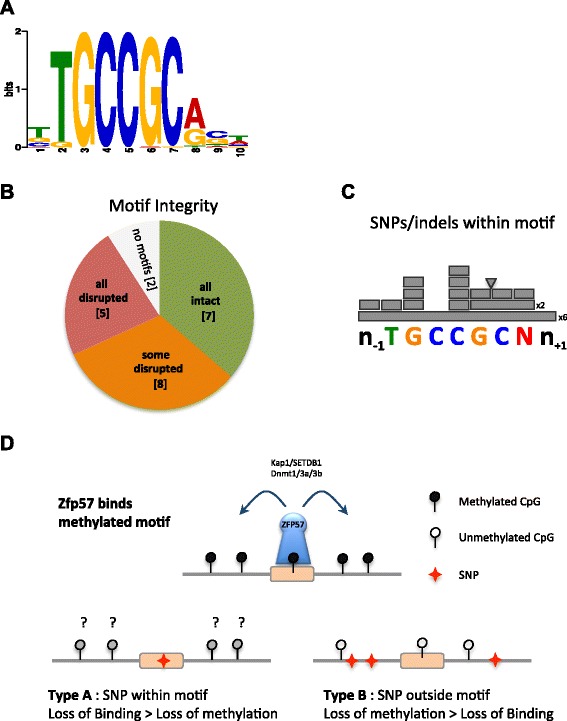
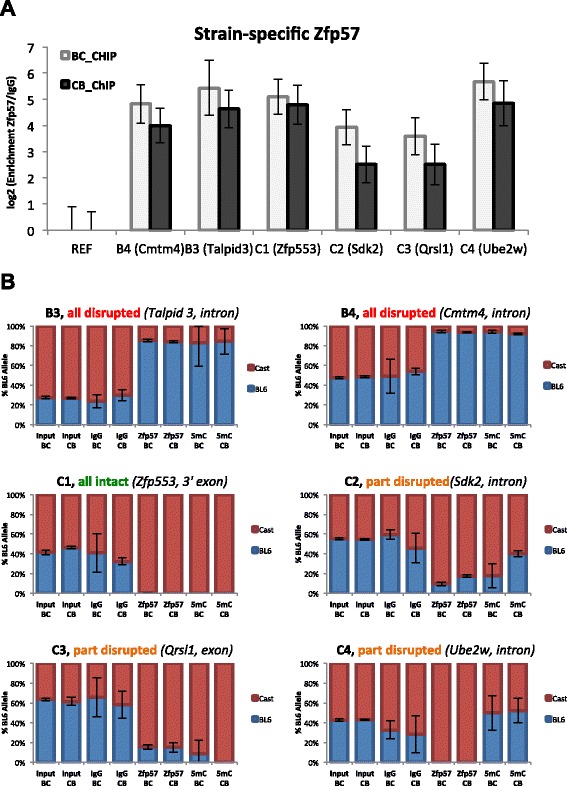
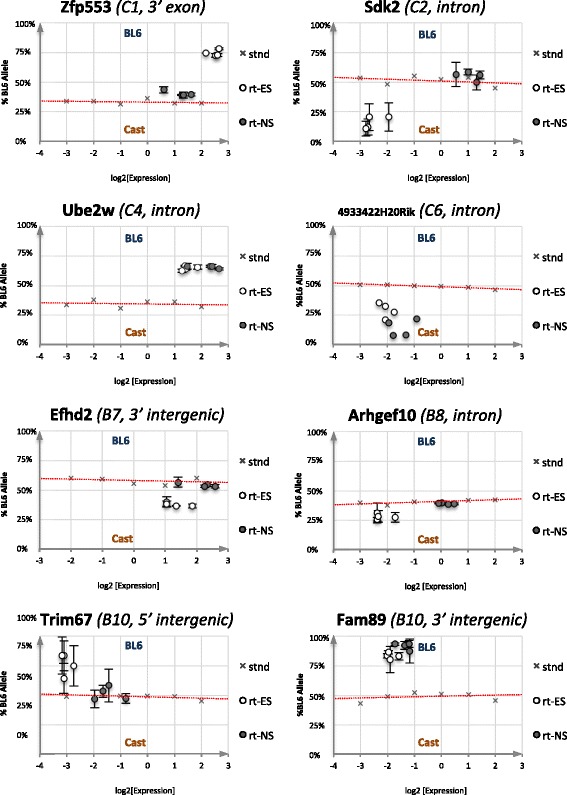
Background: Selective maintenance of genomic epigenetic imprints during pre-implantation development is required for parental origin-specific expression of imprinted genes. The Kruppel-like zinc finger protein ZFP57 acts as a factor necessary for maintaining the DNA methylation memory at multiple imprinting control regions in early mouse embryos and embryonic stem (ES) cells. Maternal-zygotic deletion of ZFP57 in mice presents a highly penetrant phenotype with no animals surviving to birth. Additionally, several cases of human transient neonatal diabetes are associated with somatic mutations in the ZFP57 coding sequence. Results: Here, we comprehensively map sequence-specific ZFP57 binding sites in an allele-specific manner using hybrid ES cell lines from reciprocal crosses between C57BL/6J and Cast/EiJ mice, assigning allele specificity to approximately two-thirds of all binding sites. While half of these are biallelic and include endogenous retrovirus (ERV) targets, the rest show monoallelic binding based either on parental origin or on genetic background of the allele. Parental-origin allele-specific binding is methylation-dependent and maps only to imprinting control differentially methylated regions (DMRs) established in the germline. We identify a novel imprinted gene, Fkbp6, which has a critical function in mouse male germ cell development. Genetic background-specific sequence differences also influence ZFP57 binding, as genetic variation that disrupts the consensus binding motif and its methylation is often associated with monoallelic expression of neighboring genes. Conclusions: The work described here uncovers further roles for ZFP57-mediated regulation of genomic imprinting and identifies a novel mechanism for genetically determined monoallelic gene expression.
Overview
The claims and statistics of this paper haven’t been checked yet.
Run the check — free, no account needed. It reads the open-access text and checks the sources it cites.
Integrity signals
Registry
Cites
Statistics
Figures
Verification
Claims the paper makes
The claims and statistics of this paper haven’t been checked yet.
Run the check — free, no account needed. It reads the open-access text and checks the sources it cites.
Claims other papers make about this one
Each is checked against this paper’s own text: does it say what the citing paper says it does?
The source backs part of the claim, not all of it — or backs it for a different population, condition or comparison.
In the citing paper
“Alignments to an N-masked reference genome were performed for reciprocal crosses between Black 6 and Cast/EiJ mice using Bowtie 2, followed by SNPsplit sorting. This process was able to identify allele-specific binding of ZFP57 to several different imprinting control regions in a parental origin-specific manner, exemplified for the SNRPN locus in Figure 2.”
From SNPsplit: Allele-specific splitting of alignments between genomes with known SNP genotypes (2016) · cites this paper as [17]
Experimental — accuracy not yet measuredThe cited source says what the claim attributes to it.
In the citing paper
“The binding of ZFB57 is methylation dependent and can be found exclusively on the maternal allele (genetic background of mother in forward cross: Black 6; mother in reverse cross: Cast).”
From SNPsplit: Allele-specific splitting of alignments between genomes with known SNP genotypes (2016) · cites this paper as [17]
In the citing paper
“ZFP57 binding sites were mapped in hybrid ES cells, and ZFP57 was found to interact with the methylated parental-origin allele60.”
From Transcription factors as readers and effectors of DNA methylation (2016) · cites this paper as [60]
Self-check
Percentages, sums and reported differences re-computed from the paper’s own numbers.
The self-check needs the paper’s full text.
Citations
Cites
Primer3 on the WWW for General Users and for Biologist Programmers
Rozen, S., & Skaletsky, H. (2003) · Humana Press eBooks · doi:10.1385/1-59259-192-2:365 · Cited by 15,068
Genome-wide maps of chromatin state in pluripotent and lineage-committed cells
Mikkelsen, T. S., Ku, M., Jaffe, D. B., Issac, B., Lieberman, E., Giannoukos, G., Alvarez, P., Brockman, W., Kim, T.-K., Koche, R. P., et al. (2007) · Nature · doi:10.1038/nature06008 · Cited by 4,129
The ground state of embryonic stem cell self-renewal
Ying, Q.-L., Wray, J., Nichols, J., Batlle-Morera, L., Doble, B., Woodgett, J., Cohen, P., & Smith, A. (2008) · Nature · doi:10.1038/nature06968 · Cited by 3,442
Genome-scale DNA methylation maps of pluripotent and differentiated cells
Meissner, A., Mikkelsen, T. S., Gu, H., Wernig, M., Hanna, J., Sivachenko, A., Zhang, X., Bernstein, B. E., Nusbaum, C., Jaffe, D. B., et al. (2008) · Nature · doi:10.1038/nature07107 · Cited by 2,536
Mouse genomic variation and its effect on phenotypes and gene regulation.
Keane, T. M., Goodstadt, L., Danecek, P., White, M. A., Wong, K., Yalcin, B., Heger, A., Agam, A., Slater, G., Goodson, M., et al. (2011) · Nature · doi:10.1038/nature10413 · Cited by 1,580
Conversion of embryonic stem cells into neuroectodermal precursors in adherent monoculture
Ying, Q.-L., Stavridis, M., Griffiths, D., Li, M., & Smith, A. (2003) · Nature Biotechnology · doi:10.1038/nbt780 · Cited by 1,504
Cassidy, S. B., Schwartz, S., Miller, J. L., & Driscoll, D. J. (2012) · Genetics in Medicine · doi:10.1038/gim.0b013e31822bead0 · Cited by 1,452
A unique regulatory phase of DNA methylation in the early mammalian embryo
Smith, Z. D., Chan, M. M., Mikkelsen, T. S., Gu, H., Gnirke, A., Regev, A., & Meissner, A. (2012) · Nature · doi:10.1038/nature10960 · Cited by 1,005
Niche-Independent Symmetrical Self-Renewal of a Mammalian Tissue Stem Cell
Conti, L., Pollard, S. M., Gorba, T., Reitano, E., Toselli, M., Biella, G. R., Sun, Y., Sanzone, S., Ying, Q., Cattaneo, E. F., et al. (2005) · PLoS Biology · doi:10.1371/journal.pbio.0030283 · Cited by 876
KAP1 controls endogenous retroviruses in embryonic stem cells
Rowe, H. M., Jakobsson, J., Mesnard, D., Rougemont, J., Reynard, S., Aktas, T., Maillard, P. V., Layard-Liesching, H., Verp, S., Marquis, J., et al. (2010) · Nature · doi:10.1038/nature08674 · Cited by 874
Genomic imprinting: the emergence of an epigenetic paradigm
Ferguson-Smith, A. C. (2011) · Nature Reviews Genetics · doi:10.1038/nrg3032 · Cited by 838
Self-citationDynamic CpG island methylation landscape in oocytes and preimplantation embryos
Smallwood, S. A., Tomizawa, S.-I., Krueger, F., Ruf, N., Carli, N., Segonds-Pichon, A., Sato, S., Hata, K., Andrews, S., & Kelsey, G. (2011) · Nature Genetics · doi:10.1038/ng.864 · Cited by 723
Self-citationThorvaldsen, J. L., Duran, K. L., & Bartolomei, M. S. (1998) · Genes & Development · doi:10.1101/gad.12.23.3693 · Cited by 661
A Maternal-Zygotic Effect Gene, Zfp57, Maintains Both Maternal and Paternal Imprints
Li, X., Ito, M., Zhou, F., Youngson, N. A., Zuo, X., Leder, P., & Ferguson‐Smith, A. C. (2008) · Developmental Cell · doi:10.1016/j.devcel.2008.08.014 · Cited by 647
Self-citationPGC7/Stella protects against DNA demethylation in early embryogenesis
Nakamura, T., Arai, Y., Umehara, H., Masuhara, M., Kimura, T., Taniguchi, H., Sekimoto, T., Ikawa, M., Yoneda, Y., Okabe, M., et al. (2006) · Nature Cell Biology · doi:10.1038/ncb1519 · Cited by 610
Quenneville, S., Verde, G., Corsinotti, A., Kapopoulou, A., Jakobsson, J., Offner, S., Baglivo, I., Pedone, P. V., Grimaldi, G., Riccio, A., et al. (2011) · Molecular Cell · doi:10.1016/j.molcel.2011.08.032 · Cited by 606
High-Resolution Analysis of Parent-of-Origin Allelic Expression in the Mouse Brain
Gregg, C., Zhang, J., Weissbourd, B., Luo, S., Schroth, G. P., Haig, D., & Dulac, C. (2010) · Science · doi:10.1126/science.1190830 · Cited by 591
Imprinted expression of the Igf2r gene depends on an intronic CpG island
Wutz, A., Smrzka, O. W., Schweifer, N., Schellander, K., Wagner, E. F., & Barlow, D. P. (1997) · Nature · doi:10.1038/39631 · Cited by 590
Kobayashi, H., Sakurai, T., Imai, M., Takahashi, N., Fukuda, A., Obata, Y., Sato, S., Nakabayashi, K., Hata, K., Sotomaru, Y., et al. (2012) · PLoS Genetics · doi:10.1371/journal.pgen.1002440 · Cited by 558
Xie, W., Barr, C. L., Kim, A., Yue, F., Lee, A. Y., Eubanks, J., Dempster, E. L., & Ren, B. (2012) · Cell · doi:10.1016/j.cell.2011.12.035 · Cited by 543
Mackay, D., Callaway, J. L. A., Marks, S. M., White, H., Acerini, C. L., Boonen, S. E., Dayanıklı, P., Firth, H. V., Goodship, J. A., Haemers, A. P., et al. (2008) · Nature Genetics · doi:10.1038/ng.187 · Cited by 527
DNA Damage ResponsePreprint
Giglia‐Mari, G., Zotter, A., & Vermeulen, W. (2010) · Cold Spring Harbor Perspectives in Biology · doi:10.1101/cshperspect.a000745 · Cited by 525
Bartolomei, M. S., & Ferguson-Smith, A. C. (2011) · Cold Spring Harbor Perspectives in Biology · doi:10.1101/cshperspect.a002592 · Cited by 518 · cited 1×
“Genomic imprinting is a mechanism of gene regulation occurring in eutherian mammals and to a lesser extent marsupials [1–3].”
BackgroundSelf-citationLin, S., Youngson, N. A., Takada, S., Seitz, H., Reik, W., Paulsen, M., Cavaillé, J., & Ferguson‐Smith, A. C. (2003) · Nature Genetics · doi:10.1038/ng1233 · Cited by 480
Self-citationRegional loss of imprinting and growth deficiency in mice with a targeted deletion of KvDMR1
Fitzpatrick, G. V., Soloway, P. D., & Higgins, M. J. (2002) · Nature Genetics · doi:10.1038/ng988 · Cited by 467
Allele-specific methylation is prevalent and is contributed by CpG-SNPs in the human genome
Shoemaker, R., Deng, J., Wang, W., & Zhang, K. (2010) · Genome Research · doi:10.1101/gr.104695.109 · Cited by 380
Transitions in histone acetylation reveal boundaries of three separately regulated neighboring loci
Litt, M., Simpson, M., Targa, F. R., Prioleau, M., & Felsenfeld, G. (2001) · The EMBO Journal · doi:10.1093/emboj/20.9.2224 · Cited by 361
Prader–Willi syndrome and Angelman syndrome
Buiting, K. (2010) · American Journal of Medical Genetics Part C: Seminars in Medical Genetics · doi:10.1002/ajmg.c.30273 · Cited by 336
Trim28 Is Required for Epigenetic Stability During Mouse Oocyte to Embryo Transition
Messerschmidt, D. M., de Vries, W. N., Ito, M., Solter, D., Ferguson‐Smith, A. C., & Knowles, B. B. (2012) · Science · doi:10.1126/science.1216154 · Cited by 331
Self-citationA mouse model for Prader-Willi syndrome imprinting-centre mutations
Yang, T., Adamson, T. E., Resnick, J. L., Leff, S. E., Wevrick, R., Francke, U., Jenkins, N. A., Copeland, N. G., & Brannan, C. I. (1998) · Nature Genetics · doi:10.1038/ng0598-25 · Cited by 296
The imprinted gene and parent-of-origin effect database
Morison, I. M. (2001) · Nucleic Acids Research · doi:10.1093/nar/29.1.275 · Cited by 260
Allelic Skewing of DNA Methylation Is Widespread across the Genome
Schalkwyk, L. C., Meaburn, E. L., Smith, R. G., Dempster, E. L., Jeffries, A. R., Davies, M. N., Plomin, R. J., & Mill, J. S. (2010) · The American Journal of Human Genetics · doi:10.1016/j.ajhg.2010.01.014 · Cited by 255
Tomizawa, S.-I., Kobayashi, H., Watanabe, T., Andrews, S., Hata, K., Kelsey, G., & Sasaki, H. (2011) · Development · doi:10.1242/dev.061416 · Cited by 253
The study of eQTL variations by RNA-seq: from SNPs to phenotypes
Majewski, J., & Pastinen, T. (2011) · Trends in Genetics · doi:10.1016/j.tig.2010.10.006 · Cited by 232
Jurado, L. A. P., Peoples, R., Kaplan, P. B., Hamel, B. C. J., & Francke, U. (1996) · PubMed Central · Cited by 231
Critical Evaluation of Imprinted Gene Expression by RNA–Seq: A New Perspective
DeVeale, B., van der Kooy, D., & Babak, T. (2012) · PLoS Genetics · doi:10.1371/journal.pgen.1002600 · Cited by 223
Essential Role of Fkbp6 in Male Fertility and Homologous Chromosome Pairing in Meiosis
Crackower, M. A., Kolas, N. K., Noguchi, J., Sarao, R., Kikuchi, K., Kaneko, H., Kobayashi, E., Kawai, Y., Kozieradzki, I., Landers, R., et al. (2003) · Science · doi:10.1126/science.1083022 · Cited by 211
Uniparental disomy and human disease: An overview
Yamazawa, K., Ogata, T., & Ferguson‐Smith, A. C. (2010) · American Journal of Medical Genetics Part C Seminars in Medical Genetics · doi:10.1002/ajmg.c.30270 · Cited by 208
Self-citationWilliamson, C. M., Turner, M. D., Ball, S. T., Nottingham, W. T., Glenister, P. H., Fray, M., Tymowska‐Lalanne, Z., Plagge, A., Powles-Glover, N. S., Kelsey, G., et al. (2006) · Nature Genetics · doi:10.1038/ng1731 · Cited by 196
Rowe, H. M., Kapopoulou, A., Corsinotti, A., Fasching, L., Macfarlan, T. S., Tarabay, Y., Viville, S., Jakobsson, J., Pfaff, S. L., & Trono, D. (2012) · Genome Research · doi:10.1101/gr.147678.112 · Cited by 190
Zuo, X., Sheng, J., Lau, H.-T., McDonald, C. M., Andrade, M., Cullen, D. E., Bell, F. T., Iacovino, M., Kyba, M., Xu, G., et al. (2011) · Journal of Biological Chemistry · doi:10.1074/jbc.m111.322644 · Cited by 189
Extensive compensatory cis-trans regulation in the evolution of mouse gene expressionPreprint
Gonçalves, Â., Leigh-Brown, S., Thybert, D., Stefflova, K., Turro, E., Flicek, P., Brāzma, A., Odom, D. T., & Marioni, J. C. (2012) · Genome Research · doi:10.1101/gr.142281.112 · Cited by 182
Genome-Wide Analysis of KAP1 Binding Suggests Autoregulation of KRAB-ZNFs
O'Geen, H., Squazzo, S. L., Iyengar, S., Blahnik, K., Rinn, J. L., Chang, H. Y., Green, R., & Farnham, P. J. (2007) · PLoS Genetics · doi:10.1371/journal.pgen.0030089 · Cited by 178
BioMart Central Portal: an open database network for the biological community
Guberman, J. M., Ai, J., Arnaiz, O., Baran, J., Blake, A., Baldock, R., Chelala, C., Croft, D. W., Cros, A. F., Cutts, R. J., et al. (2011) · Database · doi:10.1093/database/bar041 · Cited by 162
A Novel Human Gene,WSTF,Is Deleted in Williams Syndrome
Lu, X., Meng, X., Morris, C. A., & Keating, M. T. (1998) · Genomics · doi:10.1006/geno.1998.5578 · Cited by 160
Proudhon, C., Duffié, R., Ajjan, S., Cowley, M., Iranzo, J., Carbajosa, G., Saadeh, H., Holland, M. L., Oakey, R. J., Rakyan, V. K., et al. (2012) · Molecular Cell · doi:10.1016/j.molcel.2012.07.010 · Cited by 154
Single-Cell DNA-Methylation Analysis Reveals Epigenetic Chimerism in Preimplantation Embryos
Lorthongpanich, C., Cheow, L. F., Balu, S., Quake, S. R., Knowles, B. B., Burkholder, W. F., Solter, D., & Messerschmidt, D. M. (2013) · Science · doi:10.1126/science.1240617 · Cited by 154
Genomic imprinting in mammals: its life cycle, molecular mechanisms and reprogramming
Li, Y., & Sasaki, H. (2011) · Cell Research · doi:10.1038/cr.2011.15 · Cited by 145
A Role for Fkbp6 and the Chaperone Machinery in piRNA Amplification and Transposon Silencing
Xiol, J., Cora, E., Koglgruber, R., Chuma, S., Subramanian, S. L., Hosokawa, M., Reuter, M., Yang, Z., Berninger, P., Palencia, A., et al. (2012) · Molecular Cell · doi:10.1016/j.molcel.2012.07.019 · Cited by 140
Henckel, A., Nakabayashi, K., Sanz, L. A., Feil, R., Hata, K., & Arnaúd, P. (2009) · Human Molecular Genetics · doi:10.1093/hmg/ddp277 · Cited by 138
An atomic model of Zfp57 recognition of CpG methylation within a specific DNA sequencePreprint
Liu, Y., Toh, H., Sasaki, H., Zhang, X., & Cheng, X. (2012) · Genes & Development · doi:10.1101/gad.202200.112 · Cited by 128
Genomic imprinting and human disease
Hirasawa, R., & Feil, R. (2010) · Essays in Biochemistry · doi:10.1042/bse0480187 · Cited by 110
Allele-specific DNA methylation in mouse strains is mainly determined by cis-acting sequencesPreprint
Schilling, E., Chartouni, C. E., & Rehli, M. (2009) · Genome Research · doi:10.1101/gr.095562.109 · Cited by 102
Tomizawa, S.-I., & Sasaki, H. (2012) · Journal of Human Genetics · doi:10.1038/jhg.2011.151 · Cited by 97
Imprinted Gene Dosage Is Critical for the Transition to Independent Life
Charalambous, M., Ferrón, S. R., da Rocha, S. T., Murray, A. J., Rowland, T., Ito, M., Schuster-Gossler, K., Hernandez, A., & Ferguson‐Smith, A. C. (2012) · Cell Metabolism · doi:10.1016/j.cmet.2012.01.006 · Cited by 94
Self-citationThe Gpr1/Zdbf2 locus provides new paradigms for transient and dynamic genomic imprinting in mammalsPreprint
Duffié, R., Ajjan, S., Greenberg, M., Zamudio, N., Escamilla-Del-Arenal, M., Iranzo, J., Okamoto, I., Barbaux, S., Fauque, P., & Bourc’his, D. (2014) · Genes & Development · doi:10.1101/gad.232058.113 · Cited by 89
A Novel Human GeneFKBP6Is Deleted in Williams Syndrome
Meng, X., Lu, X., Morris, C. A., & Keating, M. T. (1998) · Genomics · doi:10.1006/geno.1998.5412 · Cited by 83
Distinguishing epigenetic marks of developmental and imprinting regulation
McEwen, K. R., & Ferguson‐Smith, A. C. (2010) · Epigenetics & Chromatin · doi:10.1186/1756-8935-3-2 · Cited by 80
Self-citationKobayashi, H., Yamada, K. H., Morita, S., Hiura, H., Fukuda, A., Kagami, M., Ogata, T., Hata, K., Sotomaru, Y., & Kono, T. (2009) · Genomics · doi:10.1016/j.ygeno.2008.12.012 · Cited by 67
Methylation dynamics of IG-DMR and Gtl2-DMR during murine embryonic and placental development
Sato, S., Yoshida, W., Soejima, H., Nakabayashi, K., & Hata, K. (2011) · Genomics · doi:10.1016/j.ygeno.2011.05.003 · Cited by 57
Hiura, H., Sugawara, A., Ogawa, H., John, R. M., Miyauchi, N., Miyanari, Y., Horiike, T., Li, Y., Yaegashi, N., Sasaki, H., et al. (2010) · Nucleic Acids Research · doi:10.1093/nar/gkq200 · Cited by 51
Chromosome-Wide Analysis of Parental Allele-Specific Chromatin and DNA Methylation
Singh, P., Wu, X., Lee, D.-H., Li, A. X., Rauch, T. A., Pfeifer, G. P., Mann, J. R., & Szabó, P. E. (2011) · Molecular and Cellular Biology · doi:10.1128/mcb.00961-10 · Cited by 47
Hiura, H., Sugawara, A., Ogawa, H., John, R. M., Miyauchi, N., Miyanari, Y., Horiike, T., Li, Y., Yaegashi, N., Sasaki, H., et al. (2014) · Nucleic Acids Research · doi:10.1093/nar/gku624 · Cited by 44
Proteins involved in establishment and maintenance of imprinted methylation marks
Strogantsev, R., & Ferguson‐Smith, A. C. (2012) · Briefings in Functional Genomics · doi:10.1093/bfgp/els018 · Cited by 43
Self-citationStatus of Genomic Imprinting in Epigenetically Distinct Pluripotent Stem Cells
Sun, B., Ito, M., Mendjan, S., Ito, Y., Brons, I. G. M., Murrell, A., Vallier, L., Ferguson‐Smith, A. C., & Pedersen, R. A. (2011) · Stem Cells · doi:10.1002/stem.793 · Cited by 42
Self-citationKobayashi, H., Sakurai, T., Sato, S., Nakabayashi, K., Hata, K., & Kono, T. (2012) · FEBS Letters · doi:10.1016/j.febslet.2012.01.059 · Cited by 39
Dowben, R. M., Gaffey, A., & Lynch, P. M. (1968) · FEBS Letters · doi:10.1016/0014-5793(68)80083-3 · Cited by 31
Takikawa, S., Wang, X., Ray, C., Vakulenko, M., Bell, F. T., & Li, X. (2013) · Epigenetics · doi:10.4161/epi.26544 · Cited by 31
AUF1/HnRNP D RNA Binding Protein Functions in Telomere Maintenance
Chen, L., & Lingner, J. (2012) · Molecular Cell · doi:10.1016/j.molcel.2012.06.031 · Cited by 27
Cited by
Sorted by citations
The diverse roles of DNA methylation in mammalian development and disease
Greenberg, M., & Bourc’his, D. (2019) · Nature Reviews Molecular Cell Biology · doi:10.1038/s41580-019-0159-6 · Cited by 2,272
Kosicki, M., Tomberg, K., & Bradley, A. (2018) · Nature Biotechnology · doi:10.1038/nbt.4192 · Cited by 1,883
Transcription factors as readers and effectors of DNA methylation
Zhu, H., Wang, G., & Qian, J. (2016) · Nature Reviews Genetics · doi:10.1038/nrg.2016.83 · Cited by 649
Genomic imprinting disorders: lessons on how genome, epigenome and environment interact
Monk, D., Mackay, D., Eggermann, T., Maher, E. R., & Riccio, A. (2019) · Nature Reviews Genetics · doi:10.1038/s41576-018-0092-0 · Cited by 456
Ecco, G., Imbeault, M., & Trono, D. (2017) · Development · doi:10.1242/dev.132605 · Cited by 413
Metadata
- Authors
- Strogantsev, R., Krueger, F., Yamazawa, K., Shi, H., Gould, P., Goldman-Roberts, M., McEwen, K., Sun, B., Pedersen, R., & Ferguson-Smith, A. C.
- Affiliations
- Babraham Institute (GB)
- University of Cambridge (GB)
- Venue
- Genome Biology
- Published
- 2015-05-30
- Volume
- 16
- Issue
- 1
- Pages
- 112-112
- ISSN
- 1465-6906 (ISSN-L)
- PMC
- PMC4491874
- OpenAlex
- W2098398752
- Cited by
- 152
- References
- 69
- Citations by year
- 2026: 11 · 2025: 8 · 2024: 4 · 2023: 11 · 2022: 24 · 2021: 8 · 2020: 15 · 2019: 22 · 2018: 12 · 2017: 15 · 2016: 15 · 2015: 7
- FWCI
- 11.05
- Type
- journal article
- Language
- en
- Open access
- gold
- doi.org
- Locations
- Genome biology (publishedVersion, cc-by)
- Europe PMC (PubMed Central) (publishedVersion, cc-by)
- PubMed Central (publishedVersion, cc-by)
- PubMed (publishedVersion)
- Apollo (University of Cambridge) (submittedVersion, cc-by)
- Funders
- Wellcome Trust (095606, 095606/Z/11/Z)
- European Commission (317146, 290123)
- Biotechnology and Biological Sciences Research Council (BB/G020930/1)
- Japan Society for the Promotion of Science (15K15478, 25713040)
- Topics
- Life Sciences › Biochemistry, Genetics and Molecular Biology › Genetics › Genetic Syndromes and Imprinting
- Life Sciences › Biochemistry, Genetics and Molecular Biology › Molecular Biology › Epigenetics and DNA Methylation
- Life Sciences › Biochemistry, Genetics and Molecular Biology › Molecular Biology › Genomics and Chromatin Dynamics
- Keywords
- ZFP57, genomic imprinting, monoallelic expression, allele-specific binding, DNA methylation, imprinting control regions, differentially methylated regions, FKBP6, endogenous retroviruses, embryonic stem cells, genetic background effects, male germ cell development, transient neonatal diabetes, Krüppel-like zinc finger protein
- MeSH terms
- Alleles, Animals, Binding Sites, Cell Line, DNA-Binding Proteins, Mice, Inbred C57BL, Repressor Proteins, Genetic Variation, Genomic Imprinting, DNA Methylation, Histone Code, Mice, Kruppel-Like Transcription Factors
About these checks
Registry, retraction, Cites and statistics results are computed, not judged, with one exception: a printed reference that no index lists is read once by a model before it counts as a citation error. Claims are extracted by a model and kept only when their quote appears verbatim in the text; each cited source is then checked, with a model’s help, for whether it says what the claim relies on. Those verdicts can be wrong — read the claim’s quote and the cited source before relying on one.
Statistics and arithmetic are recomputed, not judged.
Confidence bands are shown only for fields calibrated on our annotated test set. None is calibrated yet, so no band is shown.
What counts as a claim ›How we measure confidence ›How we check this ›
Are you an author, or do you see a problem with this page? Request a review
