

The DOI matches its Crossref record; 72 of the 72 references it cites were found in a registry or an index.
Application of single-cell RNA sequencing in optimizing a combinatorial therapeutic strategy in metastatic renal cell carcinoma
Open accessAbstract
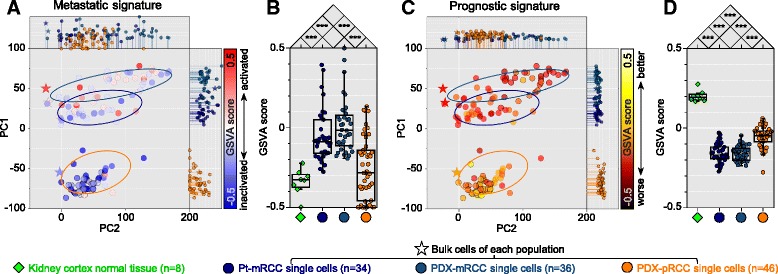
BACKGROUND: Intratumoral heterogeneity hampers the success of marker-based anticancer treatment because the targeted therapy may eliminate a specific subpopulation of tumor cells while leaving others unharmed. Accordingly, a rational strategy minimizing survival of the drug-resistant subpopulation is essential to achieve long-term therapeutic efficacy. RESULTS: Using single-cell RNA sequencing (RNA-seq), we examine the intratumoral heterogeneity of a pair of primary renal cell carcinoma and its lung metastasis. Activation of drug target pathways demonstrates considerable variability between the primary and metastatic sites, as well as among individual cancer cells within each site. Based on the prediction of multiple drug target pathway activation, we derive a combinatorial regimen co-targeting two mutually exclusive pathways for the metastatic cancer cells. This combinatorial strategy shows significant increase in the treatment efficacy over monotherapy in the experimental validation using patient-derived xenograft platforms in vitro and in vivo. CONCLUSIONS: Our findings demonstrate the investigational application of single-cell RNA-seq in the design of an anticancer regimen. The approach may overcome intratumoral heterogeneity which hampers the success of precision medicine.
Overview
The claims and statistics of this paper haven’t been checked yet.
Free: it reads the open-access text and checks the first 5 claims that cite a source we can check. Create a free account to check every claim.
Integrity signals
Registry
Cites
Statistics
Figures



Verification
Claims the paper makes
The claims and statistics of this paper haven’t been checked yet.
Free: it reads the open-access text and checks the first 5 claims that cite a source we can check. Create a free account to check every claim.
Claims other papers make about this one
Each is checked against this paper’s own text: does it say what the citing paper says it does?
The cited source says what the claim attributes to it.
In the citing paper
“Single-cell RNA sequencing (scRNA-seq) has emerged as a powerful tool to dissect this heterogeneity, revealing that drug target pathway activation varies significantly between primary and metastatic sites, as well as among individual cancer cells within a single site (Kim et al., 2016).”
From Spatial pharmacology of anti-cancer immunomodulators: a comprehensive review (2026) · cites this paper as Kim et al., 2016
The cited source says what the claim attributes to it.
In the citing paper
“For example, in metastatic renal cell carcinoma (RCC), scRNA-seq analysis of primary and lung metastatic tumors identified mutually exclusive pathway activation, leading to the design of a combinatorial regimen that co-targeted these pathways and significantly improved treatment efficacy in patient-derived xenograft models (Kim et al., 2016).”
From Spatial pharmacology of anti-cancer immunomodulators: a comprehensive review (2026) · cites this paper as Kim et al., 2016
The cited source says what the claim attributes to it.
In the citing paper
“Intratumoral heterogeneity remains a major barrier to effective cancer treatment, as targeted therapies often eliminate only specific subpopulations of tumor cells while leaving others unharmed (Kim et al., 2016).”
From Spatial pharmacology of anti-cancer immunomodulators: a comprehensive review (2026) · cites this paper as Kim et al., 2016
The cited source says what the claim attributes to it.
In the citing paper
“For example, in metastatic renal cell carcinoma, scRNA-seq identified mutually exclusive pathway activation, leading to the design of a combinatorial regimen that co-targeted these pathways and significantly improved efficacy (Kim et al., 2016).”
From Spatial pharmacology of anti-cancer immunomodulators: a comprehensive review (2026) · cites this paper as Kim et al., 2016
Self-check
Percentages, sums and reported differences re-computed from the paper’s own numbers.
The self-check needs the paper’s full text.
Citations
Cites
1 retracted
EMT Phenotype is Induced by Increased Src Kinase Activity via Src-Mediated Caspase-8 Phosphorylation
Zhao, Y., Li, X., Sun, X., Zhang, Y., & Ren, H. (2012) · Cellular Physiology and Biochemistry · doi:10.1159/000338489 · Cited by 11 · cited 2×
“Dysregulation of EGFR [32–34] and Src/FAK [35, 36] pathways plays a critical role in the tumorigenesis and metastatic progression of RCCs.”
BackgroundRetractedFast and accurate short read alignment with Burrows-Wheeler transform
Li, H., & Durbin, R. (2009) · Bioinformatics · doi:10.1093/bioinformatics/btp324 · Cited by 58,607
Cytoscape: A software Environment for integrated models of biomolecular interaction networks
Shannon, P., Markiel, A., Ozier, O., Baliga, N. S., Wang, J. T., Ramage, D., Amin, N., Schwikowski, B., & Ideker, T. (2003) · Genome Research · doi:10.1101/gr.1239303 · Cited by 51,888 · cited 1×
“the ClueGO [67] plug-in within the Cytoscape framework [68].”
MethodSTAR: ultrafast universal RNA-seq aligner
Dobin, A., Davis, C. A., Schlesinger, F., Drenkow, J., Zaleski, C., Jha, S., Batut, P., Chaisson, M., & Gingeras, T. R. (2013) · Bioinformatics · doi:10.1093/bioinformatics/bts635 · Cited by 51,709
limma powers differential expression analyses for RNA-sequencing and microarray studies
Ritchie, M. E., Phipson, B., Wu, D., Hu, Y., Law, C. W., Shi, W., & Smyth, G. K. (2015) · Nucleic Acids Research · doi:10.1093/nar/gkv007 · Cited by 40,458 · cited 1×
“Based on the CGH data, extracted signals were normalized to log2 ratios using the limma package [55].”
MethodThe Genome Analysis Toolkit: A MapReduce framework for analyzing next-generation DNA sequencing data
McKenna, A., Hanna, M., Banks, E., Sivachenko, A., Cibulskis, K., Kernytsky, A., Garimella, K., Altshuler, D., Gabriel, S., Daly, M., et al. (2010) · Genome Research · doi:10.1101/gr.107524.110 · Cited by 27,895 · cited 2×
“Identification of single-nucleotide variants and copy number variants Using the WES data, generated reads were aligned to the human genome reference hg19 using the Burrows- Wheeler Aligner [50] after removing duplicate reads, followed by implementation of the data-processing modules using the Genome Analysis Toolkit […”
MethodRSEM: accurate transcript quantification from RNA-Seq data with or without a reference genome
Li, B., & Dewey, C. N. (2011) · BMC Bioinformatics · doi:10.1186/1471-2105-12-323 · Cited by 22,179
GSVA: gene set variation analysis for microarray and RNA-Seq data
Hänzelmann, S., Castelo, R., & Guinney, J. (2013) · BMC Bioinformatics · doi:10.1186/1471-2105-14-7 · Cited by 15,440 · cited 1×
“way or signature across samples, we implemented the GSVA algorithm [61] in RNA-seq data.”
MethodRobinson, J. T., Thorvaldsdóttir, H., Winckler, W., Guttman, M., Lander, E. S., Getz, G., & Mesirov, J. P. (2011) · Nature Biotechnology · doi:10.1038/nbt.1754 · Cited by 15,390 · cited 2×
“Called variants were reviewed manually using the Integrative Genomic Viewer [53], and considered only within chromosomes 1–22 and X. Mutations were annotated using the SnpEff [54] package.”
MethodFast and accurate long-read alignment with Burrows-Wheeler transform.
Li, H., & Durbin, R. (2010) · Bioinformatics · doi:10.1093/bioinformatics/btp698 · Cited by 12,063
Cited by
Puram, S. V., Tirosh, I., Parikh, A. S., Patel, A. P., Yizhak, K., Gillespie, S., Rodman, C., Luo, C. L., Mroz, E. A., Emerick, K. S., et al. (2017) · Cell · doi:10.1016/j.cell.2017.10.044 · Cited by 2,557
“…scRNA-seq has facilitated the identification of developmental hierarchies, drug resistance programs, and patterns of immune infiltration relevant to tumor biology, diagnosis, and therapy (Kim et al., 2016; Li et al., 2017; Patel et al., 2014; Tirosh et al., 2016a, 2016b; Venteicher et al., 2017).”
BackgroundSingle-cell analysis reveals fibroblast clusters linked to immunotherapy resistance in cancer.
Kieffer, Y., Hocine, H. R., Gentric, G., Pelon, F., Bernard, C., Bourachot, B., Lameiras, S., Albergante, L., Bonneau, C., Guyard, A., et al. (2020) · Cancer Discovery · doi:10.1158/2159-8290.cd-19-1384 · Cited by 910
Denisenko, E., Guo, B. B., Jones, M., Hou, R., de Kock, L., Lassmann, T., Poppe, D., Clément, O., Simmons, R. K., Lister, R., et al. (2020) · Genome Biology · doi:10.1186/s13059-020-02048-6 · Cited by 686
Denisenko, E., Guo, B. B., Jones, M., Hou, R., de Kock, L., Lassmann, T., Poppe, D., Clement, O., Simmons, R. K., Lister, R., et al. (2019) · doi:10.1101/832444 · Cited by 686
Müller, S., Kohanbash, G., Liu, S. J., Alvarado, B., Carrera, D., Bhaduri, A., Watchmaker, P. B., Yagnik, G., Di Lullo, E., Malatesta, M., et al. (2017) · Genome Biology · doi:10.1186/s13059-017-1362-4 · Cited by 654
“A more recent scRNA-seq study, in a mouse model of CNS injury, showed that macrophages can simultaneously express markers of both M1 and M2 activation [39].”
Background
Metadata
- Authors
- Kim, K.-T., Lee, H. W., Lee, H.-O., Song, H. J., Jeong, D. E., Shin, S., Kim, H., Shin, Y., Nam, D.-H., Jeong, B. C., Kirsch, D. G., Joo, K. M., & Park, W.-Y.
- Affiliations
- Samsung Medical Center (KR)
- Sungkyunkwan University (KR)
- Korea University (KR)
- Duke University (US)
- Corresponding author
- Joo, Kyeung Min
- Park, Woong-Yang
- ORCID
- Venue
- Genome Biology
- Published
- 2016-04-29
- Volume
- 17
- Issue
- 1
- Pages
- 80-80
- ISSN
- 1465-6906 (ISSN-L)
- 1474-760X
- PMC
- PMC4852434
- OpenAlex
- W2342423616
- Cited by
- 198
- References
- 71
- Citations by year
- 2026: 5 · 2025: 8 · 2024: 12 · 2023: 20 · 2022: 21 · 2021: 35 · 2020: 27 · 2019: 19 · 2018: 23 · 2017: 21 · 2016: 7
- FWCI
- 20.70
- Type
- journal article
- Language
- en
- Open access
- gold
- doi.org
- Licence
- cc-by
- Locations
- Genome biology (publishedVersion, cc-by)
- PubMed Central (publishedVersion, cc-by)
- PubMed (publishedVersion)
- Funders
- Korea National Institute of Health (HI13C2096000013)
- Topics
- Health Sciences › Medicine › Oncology › Renal cell carcinoma treatment
- Life Sciences › Biochemistry, Genetics and Molecular Biology › Cancer Research › Cancer Genomics and Diagnostics
- Life Sciences › Biochemistry, Genetics and Molecular Biology › Molecular Biology › Single-cell and spatial transcriptomics
- Keywords
- metastatic renal cell carcinoma, intratumoral heterogeneity, lung metastasis, drug resistance, combination therapy, patient-derived xenografts, precision medicine, single-cell RNA sequencing
- MeSH terms
- Adult, Animals, Carcinoma, Renal Cell, Cells, Cultured, Humans, Kidney Neoplasms, Lung Neoplasms, Male, Sequence Analysis, RNA, Gene Expression Profiling, Mice, Molecular Targeted Therapy, Single-Cell Analysis
About these checks
Registry, retraction, Cites and statistics results are computed, not judged, with one exception: a printed reference that no index lists is read once by a model before it counts as a citation error. Claims are extracted by a model and kept only when their quote appears verbatim in the text; each cited source is then checked, with a model’s help, for whether it says what the claim relies on. Those verdicts can be wrong — read the claim’s quote and the cited source before relying on one.
Statistics and arithmetic are recomputed, not judged.
Confidence bands are shown only for fields calibrated on our annotated test set. None is calibrated yet, so no band is shown.
What counts as a claim ›How we measure confidence ›How we check this ›
Are you an author, or do you see a problem with this page? Request a review
How to cite
Cite CoChat for the checks on this page, and the paper for its own findings.
- This page
- CoChat. (2026). Citation check: Application of single-cell RNA sequencing in optimizing a combinatorial therapeutic strategy in metastatic renal cell carcinoma. https://app.cochat.ai/papers/10.1186/s13059-016-0945-9
- The paper
- Kim, K.-T., Lee, H. W., Lee, H.-O., Song, H. J., Jeong, D. E., Shin, S., Kim, H., Shin, Y., Nam, D.-H., Jeong, B. C., Kirsch, D. G., Joo, K. M., & Park, W.-Y. (2016). Application of single-cell RNA sequencing in optimizing a combinatorial therapeutic strategy in metastatic renal cell carcinoma. Genome Biology. https://doi.org/10.1186/s13059-016-0945-9
Data sources
Bibliographic data: Semantic Scholar, OpenAlex, Crossref.
Contains information from the Semantic Scholar Academic Graph Datasets, made available under the ODC Attribution License (ODC-BY 1.0).
Semantic Scholar’s data is described in: Kinney, R., et al. (2023). The Semantic Scholar Open Data Platform. arXiv:2301.10140.
