

Exploiting single-cell expression to characterize co-expression replicability
Open accessThe DOI matches its Crossref record; 66 of the 67 references it cites were found in a registry or an index, and 1 are not checked yet.
Abstract
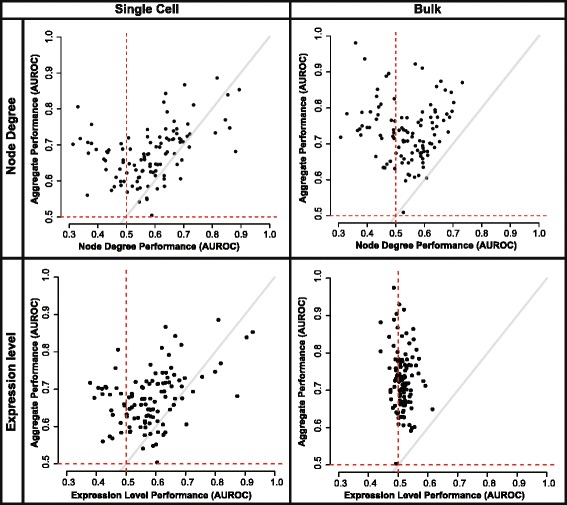
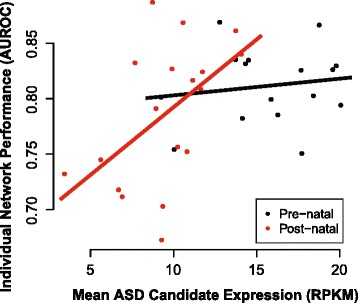
BACKGROUND: Co-expression networks have been a useful tool for functional genomics, providing important clues about the cellular and biochemical mechanisms that are active in normal and disease processes. However, co-expression analysis is often treated as a black box with results being hard to trace to their basis in the data. Here, we use both published and novel single-cell RNA sequencing (RNA-seq) data to understand fundamental drivers of gene-gene connectivity and replicability in co-expression networks. RESULTS: We perform the first major analysis of single-cell co-expression, sampling from 31 individual studies. Using neighbor voting in cross-validation, we find that single-cell network connectivity is less likely to overlap with known functions than co-expression derived from bulk data, with functional variation within cell types strongly resembling that also occurring across cell types. To identify features and analysis practices that contribute to this connectivity, we perform our own single-cell RNA-seq experiment of 126 cortical interneurons in an experimental design targeted to co-expression. By assessing network replicability, semantic similarity and overall functional connectivity, we identify technical factors influencing co-expression and suggest how they can be controlled for. Many of the technical effects we identify are expression-level dependent, making expression level itself highly predictive of network topology. We show this occurs generally through re-analysis of the BrainSpan RNA-seq data. CONCLUSIONS: Technical properties of single-cell RNA-seq data create confounds in co-expression networks which can be identified and explicitly controlled for in any supervised analysis. This is useful both in improving co-expression performance and in characterizing single-cell data in generally applicable terms, permitting cross-laboratory comparison within a common framework.
Overview
The claims and statistics of this paper haven’t been checked yet.
Free: it reads the open-access text and checks the first 5 claims that cite a source we can check. Create a free account to check every claim.
Integrity signals
Registry
Cites
Statistics
Figures
Verification
Claims the paper makes
The claims and statistics of this paper haven’t been checked yet.
Free: it reads the open-access text and checks the first 5 claims that cite a source we can check. Create a free account to check every claim.
Claims other papers make about this one
Each is checked against this paper’s own text: does it say what the citing paper says it does?
The cited source says what the claim attributes to it.
In the citing paper
“In addition, these methods are sensitive to normalization and batch-effects, which may introduce artificial co-variation [39].”
From Mapping gene regulatory networks from single-cell omics data (2018) · cites this paper as [39]
Self-check
Percentages, sums and reported differences re-computed from the paper’s own numbers.
The self-check needs the paper’s full text.
Citations
Cites
Gene Ontology: tool for the unification of biology
Ashburner, M., Ball, C. A., Blake, J. A., Botstein, D., Butler, H., Cherry, J. M., Davis, A. P., Dolinski, K., Dwight, S. S., Eppig, J. T., et al. (2000) · Nature Genetics · doi:10.1038/75556 · Cited by 43,206
RSEM: accurate transcript quantification from RNA-Seq data with or without a reference genome
Li, B., & Dewey, C. N. (2011) · BMC Bioinformatics · doi:10.1186/1471-2105-12-323 · Cited by 22,179
Cluster analysis and display of genome-wide expression patterns
Eisen, M. B., Spellman, P. T., Brown, P. O., & Botstein, D. (1998) · Proceedings of the National Academy of Sciences · doi:10.1073/pnas.95.25.14863 · Cited by 16,184
Adjusting batch effects in microarray expression data using empirical Bayes methods
Johnson, W. E., Li, C., & Rabinovic, A. (2007) · Biostatistics · doi:10.1093/biostatistics/kxj037 · Cited by 8,658
Highly parallel genome-wide expression profiling of individual cells using nanoliter droplets.
Macosko, E. Z., Basu, A., Satija, R., Nemesh, J., Shekhar, K., Goldman, M., Tirosh, I., Bialas, A. R., Kamitaki, N., Martersteck, E. M., et al. (2015) · Cell · doi:10.1016/j.cell.2015.05.002 · Cited by 7,110
A robust and high-throughput Cre reporting and characterization system for the whole mouse brain
Madisen, L., Zwingman, T. A., Sunkin, S. M., Oh, S. W., Zariwala, H. A., Gu, H., Ng, L. L., Palmiter, R. D., Hawrylycz, M. J., Jones, A. R., et al. (2010) · Nature Neuroscience · doi:10.1038/nn.2467 · Cited by 6,907
Single-cell RNA-seq highlights intratumoral heterogeneity in primary glioblastoma
Patel, A. P., Tirosh, I., Trombetta, J. J., Shalek, A. K., Gillespie, S. M., Wakimoto, H., Cahill, D. P., Nahed, B. V., Curry, W. T., Martuza, R. L., et al. (2014) · Science · doi:10.1126/science.1254257 · Cited by 5,063 · cited 1×
“scRNA-seq has now been applied to many human and mouse tissue types at multiple stages of development, including the lung, spleen, brain, retina, embryonic stem cells, and lumbar dorsal root ganglia, among others [4–11].”
MethodFinak, G., McDavid, A., Yajima, M., Deng, J., Gersuk, V., Shalek, A. K., Slichter, C. K., Miller, H. W., McElrath, M. J., Prlic, M., et al. (2015) · Genome Biology · doi:10.1186/s13059-015-0844-5 · Cited by 3,159
Cell types in the mouse cortex and hippocampus revealed by single-cell RNA-seq
Zeisel, A., Muñoz-Manchado, A. B., Codeluppi, S., Lönnerberg, P., La Manno, G., Juréus, A., Marques, S., Munguba, H., He, L., Betsholtz, C., et al. (2015) · Science · doi:10.1126/science.aaa1934 · Cited by 3,124
The contribution of de novo coding mutations to autism spectrum disorder
Iossifov, I., O’Roak, B. J., Sanders, S. J., Ronemus, M., Krumm, N., Levy, D., Stessman, H. A., Witherspoon, K. T., Vives, L., Patterson, K. E., et al. (2014) · Nature · doi:10.1038/nature13908 · Cited by 2,585 · cited 1×
“…where ten or more brain region samples were available (Additional file 8: Table S4), then assessed the connectivity of ASD candidate genes (see [45] for gene list) using the same general machine learning framework we used to measure the connectivity of GO groups and synaptic genes in previous…”
Method
Cited by
Scenic: single-cell regulatory network inference and clustering.
Aibar, S., González-Blas, C. B., Moerman, T., Huynh-Thu, V. A., Imrichova, H., Hulselmans, G., Rambow, F., Marine, J.-C., Geurts, P., Aerts, J., et al. (2017) · Nature Methods · doi:10.1038/nmeth.4463 · Cited by 6,520
Spatiotemporal structure of cell fate decisions in murine neural crest
Soldatov, R., Kaucka, M., Kastriti, M. E., Petersen, J., Chontorotzea, T., Englmaier, L., Akkuratova, N., Yang, Y., Häring, M., Dyachuk, V., et al. (2019) · Science · doi:10.1126/science.aas9536 · Cited by 546
“This reduction illustrates that most of the observed intramodule correlation can be attributed to compositional heterogeneity of cells around the bifurcation point (35).”
BackgroundBrain Cell Type Specific Gene Expression and Co-expression Network Architectures
McKenzie, A. T., Wang, M., Hauberg, M. E., Fullard, J. F., Kozlenkov, A., Keenan, A., Hurd, Y. L., Dracheva, S., Casaccia, P., Roussos, P., et al. (2018) · Scientific Reports · doi:10.1038/s41598-018-27293-5 · Cited by 481
Transcriptional Architecture of Synaptic Communication Delineates GABAergic Neuron Identity
Paul, A., Crow, M., Raudales, R., He, M., Gillis, J., & Huang, Z. J. (2017) · Cell · doi:10.1016/j.cell.2017.08.032 · Cited by 421
Self-citationCrow, M., Paul, A., Ballouz, S., Huang, Z. J., & Gillis, J. (2018) · Nature Communications · doi:10.1038/s41467-018-03282-0 · Cited by 365
Self-citation
Metadata
- Authors
- Crow, M., Paul, A., Ballouz, S., Huang, Z. J., & Gillis, J.
- Affiliations
- Cold Spring Harbor Laboratory (US)
- Corresponding author
- Gillis, Jesse
- Venue
- Genome Biology
- Published
- 2016-05-06
- Volume
- 17
- Issue
- 1
- Pages
- 101-101
- ISSN
- 1465-6906 (ISSN-L)
- 1474-760X
- PMC
- PMC4862082
- OpenAlex
- W2361797231
- Cited by
- 76
- References
- 66
- Citations by year
- 2026: 5 · 2025: 7 · 2024: 6 · 2023: 7 · 2022: 13 · 2021: 6 · 2020: 9 · 2019: 5 · 2018: 10 · 2017: 7 · 2016: 1
- FWCI
- 3.98
- Type
- journal article
- Language
- en
- Open access
- gold
- doi.org
- Licence
- cc-by
- creativecommons.org/licenses/by/4.0/ (tdm)
- creativecommons.org/licenses/by/4.0/ (vor)
- Locations
- Genome biology (publishedVersion, cc-by)
- PubMed Central (publishedVersion, cc-by)
- PubMed (publishedVersion)
- Cold Spring Harbor Laboratory Institutional Repository (Cold Spring Harbor Laboratory) (acceptedVersion)
- UNSWorks (University of New South Wales, Sydney, Australia) (submittedVersion, cc-by-nc-nd)
- Funders
- National Institutes of Health (1R01MH102616-01)
- T. and V. Stanley (Private Donation)
- Topics
- Life Sciences › Biochemistry, Genetics and Molecular Biology › Molecular Biology › Bioinformatics and Genomic Networks
- Life Sciences › Biochemistry, Genetics and Molecular Biology › Molecular Biology › Single-cell and spatial transcriptomics
- Life Sciences › Biochemistry, Genetics and Molecular Biology › Molecular Biology › Gene expression and cancer classification
- Keywords
- co-expression network, single-cell RNA sequencing, cortical interneurons, BrainSpan, semantic similarity, interlaboratory comparison
- MeSH terms
- Animals, Cell Separation, Reproducibility of Results, Sequence Analysis, RNA, Gene Expression Profiling, Mice, Gene Regulatory Networks, Single-Cell Analysis
About these checks
Registry, retraction, Cites and statistics results are computed, not judged, with one exception: a printed reference that no index lists is read once by a model before it counts as a citation error. Claims are extracted by a model and kept only when their quote appears verbatim in the text; each cited source is then checked, with a model’s help, for whether it says what the claim relies on. Those verdicts can be wrong — read the claim’s quote and the cited source before relying on one.
Statistics and arithmetic are recomputed, not judged.
Confidence bands are shown only for fields calibrated on our annotated test set. None is calibrated yet, so no band is shown.
What counts as a claim ›How we measure confidence ›How we check this ›
Are you an author, or do you see a problem with this page? Request a review
How to cite
Cite CoChat for the checks on this page, and the paper for its own findings.
- This page
- CoChat. (2026). Citation check: Exploiting single-cell expression to characterize co-expression replicability. https://app.cochat.ai/papers/10.1186/s13059-016-0964-6
- The paper
- Crow, M., Paul, A., Ballouz, S., Huang, Z. J., & Gillis, J. (2016). Exploiting single-cell expression to characterize co-expression replicability. Genome Biology. https://doi.org/10.1186/s13059-016-0964-6
Data sources
Bibliographic data: Semantic Scholar, OpenAlex, Crossref.
Contains information from the Semantic Scholar Academic Graph Datasets, made available under the ODC Attribution License (ODC-BY 1.0).
Semantic Scholar’s data is described in: Kinney, R., et al. (2023). The Semantic Scholar Open Data Platform. arXiv:2301.10140.
