

The DOI matches its Crossref record; 71 of the 71 references it cites were found in a registry or an index.
Correlation of an epigenetic mitotic clock with cancer risk
Open accessAbstract
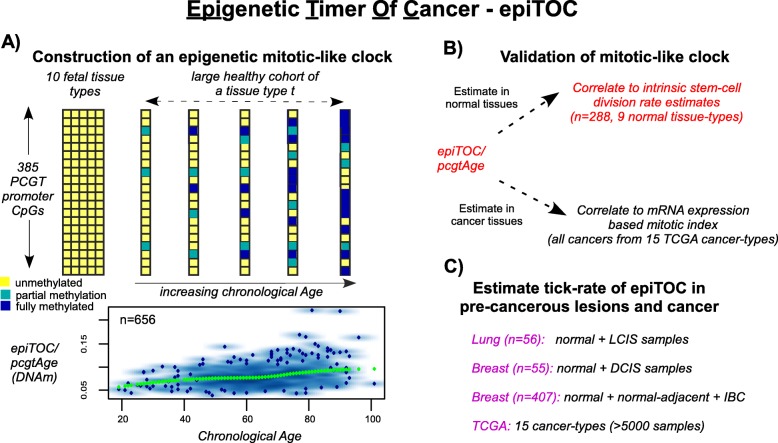
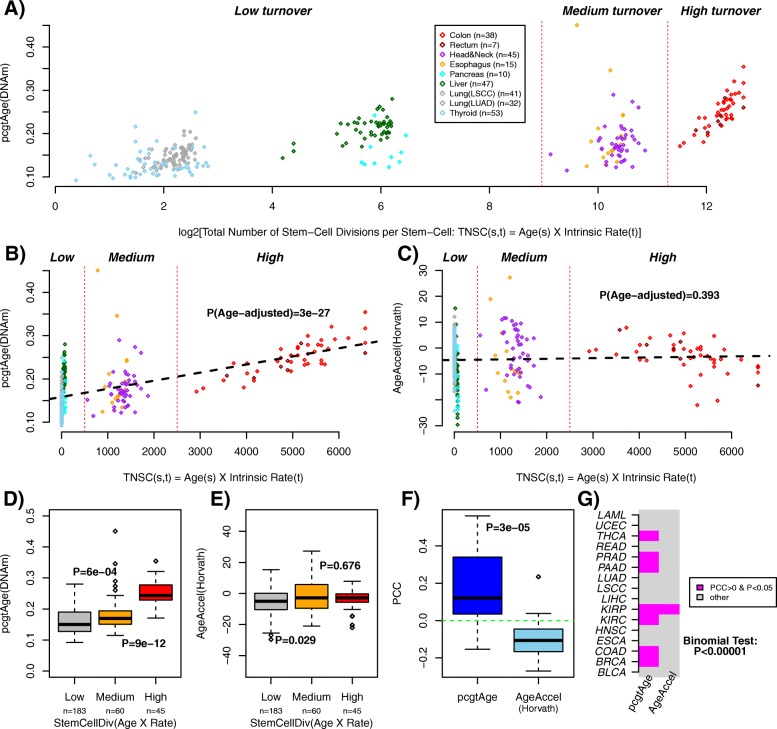
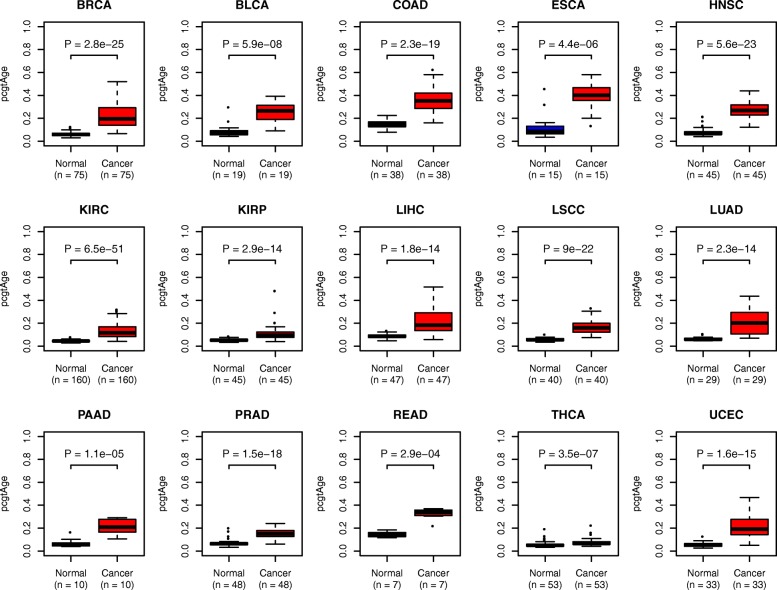
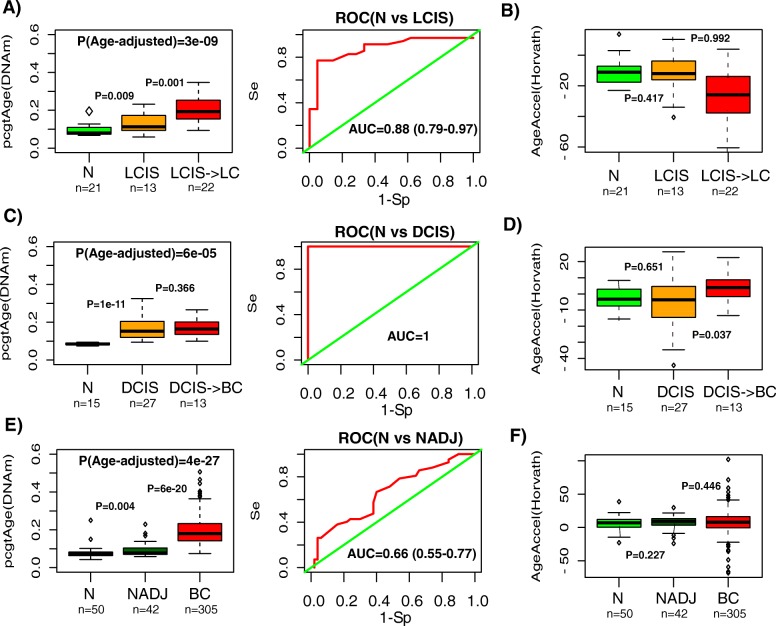
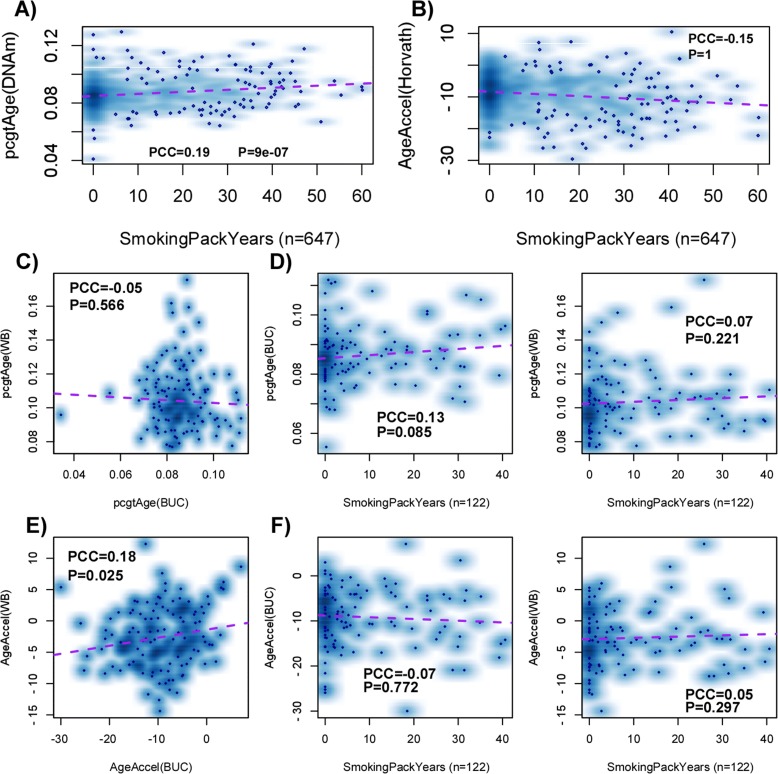
BACKGROUND: Variation in cancer risk among somatic tissues has been attributed to variations in the underlying rate of stem cell division. For a given tissue type, variable cancer risk between individuals is thought to be influenced by extrinsic factors which modulate this rate of stem cell division. To date, no molecular mitotic clock has been developed to approximate the number of stem cell divisions in a tissue of an individual and which is correlated with cancer risk. RESULTS: Here, we integrate mathematical modeling with prior biological knowledge to construct a DNA methylation-based age-correlative model which approximates a mitotic clock in both normal and cancer tissue. By focusing on promoter CpG sites that localize to Polycomb group target genes that are unmethylated in 11 different fetal tissue types, we show that increases in DNA methylation at these sites defines a tick rate which correlates with the estimated rate of stem cell division in normal tissues. Using matched DNA methylation and RNA-seq data, we further show that it correlates with an expression-based mitotic index in cancer tissue. We demonstrate that this mitotic-like clock is universally accelerated in cancer, including pre-cancerous lesions, and that it is also accelerated in normal epithelial cells exposed to a major carcinogen. CONCLUSIONS: Unlike other epigenetic and mutational clocks or the telomere clock, the epigenetic clock proposed here provides a concrete example of a mitotic-like clock which is universally accelerated in cancer and precancerous lesions.
Overview
The claims and statistics of this paper haven’t been checked yet.
Run the check — free, no account needed. It reads the open-access text and checks the sources it cites.
Integrity signals
Registry
Cites
Statistics
Figures
Verification
Claims the paper makes
The claims and statistics of this paper haven’t been checked yet.
Run the check — free, no account needed. It reads the open-access text and checks the sources it cites.
Claims other papers make about this one
Each is checked against this paper’s own text: does it say what the citing paper says it does?
In the citing paper
“In 2016, Yang et al.62 built an epigenetic clock associated with the number of cell divisions by pre-selecting CpG sites that had low levels of methylation in fetal tissue and increased methylation levels throughout adulthood and that mapped to Polycomb group target (PCGT) promoters, before training a sparse linear model.”
From Measuring biological age using omics data (2022) · cites this paper as [62]
In the citing paper
“Strikingly, this clock uniquely detected precancerous tissue samples to be age accelerated.”
From Measuring biological age using omics data (2022) · cites this paper as [62]
In the citing paper
“Yang et al.62 and Lu et al.167 took a different approach and trained clocks on cellular features — mitotic cell division and telomere length, respectively — to develop models with specific sensitivity for these aspects of cellular ageing.”
From Measuring biological age using omics data (2022) · cites this paper as [62]
Self-check
Percentages, sums and reported differences re-computed from the paper’s own numbers.
The self-check needs the paper’s full text.
Citations
Cites
The cancer genome atlas pan-cancer analysis project
The Cancer Genome Atlas Research Network, Weinstein, J. N., Collisson, E. A., Mills, G. B., Shaw, K. R. M., Ozenberger, B. A., Ellrott, K., Shmulevich, I., Sander, C., & Stuart, J. M. (2013) · Nature Genetics · doi:10.1038/ng.2764 · Cited by 9,092
DNA methylation age of human tissues and cell types
Horvath, S. (2013) · Genome Biology · doi:10.1186/gb-2013-14-10-r115 · Cited by 7,075
Age-related clonal hematopoiesis associated with adverse outcomes
Jaiswal, S., Fontanillas, P., Flannick, J., Manning, A., Grauman, P. V., Mar, B. G., Lindsley, R. C., Mermel, C. H., Burtt, N., Chavez, A., et al. (2014) · New England Journal of Medicine · doi:10.1056/nejmoa1408617 · Cited by 4,841
Genome-wide methylation profiles reveal quantitative views of human aging rates
Hannum, G., Guinney, J., Zhao, L., Zhang, L., Hughes, G., Sadda, S., Klotzle, B., Bibikova, M., Fan, J.-B., Gao, Y., et al. (2013) · Molecular Cell · doi:10.1016/j.molcel.2012.10.016 · Cited by 4,270
Clonal hematopoiesis and blood-cancer risk inferred from blood DNA sequence
Genovese, G., Kähler, A. K., Handsaker, R. E., Lindberg, J., Rose, S. A., Bakhoum, S. F., Chambert, K., Mick, E., Neale, B. M., Fromer, M., et al. (2014) · New England Journal of Medicine · doi:10.1056/nejmoa1409405 · Cited by 3,531
DNA methylation arrays as surrogate measures of cell mixture distribution
Houseman, E. A., Accomando, W. P., Koestler, D. C., Christensen, B. C., Marsit, C. J., Nelson, H. H., Wiencke, J. K., & Kelsey, K. T. (2012) · BMC Bioinformatics · doi:10.1186/1471-2105-13-86 · Cited by 3,175
Ben‐Porath, I., Thomson, M., Carey, V. J., Ge, R., Bell, G. W., Regev, A., & Weinberg, R. A. (2008) · Nature Genetics · doi:10.1038/ng.127 · Cited by 2,571
Control of Developmental Regulators by Polycomb in Human Embryonic Stem Cells
Lee, T. I., Jenner, R. G., Boyer, L. A., Guenther, M. G., Levine, S. S., Kumar, R., Chevalier, B. S., Johnstone, S. E., Cole, M. F., Isono, K., et al. (2006) · Cell · doi:10.1016/j.cell.2006.02.043 · Cited by 2,296
IDH1 mutation is sufficient to establish the glioma hypermethylator phenotype
Turcan, S., Rohle, D., Goenka, A., Walsh, L. A., Fang, F., Yilmaz, E., Campos, C., Fabius, A. W. M., Lu, C., Ward, P. S., et al. (2012) · Nature · doi:10.1038/nature10866 · Cited by 1,974
Variation in cancer risk among tissues can be explained by the number of stem cell divisions
Tomasetti, C., & Vogelstein, B. (2015) · Science · doi:10.1126/science.1260825 · Cited by 1,927
Cited by
Sorted by citations
Items 101–200 of 328
Nwanaji‐Enwerem, J. C., Weisskopf, M. G., & Baccarelli, A. (2018) · Ageing Research Reviews · doi:10.1016/j.arr.2018.04.005 · Cited by 29
Wandering along the epigenetic timeline
Topart, C., Werner, E., & Arimondo, P. B. (2020) · Clinical Epigenetics · doi:10.1186/s13148-020-00893-7 · Cited by 34
Haider, Z., Larsson, P. G., Landfors, M., Köhn, L., Schmiegelow, K., Flægstad, T., Kanerva, J. A., Heyman, M. M., Hultdin, M., & Degerman, S. (2018) · Cancer Medicine · doi:10.1002/cam4.1917 · Cited by 28
An improved epigenetic counter to track mitotic age in normal and precancerous tissues
Zhu, T., Tong, H., Du, Z., Beck, S., & Teschendorff, A. E. (2024) · Nature Communications · doi:10.1038/s41467-024-48649-8 · Cited by 27
Self-citationLu, X., Zhou, Y., Meng, J., Jiang, L., Gao, J., Fan, X., Chen, Y., Cheng, Y., Wang, Y., Zhang, B., et al. (2020) · Clinical Epigenetics · doi:10.1186/s13148-020-0822-y · Cited by 28
DNA methylation and copy number variation profiling of T-cell lymphoblastic leukemia and lymphoma
Haider, Z., Landfors, M., Golovleva, I., Erlanson, M., Schmiegelow, K., Flægstad, T., Kanerva, J. A., Norén‐Nyström, U., Hultdin, M., & Degerman, S. (2020) · Blood Cancer Journal · doi:10.1038/s41408-020-0310-9 · Cited by 27
Paul, K. C., Binder, A. M., Horvath, S., Kusters, C., Yan, Q. J., Rosario, I. D., Yu, Y., Bronstein, J. M., & Ritz, B. R. (2021) · BMC Genomics · doi:10.1186/s12864-021-08009-y · Cited by 29
Antiprogestins reduce epigenetic field cancerization in breast tissue of young healthy women
Bartlett, T. E., Evans, I., Jones, A., Barrett, J. J. E., Haran, S. S., Reisel, D., Papaikonomou, K., Jones, J. L., Herzog, C. M. S., Pashayan, N., et al. (2022) · Genome Medicine · doi:10.1186/s13073-022-01063-5 · Cited by 27
Self-citationBeydoun, M. A., Beydoun, H. A., Hooten, N. N., Maldonado, A. I., Weiss, J., Evans, M. K., & Zonderman, A. B. (2022) · Aging · doi:10.18632/aging.204150 · Cited by 27
Silencing of SRRM4 suppresses microexon inclusion and promotes tumor growth across cancers
Head, S. A., Hernandez‐Alias, X., Yang, J., Ciampi, L., Beltrán-Sastre, V., Torres-Méndez, A., Irimia, M., Schaefer, M. H., & Serrano, L. G. (2021) · PLoS Biology · doi:10.1371/journal.pbio.3001138 · Cited by 26
Effect of metformin on the epigenetic age of peripheral blood in patients with diabetes mellitus
Li, M., Bao, L., Zhu, P., & Wang, S. (2022) · Frontiers in Genetics · doi:10.3389/fgene.2022.955835 · Cited by 21
Rane, J. K., Frankell, A. M., Weeden, C. E., & Swanton, C. (2023) · Cancer Prevention Research · doi:10.1158/1940-6207.capr-22-0469 · Cited by 25
On epigenetic stochasticity, entropy and cancer risk
Teschendorff, A. E. (2024) · Philosophical Transactions of the Royal Society B Biological Sciences · doi:10.1098/rstb.2023.0054 · Cited by 24
Self-citationNovel epigenetic network biomarkers for early detection of esophageal cancer
Maity, A. K., Stone, T., Ward, V., Webster, A. P., Yang, Z., Hogan, Á., McBain, H., Duku, M., Ho, K. M. A., Wolfson, P., et al. (2022) · Clinical Epigenetics · doi:10.1186/s13148-022-01243-5 · Cited by 25
Self-citationDNA methylation variations and epigenetic aging in telomere biology disorders
Carlund, O., Norberg, A., Osterman, P., Landfors, M., Degerman, S., & Hultdin, M. (2023) · Scientific Reports · doi:10.1038/s41598-023-34922-1 · Cited by 25
Prediagnostic breast milk DNA methylation alterations in women who develop breast cancer
Salas, L. A., Lundgren, S., Browne, E. P., Punska, E. C., Anderton, D. L., Karagas, M. R., Arcaro, K. F., & Christensen, B. C. (2019) · Human Molecular Genetics · doi:10.1093/hmg/ddz301 · Cited by 23
Estimage: a webserver hub for the computation of methylation age
Lena, P. D., Sala, C., & Nardini, C. (2021) · Nucleic Acids Research · doi:10.1093/nar/gkab426 · Cited by 22
methscore: a comprehensive R function for DNA methylation-based health predictors
Xu, Z., Niu, L., Kresovich, J. K., & Taylor, J. A. (2024) · Bioinformatics · doi:10.1093/bioinformatics/btae302 · Cited by 23
The Gut and Skin Microbiome and Its Association with Aging Clocks
Min, M., Egli, C., & Sivamani, R. K. (2024) · International Journal of Molecular Sciences · doi:10.3390/ijms25137471 · Cited by 22
Tharakan, R., Ubaida‐Mohien, C., Moore, A. Z., Hernandez, D. G., Tanaka, T., & Ferrucci, L. (2020) · The Journals of Gerontology Series A · doi:10.1093/gerona/glaa052 · Cited by 22
Chemical and climatic environmental exposures and epigenetic aging: A systematic review
Fadadu, R. P., Bozack, A. K., & Cárdenas, A. (2025) · Environmental Research · doi:10.1016/j.envres.2025.121347 · Cited by 21
The genomic loci of specific human tRNA genes exhibit ageing-related DNA hypermethylation
Acton, R., Yuan, W., Gao, F., Xia, Y., Bourne, E., Wozniak, E., Bell, J. T., Lillycrop, K. A., Wang, J., Dennison, E. M., et al. (2021) · Nature Communications · doi:10.1038/s41467-021-22639-6 · Cited by 21
Peripheral blood DNA methylation profiles predict future development of B-cell Non-Hodgkin Lymphoma
Espín-Pérez, A., Brennan, K., Ediriwickrema, A., Gevaert, O., Lossos, I. S., & Gentles, A. J. (2022) · npj Precision Oncology · doi:10.1038/s41698-022-00295-3 · Cited by 20
Cell-free DNA methylation patterns in aging and their association with inflamm-aging
Li, S., Gao, X. Q., Wang, Z., Li, J., Zeng, L.-T., Dang, Y.-M., Ma, Y., Zhang, L., Wang, Q., Zhang, Y.-M., et al. (2024) · Epigenomics · doi:10.1080/17501911.2024.2340958 · Cited by 21
Karpiński, P., Pesz, K. A., & Sasiadek, M. M. (2017) · Epigenomics · doi:10.2217/epi-2017-0070 · Cited by 20
Dupras, C., Beck, S., Rothstein, M. A., Berner, A., Saulnier, K. M., Pinkesz, M., Prince, A. E. R., Liosi, S., Song, L., & Joly, Y. (2019) · Current Zoology · doi:10.1093/eep/dvz018 · Cited by 21
Self-citationBiological age measured by DNA methylation clocks and frailty: a systematic review and meta-analysis
Tay, J. H., Barros, D. G. M., Wang, W., Wazny, V. K., & Maier, A. B. (2025) · The Lancet Healthy Longevity · doi:10.1016/j.lanhl.2025.100773 · Cited by 21
Rozenblit, M., Hofstatter, E. W., Liu, Z., O’Meara, T. A., Storniolo, A. M., Dalela, D., Singh, V., Pusztai, L., & Levine, M. E. (2022) · Clinical Epigenetics · doi:10.1186/s13148-022-01249-z · Cited by 20
Corley, M. J., Pang, A. P. S., Shikuma, C. M., & Ndhlovu, L. C. (2023) · Aging Cell · doi:10.1111/acel.13926 · Cited by 19
Ueda, S., Yamashita, S., Nakajima, M., Kumamoto, T., Ogawa, C., Liu, Y., Yamada, H., Kubo, E., Hattori, N., Takeshima, H., et al. (2022) · Proceedings of the National Academy of Sciences · doi:10.1073/pnas.2123241119 · Cited by 20
Ryoo, S.-W., Choi, B.-Y., Son, S.-Y., Lee, J.-H., Min, J., & Min, K. (2025) · Chemosphere · doi:10.1016/j.chemosphere.2025.144194 · Cited by 18
Accounting for differences between Infinium MethylationEPIC v2 and v1 in DNA methylation–based tools
Zhuang, B. C., Jude, M. S., Konwar, C., Yusupov, N., Ryan, C. P., Engelbrecht, H.-R., Whitehead, J., Halberstam, A. A., MacIsaac, J. L., Dever, K., et al. (2025) · Life Science Alliance · doi:10.26508/lsa.202403155 · Cited by 19
Kalyakulina, A., Yusipov, I., Trukhanov, A., Franceschi, C., Moskalev, A., & Ivanchenko, M. (2025) · International Journal of Molecular Sciences · doi:10.3390/ijms26136284 · Cited by 19
Modulating biological aging with food-derived signals: a systems and precision nutrition perspective
Carlberg, C., Blüthner, A., Schoeman-Giziakis, I., Oosting, A., & Cocolin, L. (2025) · npj Aging · doi:10.1038/s41514-025-00266-5 · Cited by 17
CellBiAge: Improved single-cell age classification using data binarization
Yu, D., Li, M., Linghu, G., Hu, Y., Hajdarovic, K. H., Wang, A., Singh, R., & Webb, A. E. (2023) · Cell Reports · doi:10.1016/j.celrep.2023.113500 · Cited by 19
Age-associated clonal B cells drive B cell lymphoma in mice
Castro, J. P., Shindyapina, A. V., Barbieri, A., Ying, K., Strelkova, O. S., Paulo, J. A., Tyshkovskiy, A., Meinl, R., Kerepesi, C., Petrashen, A. P., et al. (2024) · Nature Aging · doi:10.1038/s43587-024-00671-7 · Cited by 19
The Epigenetic Clock and Aging
Raj, K. (2017) · Elsevier eBooks · doi:10.1016/b978-0-12-811060-7.00004-8 · Cited by 18
Bady, P., Marosi, C., Weller, M., Grønberg, B. H., Schultz, H., TAPHOORN, M. J. B., Gijtenbeek, J. M. M., van den Bent, M. J., von Deimling, A., Stupp, R., et al. (2022) · Acta Neuropathologica Communications · doi:10.1186/s40478-022-01344-5 · Cited by 16
Differentiation‐related epigenomic changes define clinically distinct keratinocyte cancer subclasses
Solé‐Boldo, L., Raddatz, G., Gutekunst, J., Gilliam, O., Bormann, F., Libério, M. S., Hasche, D., Antonopoulos, W., Mallm, J., Lonsdorf, A. S., et al. (2022) · Molecular Systems Biology · doi:10.15252/msb.202211073 · Cited by 16
Korous, K. M., Surachman, A., Rogers, C. R., & Cuevas, A. G. (2023) · Social Science & Medicine · doi:10.1016/j.socscimed.2023.116173 · Cited by 17
Schmitz, L., Duffie, E., Zhao, W., Ratliff, S. M., Ding, J., Liu, Y., Merkin, S. S., Smith, J. A., & Seeman, T. E. (2023) · American Journal of Epidemiology · doi:10.1093/aje/kwad172 · Cited by 17
Yates, J., Schaufelberger, H., Steinacher, R., Schär, P., Truninger, K., & Boeva, V. (2024) · JNCI Journal of the National Cancer Institute · doi:10.1093/jnci/djae016 · Cited by 16
Human methylome variation across Infinium 450K data on the Gene Expression Omnibus
Maden, S. K., Thompson, R. F., Hansen, K. D., & Nellore, A. (2021) · NAR Genomics and Bioinformatics · doi:10.1093/nargab/lqab025 · Cited by 16
DNA Methylation–Based Measures of Biological Aging
Dugué, P., Li, S., Hopper, J. L., & Milne, R. L. (2018) · Elsevier eBooks · doi:10.1016/b978-0-12-812215-0.00003-0 · Cited by 16
Chen, H., Zhou, T., Wu, S., Cao, Y., Zong, G., & Yuan, C. (2023) · BMC Medicine · doi:10.1186/s12916-022-02674-w · Cited by 15
Bidirectional relationship between epigenetic age and stroke, dementia, and late-life depression
Rivier, C. A., Szejko, N., Renedo, D. B., Clocchiatti‐Tuozzo, S., Huo, S., de Havenon, A., Zhao, H., Gill, T. M., Sheth, K. N., & Falcone, G. J. (2025) · Nature Communications · doi:10.1038/s41467-024-54721-0 · Cited by 15
Hong, C., Yang, S., Wang, Q., Zhang, S., Wu, W., Chen, J., Zhong, D., Li, M., Li, L., Li, J., et al. (2021) · Frontiers in Genetics · doi:10.3389/fgene.2021.563051 · Cited by 16
Pan, L., Zhu, J., Wang, S., Zhuang, H., Zhang, S., Huang, Z., Cai, F., Song, Z., Liu, Y., Liu, W., et al. (2025) · EBioMedicine · doi:10.1016/j.ebiom.2025.105829 · Cited by 16
Spatial compartmentalization of signaling imparts source-specific functions on secreted factors
Groppa, E., Martini, P. G. V., Derakhshan, N., Théret, M., Ritso, M., Tung, L. W., Wang, Y. X., Soliman, H. S., Hamer, M. S., Stankiewicz, L. N., et al. (2023) · Cell Reports · doi:10.1016/j.celrep.2023.112051 · Cited by 15
Epigenomic Characterization of Lymphoid Neoplasms
Duran‐Ferrer, M., & Martín-Subero, J. I. (2023) · Annual Review of Pathology Mechanisms of Disease · doi:10.1146/annurev-pathmechdis-051122-100856 · Cited by 16
Reduced Epigenetic Age in Older Adults With High Sense of Purpose in Life
Kim, E. S., Nakamura, J. S., Strecher, V. J., & Cole, S. W. (2023) · The Journals of Gerontology Series A · doi:10.1093/gerona/glad092 · Cited by 13
Food insecurity and epigenetic aging in middle-aged and older adults
Tamargo, J. A., & Cruz‐Almeida, Y. (2024) · Social Science & Medicine · doi:10.1016/j.socscimed.2024.116949 · Cited by 14
Towards a Novel Frontier in the Use of Epigenetic Clocks in Epidemiology
Martínez‐Magaña, J. J., Hurtado-Soriano, J., Rivero-Segura, N. A., Montalvo‐Ortiz, J. L., Garcia-delaTorre, P., Becerril-Rojas, K., & Gómez-Verján, J. C. (2024) · Archives of Medical Research · doi:10.1016/j.arcmed.2024.103033 · Cited by 13
Berglund, A., Yamoah, K., Eschrich, S. A., Falahat, R., Mulé, J. J., Kim, S., Matta, J. L., Dutil, J., Ruiz-Deyá, G., Sanchez, C. O., et al. (2024) · Cancer Medicine · doi:10.1002/cam4.70044 · Cited by 12
On correlative and causal links of replicative epimutations
Zhou, W., & Reizel, Y. (2024) · Trends in Genetics · doi:10.1016/j.tig.2024.08.008 · Cited by 13
Characterization of DNA methylation clock algorithms applied to diverse tissue types
Richardson, M., Brandt, C., Jain, N., Li, J., Demanelis, K., Jasmine, F., Kibriya, M. G., Lin, T., & Pierce, B. L. (2025) · Aging · doi:10.18632/aging.206182 · Cited by 12
Methylation Biomarkers of Lung Cancer Risk: A Systematic Review and Meta-Analysis
Dolcini, J., Chiavarini, M., Firmani, G., Brennan, K. J. M., Cárdenas, A., Baccarelli, A., & Barbadoro, P. (2025) · Cancers · doi:10.3390/cancers17040690 · Cited by 12
Epigenetic clocks and inflammaging: pitfalls caused by ignoring cell-type heterogeneity
Guo, X., & Teschendorff, A. E. (2025) · GeroScience · doi:10.1007/s11357-025-01677-8 · Cited by 12
Self-citationBinder, A. M., & Horvath, S. (2022) · Springer eBooks · doi:10.1007/978-3-030-94475-9_11 · Cited by 13
Shi, W., Tang, S., Fang, J., Cao, Y., Chen, C., Li, T., Gao, X., & Shi, X. (2022) · Environmental Research · doi:10.1016/j.envres.2022.113507 · Cited by 12
Reduced epigenetic age in older adults who volunteer
Nakamura, J. S., Kwok, C., Huang, A., Strecher, V. J., Kim, E. S., & Cole, S. W. (2022) · Psychoneuroendocrinology · doi:10.1016/j.psyneuen.2022.106000 · Cited by 12
Time's up: Epigenetic clocks in plants
Vo, B. T., Más, P., & Johannes, F. M. (2024) · Current Opinion in Plant Biology · doi:10.1016/j.pbi.2024.102602 · Cited by 11
Gorelov, R. A., Weiner, A. I., Huebner, A. J., Yagi, M., Haghani, A., Brooke, R. T., Horvath, S., & Hochedlinger, K. (2024) · Stem Cell Reports · doi:10.1016/j.stemcr.2024.07.009 · Cited by 11
Hackenhaar, F. S., Refhagen, N., Hagleitner, M. M., van Leeuwen, F. N., Marquart, H. V., MADSEN, H. O., Landfors, M., Osterman, P., Schmiegelow, K., Flægstad, T., et al. (2025) · Blood · doi:10.1182/blood.2024026027 · Cited by 11
The Molecular Biology of Midgut Neuroendocrine Neoplasms
Webster, A. P., & Thirlwell, C. (2023) · Endocrine Reviews · doi:10.1210/endrev/bnad034 · Cited by 11
Kulis, M., & Martín-Subero, J. I. (2022) · British Journal of Haematology · doi:10.1111/bjh.18465 · Cited by 11
Pusparum, M., Thas, O., Beck, S., Ecker, S., & Ertaylan, G. (2025) · npj Digital Medicine · doi:10.1038/s41746-025-01911-9 · Cited by 11
Self-citationCui, W., Huang, Z., Jin, S., Johnson, J. S., Lau, K. H., Hostetter, G. H., & Pfeifer, G. P. (2023) · Cancer Research · doi:10.1158/0008-5472.can-23-0269 · Cited by 11
Liu, T., Wang, J., Xiu, Y., Wu, Y., & Xu, D. (2021) · Cancers · doi:10.3390/cancers13194827 · Cited by 10
The Epigenetic Landscape: From Molecular Mechanisms to Biological Aging
Evangelina, R., Ganesan, S., & George, M. (2025) · Rejuvenation Research · doi:10.1089/rej.2024.0102 · Cited by 12
Herzog, C. M. S., Redl, E., Barrett, J. J. E., Aminzadeh-Gohari, S., Weber, D. D., Tevini, J., Lang, R., Kofler, B., & Widschwendter, M. (2025) · Communications Medicine · doi:10.1038/s43856-025-00739-4 · Cited by 12
Self-citationNeedham, B. L., Gladish, N., Shen, H., Liu, Y., Smith, J. A., Mukherjee, B., Zhou, X., & Rehkopf, D. H. (2025) · PLoS ONE · doi:10.1371/journal.pone.0327010 · Cited by 9
Decoding the Genomic and Functional Landscape of Emerging Subtypes in Ovarian Cancer
Micoli, G., Lavikka, K., Li, Y., Pirttikoski, A., Afenteva, D., Senkowski, W., Marchi, G., Vähärautio, A., Muranen, T., Joutsiniemi, T., et al. (2025) · Cancer Discovery · doi:10.1158/2159-8290.cd-25-0652 · Cited by 9
DNA methylation-based health predictors: advances, applications, and perspectives
Xu, Z. (2025) · Epigenomics · doi:10.1080/17501911.2025.2550932 · Cited by 9
Long-term BMI trajectories and epigenetic age acceleration: the role of genetic risk for obesity
Wen, Y., Chen, Y., Ma, Y., Lu, C., Liu, Y., Zhang, R., Liao, J., Wu, D., & Li, C. (2025) · BMC Medicine · doi:10.1186/s12916-025-04410-6 · Cited by 10
Buffy coat signatures of breast cancer risk in a prospective cohort study
Chung, F. F., Maldonado, S. G., Nemc, A., Bouaoun, L., Cahais, V., Cuenin, C., Sallé, A., Johnson, T., Ergüner, B., Laplana, M., et al. (2023) · Clinical Epigenetics · doi:10.1186/s13148-023-01509-6 · Cited by 10
Carlund, O., Thörn, E., Osterman, P., Fors, M., Dernstedt, A., Forsell, M. N. E., Erlanson, M., Landfors, M., Degerman, S., & Hultdin, M. (2024) · Clinical Epigenetics · doi:10.1186/s13148-024-01680-4 · Cited by 9
Longitudinal Epigenetic Aging in Pregnancy and Associations With Adverse Outcomes
Panelli, D. M., Gladish, N., Perlman, N. C., Leonard, S. A., Chueh, J. T., Gotlib, I. H., Cárdenas, A., & Bianco, K. (2025) · Obstetrics and Gynecology · doi:10.1097/aog.0000000000006000 · Cited by 8
Tharakan, R., Ubaida‐Mohien, C., Dunn, C., Kaileh, M., Tryggvadóttir, R., Zukley, L. M., Chia, C. W., Sen, R., & Ferrucci, L. (2023) · Aging Cell · doi:10.1111/acel.13847 · Cited by 9
Cytogenomics of B-cell non-Hodgkin lymphomas: The “old” meets the “new”
Grau, M., López, C., Martín-Subero, J. I., & Beà, S. (2023) · Best Practice & Research Clinical Haematology · doi:10.1016/j.beha.2023.101513 · Cited by 8
An expedited screening platform for the discovery of anti-ageing compounds in vitro and in vivo
Lujan, C., Tyler, E. J., Ecker, S., Webster, A. P., Stead, E. R., Martinez-Miguel, V. E., Milligan, D., Garbe, J. C., Stampfer, M. R., Beck, S., et al. (2024) · Genome Medicine · doi:10.1186/s13073-024-01349-w · Cited by 8
Self-citationNon-Surgical Cancer Risk Reduction in BRCA1 Mutation Carriers: Disabling the Remote Control
Widschwendter, M., & Dubeau, L. (2020) · Cancers · doi:10.3390/cancers12030547 · Cited by 7
Self-citationDifferences in epigenetic age by HIV status among patients with a non-AIDS defining cancer
Dickey, B. L., Putney, R. M., Suneja, G., Kresovich, J. K., Spivak, A. M., Patel, A. B., Teng, M., Extermann, M., Giuliano, A. R., Gillis, N., et al. (2023) · AIDS · doi:10.1097/qad.0000000000003661 · Cited by 7
Epigenetic age and long-term cancer risk following a stroke
Suárez‐Pérez, A., Macias-Gómez, A., Pérez, I. F., Vallverdú-Prats, M., Cuadrado‐Godia, E., Steinhauer, E. G., Campanale, M., Guisado‐Alonso, D., Rodríguez-Campello, A., Jiménez-Baladó, J., et al. (2024) · Genome Medicine · doi:10.1186/s13073-024-01408-2 · Cited by 7
Understanding the biological processes of kidney carcinogenesis: an integrative multi-omics approach
Penha, R. C. C., Sexton‐Oates, A., Senkin, S., Park, H. A., Atkins, J., Holcátová, I., Horňáková, A., Savić, S., Ognjanovic, S., Świątkowska, B., et al. (2024) · Molecular Systems Biology · doi:10.1038/s44320-024-00072-3 · Cited by 7
Fan, X., Yuan, H., Zhao, S., Yang, X., Shi, R., Wang, J., & Zhao, H. (2020) · Cancer Biology & Therapy · doi:10.1080/15384047.2020.1804284 · Cited by 8
Kimmel, G. J., Beck, R. J., Yu, X., Veith, T. A., Bakhoum, S. F. W., Altrock, P. M., & Andor, N. (2023) · PLoS Computational Biology · doi:10.1371/journal.pcbi.1010815 · Cited by 7
Howell, A., Relton, C. L., Martin, R. M., Zheng, J., & Kurian, K. M. (2023) · Scientific Reports · doi:10.1038/s41598-023-33621-1 · Cited by 8
Hao, J., Liu, T., Xiu, Y., Yuan, H., & Xu, D. (2023) · Frontiers in Immunology · doi:10.3389/fimmu.2023.1208223 · Cited by 7
Widayati, T. A., Schneider, J., Panteleeva, K., Chernysheva, E., Hrbková, N., Beck, S., Voloshin, V., & Chervova, O. (2023) · Frontiers in Genetics · doi:10.3389/fgene.2023.1258648 · Cited by 7
Self-citationEpigenetic Biomarkers of Aging
Levine, M. E. (2019) · Healthy ageing and longevity · doi:10.1007/978-3-030-24970-0_11 · Cited by 7
A new timepiece: an epigenetic mitotic clock
Christensen, B. C., & Kelsey, K. T. (2016) · Genome biology · doi:10.1186/s13059-016-1085-y · Cited by 7
Recalibrate concepts of epigenetic aging clocks in human health
Zhang, Z., Christensen, B. C., & Salas, L. A. (2024) · Aging · doi:10.18632/aging.206027 · Cited by 7
Cell-type-specific subtyping of epigenomes improves prognostic stratification of cancer
Luo, Q., & Teschendorff, A. E. (2025) · Genome Medicine · doi:10.1186/s13073-025-01453-5 · Cited by 6
Self-citationHerzog, C. M. S., Vavourakis, C. D., Barrett, J. J. E., Karbon, G., Villunger, A., Wang, J., Sundström, K., Dillner, J., & Widschwendter, M. (2023) · International Journal of Cancer · doi:10.1002/ijc.34477 · Cited by 6
Self-citationRole of DNA methylation‐based mitotic ageing indices in oral cancer development and recurrence
Ambatipudi, S., Inchanalkar, M., & Mahimkar, M. B. (2023) · Oral Diseases · doi:10.1111/odi.14764 · Cited by 6
Lysine Methyltransferase NSD1 and Cancers: Any Role in Melanoma?
Krossa, I., Strub, T., Aplin, A. E., Ballotti, R., & Bertolotto, C. (2022) · Cancers · doi:10.3390/cancers14194865 · Cited by 6
Teschendorff, A. E. (2018) · Aging · doi:10.18632/aging.101533 · Cited by 6
Self-citationDNA Methylation in Aging and Alzheimer's Disease
Cheng, R., Shu, J., Chen, H., Li, M., Cheng, X., & Liu, L. (2024) · Human Brain · doi:10.37819/hb.3.2027 · Cited by 5
Hartmann, M., Schönung, M., Rajak, J., Maurer, V., Hai, L., Bauer, K., Hakobyan, M., Stäble, S., Langstein, J., Jardine, L., et al. (2025) · Blood Cancer Discovery · doi:10.1158/2643-3230.bcd-25-0246 · Cited by 9
Metadata
- Authors
- Yang, Z., Wong, A., Kuh, D., Paul, D. S., Rakyan, V. K., Leslie, R. D., Zheng, S. C., Widschwendter, M., Beck, S., & Teschendorff, A. E.
- Affiliations
- Chinese Academy of Sciences (CN)
- MRC Unit for Lifelong Health and Ageing (GB)
- University College London (GB)
- Queen Mary University of London (GB)
- Corresponding author
- Teschendorff, Andrew E.
- ORCID
- Venue
- Genome Biology
- Published
- 2016-10-03
- Volume
- 17
- Issue
- 1
- Pages
- 205-205
- ISSN
- 1465-6906 (ISSN-L)
- 1474-760X
- PMC
- PMC5046977
- OpenAlex
- W2529317472
- Cited by
- 325
- References
- 71
- Citations by year
- 2026: 31 · 2025: 52 · 2024: 43 · 2023: 40 · 2022: 53 · 2021: 32 · 2020: 25 · 2019: 17 · 2018: 18 · 2017: 12 · 2016: 1
- FWCI
- 8.27
- Type
- journal article
- Language
- en
- Open access
- gold
- doi.org
- Licence
- cc-by
- Locations
- Genome biology (publishedVersion, cc-by)
- PubMed Central (publishedVersion, cc-by)
- PubMed (publishedVersion)
- UCL Discovery (University College London) (submittedVersion)
- Queen Mary Research Online (Queen Mary University of London) (submittedVersion, cc-by)
- Apollo (University of Cambridge) (submittedVersion, cc-by)
- Apollo (cc-by)
- Funders
- Royal Society (NAF 164914)
- National Science Foundation of China (NSFC 31571359)
- Topics
- Life Sciences › Biochemistry, Genetics and Molecular Biology › Molecular Biology › Epigenetics and DNA Methylation
- Life Sciences › Biochemistry, Genetics and Molecular Biology › Cancer Research › Cancer Genomics and Diagnostics
- Life Sciences › Biochemistry, Genetics and Molecular Biology › Cell Biology › Telomeres, Telomerase, and Senescence
- Keywords
- epigenetic clocks, DNA methylation, stem cell division, cancer risk, promoter CpG sites, fetal tissue, carcinogen exposure, precancerous lesions, cancer risk stratification
- MeSH terms
- Aging, Humans, Mitosis, Mitotic Index, Models, Theoretical, Neoplasms, Promoter Regions, Genetic, Neoplastic Stem Cells, Gene Expression Regulation, Neoplastic, CpG Islands, DNA Methylation, Epigenesis, Genetic, High-Throughput Nucleotide Sequencing, Polycomb-Group Proteins
About these checks
Registry, retraction, Cites and statistics results are computed, not judged, with one exception: a printed reference that no index lists is read once by a model before it counts as a citation error. Claims are extracted by a model and kept only when their quote appears verbatim in the text; each cited source is then checked, with a model’s help, for whether it says what the claim relies on. Those verdicts can be wrong — read the claim’s quote and the cited source before relying on one.
Statistics and arithmetic are recomputed, not judged.
Confidence bands are shown only for fields calibrated on our annotated test set. None is calibrated yet, so no band is shown.
What counts as a claim ›How we measure confidence ›How we check this ›
Are you an author, or do you see a problem with this page? Request a review
