CoChat

Single-cell transcriptomics unveils gene regulatory network plasticity

Open access

Published version of a preprint

The DOI matches its Crossref record; 67 of the 68 references it cites were found in a registry or an index.

Abstract

BACKGROUND: Single-cell RNA sequencing (scRNA-seq) plays a pivotal role in our understanding of cellular heterogeneity. Current analytical workflows are driven by categorizing principles that consider cells as individual entities and classify them into complex taxonomies. RESULTS: We devise a conceptually different computational framework based on a holistic view, where single-cell datasets are used to infer global, large-scale regulatory networks. We develop correlation metrics that are specifically tailored to single-cell data, and then generate, validate, and interpret single-cell-derived regulatory networks from organs and perturbed systems, such as diabetes and Alzheimer's disease. Using tools from graph theory, we compute an unbiased quantification of a gene's biological relevance and accurately pinpoint key players in organ function and drivers of diseases. CONCLUSIONS: Our approach detects multiple latent regulatory changes that are invisible to single-cell workflows based on clustering or differential expression analysis, significantly broadening the biological insights that can be obtained with this leading technology.

Overview

The claims and statistics of this paper haven’t been checked yet.

Free: it reads the open-access text and checks the first 5 claims that cite a source we can check. Create a free account to check every claim.

A few free checks a day · papers already verified open instantly · results are public

Integrity signals

Registry

Crossref · 10.1186/s13059-019-1713-4

Cites

67 of 67 references verified0 citation errors · 0 not checkable

Statistics

Figures

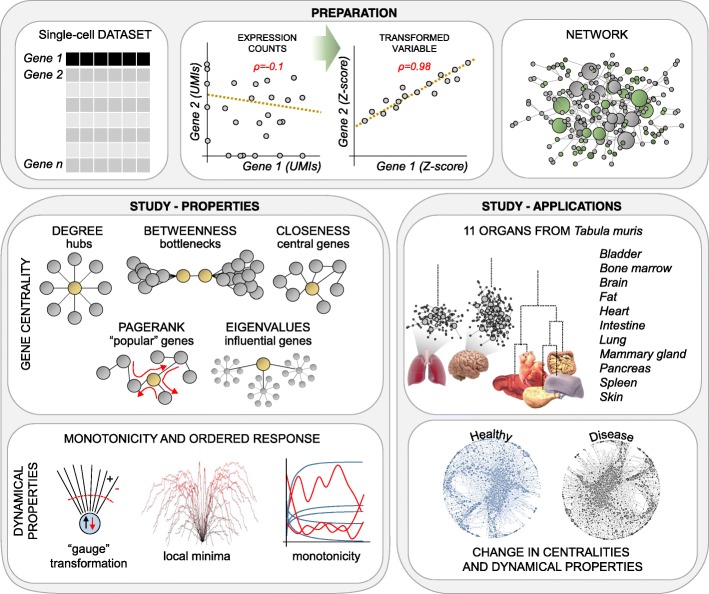
Fig. 1 Overview of the computational framework. Preparation: A change of variable (from expression values to Z-score) is used to detect otherwise hidden correlations between genes in single-cell datasets, ultimately allowing us to infer the global regulatory network. Gene centrality: Biological importance of genes is quantified using concepts from graph theory. Dynamical properties: We characterize the putative dynamical behavior of the regulatory networks by measuring the monotonicity. Applications: We generated, compared, and characterized the networks of 11 organs in the mouse (Tabula Muris), in the pancreas from healthy and type 2 diabetes human subjects, and in a mouse model of Alzheimer’s disease
Fig. 1 Overview of the computational framework. Preparation: A change of variable (from expression values to Z-score) is used to detect otherwise hidden correlations between genes in single-cell datasets, ultimately allowing us to infer the global regulatory network. Gene centrality: Biological importance of genes is quantified using concepts from graph theory. Dynamical properties: We characterize the putative dynamical behavior of the regulatory networks by measuring the monotonicity. Applications: We generated, compared, and characterized the networks of 11 organs in the mouse (Tabula Muris), in the pancreas from healthy and type 2 diabetes human subjects, and in a mouse model of Alzheimer’s diseaseCC BY · PubMed Central
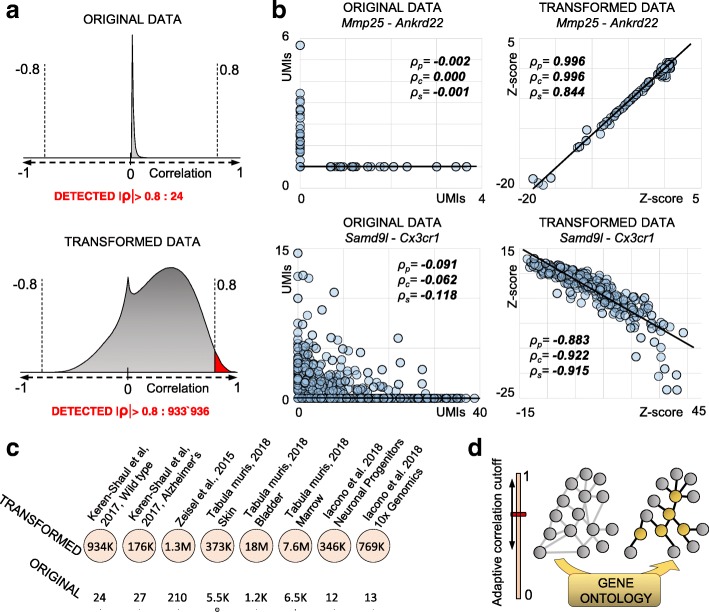
Fig. 2 A metric tailored to single-cell data allows detection of hidden correlations. a Distribution of Pearson correlations ρp in normalized expression data (7697 microglia cells) or in the Z-score space. We detect only 24 correlations |ρp| > 0.8 in the first scenario, but almost one million |ρp| > 0.8 in the Z-score space. b Examples of correlations using either expression values or Z-score-transformed data (ρp Pearson, ρc Cosine, ρs Spearman). Due to drop-out events and other artifacts, the positive correlation between Mmp25 and Ankrd22 is only exposed using Z-scores. Similarly for the negative correlation between Samd9l and Cx3cr1. c Comparison of detected correlations |ρp| > 0.8 using either original expression values or Z-score-transformed data across different scRNA-seq technologies, sequencing depths (from 625 [12] to 6480 [13] average detected genes per cell), and source material. d An adaptive correlation cutoff and GO annotations are used to infer the regulatory networks from correlation data (see the “Methods” section)
Fig. 2 A metric tailored to single-cell data allows detection of hidden correlations. a Distribution of Pearson correlations ρp in normalized expression data (7697 microglia cells) or in the Z-score space. We detect only 24 correlations |ρp| > 0.8 in the first scenario, but almost one million |ρp| > 0.8 in the Z-score space. b Examples of correlations using either expression values or Z-score-transformed data (ρp Pearson, ρc Cosine, ρs Spearman). Due to drop-out events and other artifacts, the positive correlation between Mmp25 and Ankrd22 is only exposed using Z-scores. Similarly for the negative correlation between Samd9l and Cx3cr1. c Comparison of detected correlations |ρp| > 0.8 using either original expression values or Z-score-transformed data across different scRNA-seq technologies, sequencing depths (from 625 [12] to 6480 [13] average detected genes per cell), and source material. d An adaptive correlation cutoff and GO annotations are used to infer the regulatory networks from correlation data (see the “Methods” section)CC BY · PubMed Central
Fig. 3 Technical benchmarks. a Left axis, amounts of detected correlations (sensitivity) decrease with the number of clusters. Right axis, mean and median of co-expression (specificity) increase with the number of clusters. b Distribution plots of the co-expression (Jaccard index) for 3 (top) and 48 (bottom) clusters. c Distribution plots showing all the correlations of the testing dataset (gray) compared with a selected subset (those predicted by the training dataset). d Pie chart, composition of the predicted correlations in the testing dataset (5000 cells). e Relationship between size of the set and resulting predicted correlations with ρ > 0.6 (mean ± S.E.M.). f Scatter plot of correlations inferred from the original counts against those inferred from imputed counts (scImpute). The two distributions are correlated with Pearson ρ = 0.983. g AUC of inferred correlations, simulated data, 10 independent repetitions for each sparsity (error bars S.E.M.). h ROC curves for 10 simulations with the highest sparsity of 97% are above the random ROC line. i Example of the validation of Eomes neighbors in the brain network. For each edge, we computed fold enrichment (proportional to edge width, highest Otx2 with 9.87, lowest Adcy7 with 0.83) and a p value (labels). In the case of Eomes, all edges but one (Adcy7) are validated with p < 0.05. j Overall distribution of edge-wise fold enrichment in the brain network was biased towards positive values, suggesting that neighboring genes are regulated together in perturbed systems. k Brain network, percentage of validated edges with p < 0.05 (y-axis) filtered by the number of MSigDB occurrences (x-axis). Higher percentages of validated (p < 0.05) edges are obtained by considering only edges with high occurrences
Fig. 3 Technical benchmarks. a Left axis, amounts of detected correlations (sensitivity) decrease with the number of clusters. Right axis, mean and median of co-expression (specificity) increase with the number of clusters. b Distribution plots of the co-expression (Jaccard index) for 3 (top) and 48 (bottom) clusters. c Distribution plots showing all the correlations of the testing dataset (gray) compared with a selected subset (those predicted by the training dataset). d Pie chart, composition of the predicted correlations in the testing dataset (5000 cells). e Relationship between size of the set and resulting predicted correlations with ρ > 0.6 (mean ± S.E.M.). f Scatter plot of correlations inferred from the original counts against those inferred from imputed counts (scImpute). The two distributions are correlated with Pearson ρ = 0.983. g AUC of inferred correlations, simulated data, 10 independent repetitions for each sparsity (error bars S.E.M.). h ROC curves for 10 simulations with the highest sparsity of 97% are above the random ROC line. i Example of the validation of Eomes neighbors in the brain network. For each edge, we computed fold enrichment (proportional to edge width, highest Otx2 with 9.87, lowest Adcy7 with 0.83) and a p value (labels). In the case of Eomes, all edges but one (Adcy7) are validated with p < 0.05. j Overall distribution of edge-wise fold enrichment in the brain network was biased towards positive values, suggesting that neighboring genes are regulated together in perturbed systems. k Brain network, percentage of validated edges with p < 0.05 (y-axis) filtered by the number of MSigDB occurrences (x-axis). Higher percentages of validated (p < 0.05) edges are obtained by considering only edges with high occurrencesCC BY · PubMed Central
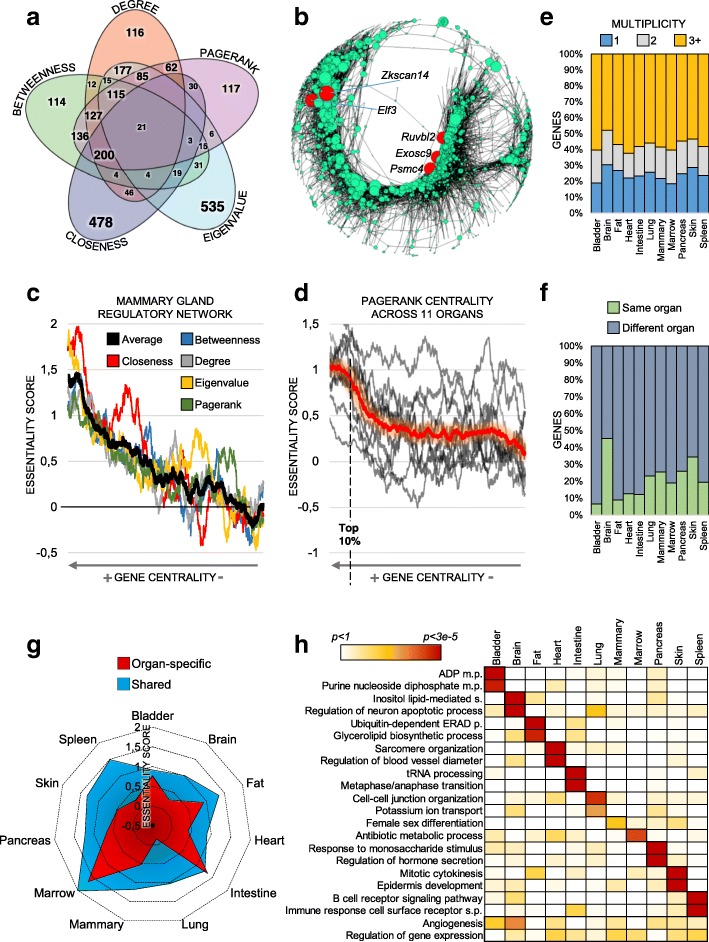
Fig. 4 Regulatory networks inferred from 11 organs of the mouse body. a Marginal overlap of genes of different centralities in the brain network (top 20% genes). Additional organs in Additional file 1: Figure S5. b Visual representation of the mammary gland network, in which node size is proportional to pagerank centrality. The top five central nodes (red color) are all genes classified by OGEE as biologically essential. c Genes (2403) of the mammary gland regulatory network sorted by centrality. Increasing centrality corresponds to higher biological essentiality for all centrality measures. d Genes sorted according to their pagerank centrality. High centrality (roughly top 10% of genes) corresponds to high biological essentiality. e The central genes (here, pagerank, top 20%) of each organ classified by their multiplicity. Multiplicity = 1 means that they are central only in that organ, whereas multiplicity = 2(3+) means that they are also central in additional organs (total of 2, or 3 or more, organs). Additional organs in Additional file 1: Figure S3B. f Analysis of genes which are (i) central in at least one organ (pagerank) and (ii) upregulated in one organ compared to others. Intriguingly, most of the genes central in a given organ are actually expressed to a significantly higher extent (p < 0.05) in a different organ. Additional organs in Additional file 1: Figure S3D. g Radar plot of the pagerank ES score for the central genes of each organ (top 20%), partitioned in either organ-specific or shared (multiplicity 3+). The latter have higher biological essentiality and reach a significant p value for all organs (random permutations, p < 0.005 Additional file 1: Figure S3C). h Heatmap of GO enrichments using degree centrality
Fig. 4 Regulatory networks inferred from 11 organs of the mouse body. a Marginal overlap of genes of different centralities in the brain network (top 20% genes). Additional organs in Additional file 1: Figure S5. b Visual representation of the mammary gland network, in which node size is proportional to pagerank centrality. The top five central nodes (red color) are all genes classified by OGEE as biologically essential. c Genes (2403) of the mammary gland regulatory network sorted by centrality. Increasing centrality corresponds to higher biological essentiality for all centrality measures. d Genes sorted according to their pagerank centrality. High centrality (roughly top 10% of genes) corresponds to high biological essentiality. e The central genes (here, pagerank, top 20%) of each organ classified by their multiplicity. Multiplicity = 1 means that they are central only in that organ, whereas multiplicity = 2(3+) means that they are also central in additional organs (total of 2, or 3 or more, organs). Additional organs in Additional file 1: Figure S3B. f Analysis of genes which are (i) central in at least one organ (pagerank) and (ii) upregulated in one organ compared to others. Intriguingly, most of the genes central in a given organ are actually expressed to a significantly higher extent (p < 0.05) in a different organ. Additional organs in Additional file 1: Figure S3D. g Radar plot of the pagerank ES score for the central genes of each organ (top 20%), partitioned in either organ-specific or shared (multiplicity 3+). The latter have higher biological essentiality and reach a significant p value for all organs (random permutations, p < 0.005 Additional file 1: Figure S3C). h Heatmap of GO enrichments using degree centralityCC BY · PubMed Central
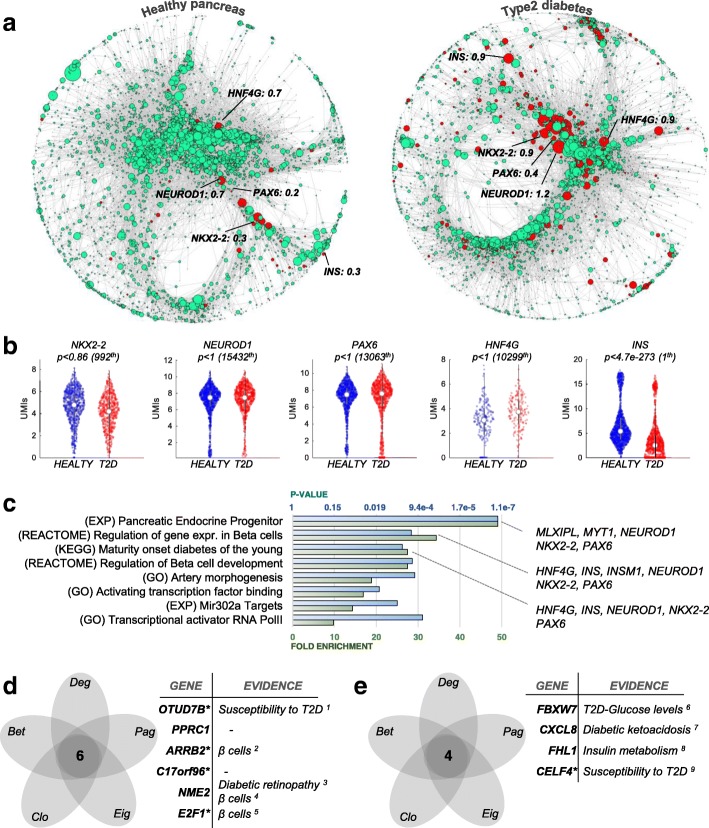
Fig. 5 Changes in centralities and dynamical properties in the pancreas of type 2 diabetes (T2D). a Network from healthy and T2D subjects, in which node size is proportional to its pagerank centrality. In red are the nodes which are present in both networks and have higher pagerank in T2D (84 nodes). b Violin plots, p values, and ranking in differential expression in healthy vs. T2D tissue using all cells (1313 control cells vs 1178 T2D cells). c GO and MSigDB enrichments showing overrepresentation of diabetes-related functions in nodes with increased pagerank. d, e Several genes showing simultaneous decrease (d) or increase (e) of the five centralities have been implicated in diabetes
Fig. 5 Changes in centralities and dynamical properties in the pancreas of type 2 diabetes (T2D). a Network from healthy and T2D subjects, in which node size is proportional to its pagerank centrality. In red are the nodes which are present in both networks and have higher pagerank in T2D (84 nodes). b Violin plots, p values, and ranking in differential expression in healthy vs. T2D tissue using all cells (1313 control cells vs 1178 T2D cells). c GO and MSigDB enrichments showing overrepresentation of diabetes-related functions in nodes with increased pagerank. d, e Several genes showing simultaneous decrease (d) or increase (e) of the five centralities have been implicated in diabetesCC BY · PubMed Central
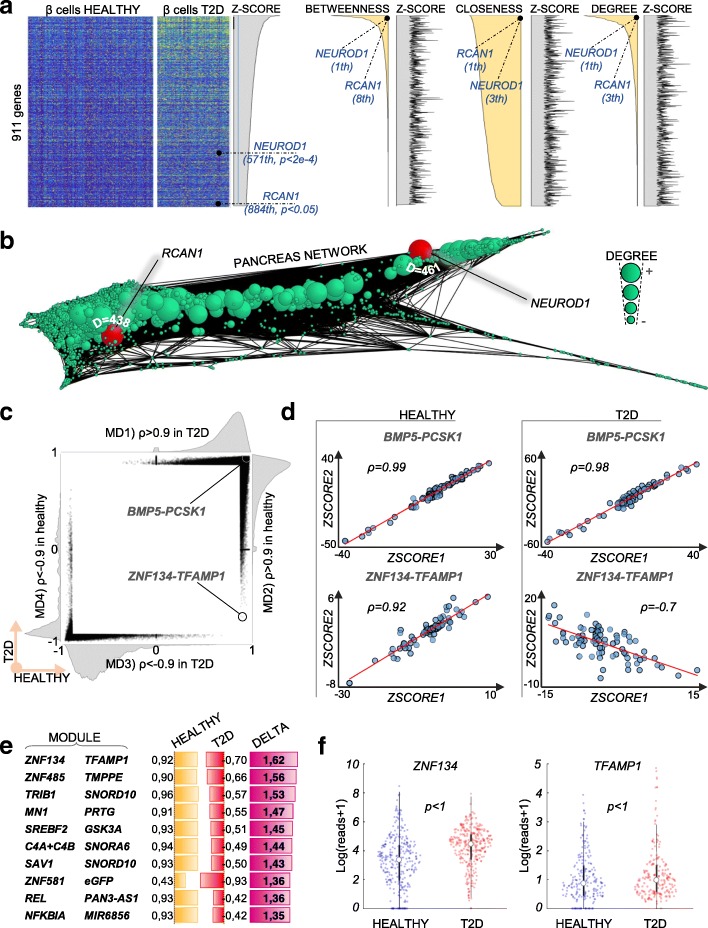
Fig. 6 Prediction of gene importance in DE data and directional changes in correlations. a Heatmap of normalized expression values of 911 genes found significantly upregulated in T2D β cells compared to healthy β cells (p < 0.05) sorted by decreasing Z-score (i.e., increasing p values) or decreasing centralities (betweenness, closeness, and degree). Biological importance of NEUROD1 and RCAN1 is highlighted by their high centrality but not by their DE Z-scores. In general, correlation between DE Z-scores and centrality is marginal, as shown by the erratic area plots of Z-scores sorted by centrality. b Pancreas regulatory network generated using all cells (both healthy and T2D), node size proportional to its degree. NEUROD1 and RCAN1 have high degree centrality (461 and 438 respectively). c Scatter plot and marginal distributions (MD1–4) of all pairwise gene correlations with |ρ| > 0.9 (329,046 couples). The strong bias in the marginal distributions (especially MD1, 2, 4) indicates an overall similarity of correlations between healthy and T2D pancreas. d An example of a highly conserved correlation (BMP5-PCSK1) against the strongest inversion (ZNF134-TFAMP1). e Overview of top 10 inversions of correlations. f Neither ZNF134 nor TFAMP1 display a significant change of expression (DE)
Fig. 6 Prediction of gene importance in DE data and directional changes in correlations. a Heatmap of normalized expression values of 911 genes found significantly upregulated in T2D β cells compared to healthy β cells (p < 0.05) sorted by decreasing Z-score (i.e., increasing p values) or decreasing centralities (betweenness, closeness, and degree). Biological importance of NEUROD1 and RCAN1 is highlighted by their high centrality but not by their DE Z-scores. In general, correlation between DE Z-scores and centrality is marginal, as shown by the erratic area plots of Z-scores sorted by centrality. b Pancreas regulatory network generated using all cells (both healthy and T2D), node size proportional to its degree. NEUROD1 and RCAN1 have high degree centrality (461 and 438 respectively). c Scatter plot and marginal distributions (MD1–4) of all pairwise gene correlations with |ρ| > 0.9 (329,046 couples). The strong bias in the marginal distributions (especially MD1, 2, 4) indicates an overall similarity of correlations between healthy and T2D pancreas. d An example of a highly conserved correlation (BMP5-PCSK1) against the strongest inversion (ZNF134-TFAMP1). e Overview of top 10 inversions of correlations. f Neither ZNF134 nor TFAMP1 display a significant change of expression (DE)CC BY · PubMed Central
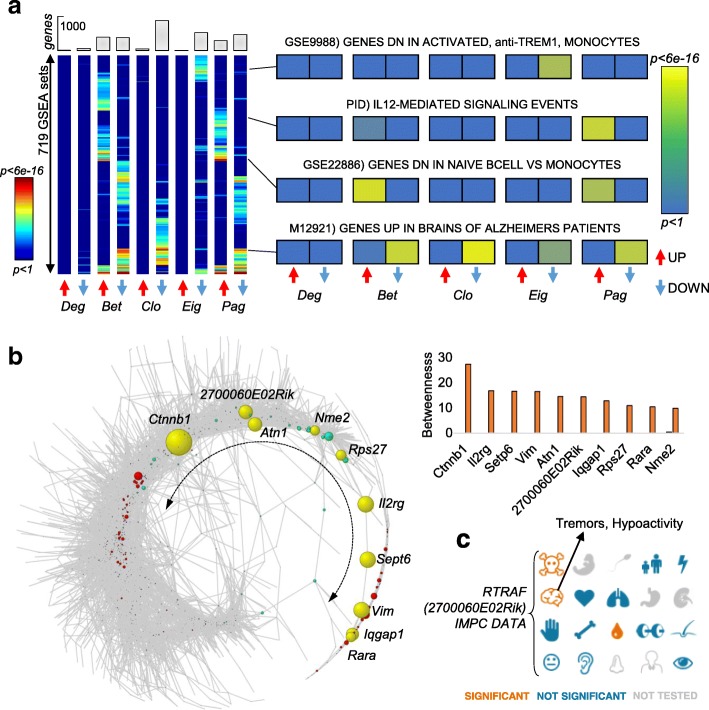
Fig. 7 Rewiring of regulatory network in Alzheimer’s disease microglia introduces information bottlenecks. a MSigDB enrichments for 10 lists of genes with altered centrality in AD compared to control network (5 centralities, 719 MSigDB terms were found to be enriched with p < 0.05 in at least one entry). The results show that the tested centralities provide insights into different functional pathways. b The AD regulatory network follows a circular shape in which the nodes along the terminal tail (yellow genes) become bottlenecks, i.e., acquire increased betweenness. The exact increase in betweenness is represented in the histogram. c International Mouse Phenotyping Consortium data for the transcript 2700060E02Rik, alias Rtraf. Homozygous 2700060E02Rik knockout is associated with embryonic lethality prior to tooth bud stage and heterozygous 2700060E02Rik knockout is associated with tremors, hypoactivity, and increased eosinophil cell number
Fig. 7 Rewiring of regulatory network in Alzheimer’s disease microglia introduces information bottlenecks. a MSigDB enrichments for 10 lists of genes with altered centrality in AD compared to control network (5 centralities, 719 MSigDB terms were found to be enriched with p < 0.05 in at least one entry). The results show that the tested centralities provide insights into different functional pathways. b The AD regulatory network follows a circular shape in which the nodes along the terminal tail (yellow genes) become bottlenecks, i.e., acquire increased betweenness. The exact increase in betweenness is represented in the histogram. c International Mouse Phenotyping Consortium data for the transcript 2700060E02Rik, alias Rtraf. Homozygous 2700060E02Rik knockout is associated with embryonic lethality prior to tooth bud stage and heterozygous 2700060E02Rik knockout is associated with tremors, hypoactivity, and increased eosinophil cell numberCC BY · PubMed Central

Verification

Claims the paper makes

The claims and statistics of this paper haven’t been checked yet.

Free: it reads the open-access text and checks the first 5 claims that cite a source we can check. Create a free account to check every claim.

A few free checks a day · papers already verified open instantly · results are public

Claims other papers make about this one

Each is checked against this paper’s own text: does it say what the citing paper says it does?

Self-check

Percentages, sums and reported differences re-computed from the paper’s own numbers.

The self-check needs the paper’s full text.

Citations

Cites

Show all 67 references

Cited by

See all 219

Metadata

Authors
Iacono, G., Massoni-Badosa, R., & Heyn, H.
Affiliations
  • Barcelona Institute of Science and Technology (ES)
  • Universitat Pompeu Fabra (ES)
Corresponding author
  • Iacono, Giovanni
  • Heyn, Holger
Venue
Genome Biology
Published
2019-06-04
Volume
20
Issue
1
Pages
110-110
ISSN
  • 1465-6906 (ISSN-L)
  • 1474-760X
OpenAlex
W2952382191
Cited by
218
References
68
Citations by year
2026: 17 · 2025: 26 · 2024: 18 · 2023: 35 · 2022: 38 · 2021: 43 · 2020: 32 · 2019: 9
FWCI
10.50
Type
journal article
Language
en
Open access
Licence
Locations
  • Genome biology (publishedVersion, cc-by)
  • PubMed Central (publishedVersion, cc-by)
  • PubMed (publishedVersion)
  • DOAJ (DOAJ: Directory of Open Access Journals) (submittedVersion, cc-by-sa)
  • Repositori digital de la UPF (Universitat Pompeu Fabra) (submittedVersion, cc-by)
Funders
  • Instituto de Salud Carlos III (CP14/00229)
  • Ministerio de Economía, Industria y Competitividad, Gobierno de España (SAF2017-89109-P)
Topics
  • Life Sciences › Biochemistry, Genetics and Molecular Biology › Molecular Biology › Single-cell and spatial transcriptomics
  • Life Sciences › Biochemistry, Genetics and Molecular Biology › Molecular Biology › Gene Regulatory Network Analysis
  • Life Sciences › Biochemistry, Genetics and Molecular Biology › Molecular Biology › Bioinformatics and Genomic Networks
Keywords
gene regulatory networks, single-cell transcriptomics, regulatory network inference, correlation measures, network plasticity, graph theory, diabetes mellitus, Alzheimer's disease, cellular heterogeneity, organ function
MeSH terms
Alzheimer Disease, Animals, Diabetes Mellitus, Type 2, Feasibility Studies, Humans, Mice, Transgenic, Genes, Essential, Genomics, Gene Regulatory Networks, Single-Cell Analysis, Transcriptome

About these checks

Registry, retraction, Cites and statistics results are computed, not judged, with one exception: a printed reference that no index lists is read once by a model before it counts as a citation error. Claims are extracted by a model and kept only when their quote appears verbatim in the text; each cited source is then checked, with a model’s help, for whether it says what the claim relies on. Those verdicts can be wrong — read the claim’s quote and the cited source before relying on one.

Statistics and arithmetic are recomputed, not judged.

Confidence bands are shown only for fields calibrated on our annotated test set. None is calibrated yet, so no band is shown.

What counts as a claim ›How we measure confidence ›How we check this ›

Are you an author, or do you see a problem with this page? Request a review

How to cite

Cite CoChat for the checks on this page, and the paper for its own findings.

This page
CoChat. (2026). Citation check: Single-cell transcriptomics unveils gene regulatory network plasticity. https://app.cochat.ai/papers/10.1186/s13059-019-1713-4
The paper
Iacono, G., Massoni-Badosa, R., & Heyn, H. (2019). Single-cell transcriptomics unveils gene regulatory network plasticity. Genome Biology. https://doi.org/10.1186/s13059-019-1713-4

Data sources

Bibliographic data: Semantic Scholar, OpenAlex, Crossref.

Contains information from the Semantic Scholar Academic Graph Datasets, made available under the ODC Attribution License (ODC-BY 1.0).

Semantic Scholar’s data is described in: Kinney, R., et al. (2023). The Semantic Scholar Open Data Platform. arXiv:2301.10140.