

MUON: multimodal omics analysis framework
Open accessPublished version of a preprint
The DOI matches its Crossref record; 60 of the 60 references it cites were found in a registry or an index.
Abstract
Advances in multi-omics have led to an explosion of multimodal datasets to address questions from basic biology to translation. While these data provide novel opportunities for discovery, they also pose management and analysis challenges, thus motivating the development of tailored computational solutions. Here, we present a data standard and an analysis framework for multi-omics, MUON, designed to organise, analyse, visualise, and exchange multimodal data. MUON stores multimodal data in an efficient yet flexible and interoperable data structure. MUON enables a versatile range of analyses, from data preprocessing to flexible multi-omics alignment.
Overview
The claims and statistics of this paper haven’t been checked yet.
Free: it reads the open-access text and checks the first 5 claims that cite a source we can check. Create a free account to check every claim.
Integrity signals
Registry
Cites
Statistics
Figures
Verification
Claims the paper makes
The claims and statistics of this paper haven’t been checked yet.
Free: it reads the open-access text and checks the first 5 claims that cite a source we can check. Create a free account to check every claim.
Claims other papers make about this one
Each is checked against this paper’s own text: does it say what the citing paper says it does?
In the citing paper
“The sharing of spatial data is hampered by large file sizes and non-standardized analysis pipelines58.”
From scPerturb: harmonized single-cell perturbation data (2024) · cites this paper as [58]
In the citing paper
“This can be achieved by summing up counts within genes and a certain distance upstream of the TSS136,143,150.”
From Best practices for single-cell analysis across modalities (2023) · cites this paper as [150]
Self-check
Percentages, sums and reported differences re-computed from the paper’s own numbers.
The self-check needs the paper’s full text.
Citations
Cites
R: A Language and Environment for Statistical Computing
R Core Team (2025) · doi:10.32614/r.manuals · Cited by 352,181
Scikit-learn: Machine Learning in Python
Pedregosa, F., Varoquaux, G., Gramfort, A., Michel, V., Thirion, B., Grisel, O., Blondel, M., Müller, A., Nothman, J., Louppe, G., et al. (2012) · arXiv · doi:10.48550/arxiv.1201.0490 · Cited by 71,016
Matplotlib: a 2D graphics environment
Hunter, J. D. (2007) · Computing in Science & Engineering · doi:10.1109/mcse.2007.55 · Cited by 39,249
SciPy 1.0: fundamental algorithms for scientific computing in Python
Virtanen, P., Gommers, R., Oliphant, T. E., Haberland, M., Reddy, T., Cournapeau, D., Burovski, E., Peterson, P., Weckesser, W., Bright, J., et al. (2020) · Nature Methods · doi:10.1038/s41592-019-0686-2 · Cited by 38,430
Harris, C. R., Millman, K. J., van der Walt, S. J., Gommers, R., Virtanen, P., Cournapeau, D., Wieser, E., Taylor, J., Berg, S., Smith, N. J., et al. (2020) · Nature · doi:10.1038/s41586-020-2649-2 · Cited by 23,826
The FAIR Guiding Principles for scientific data management and stewardship
Wilkinson, M. D., Dumontier, M., Aalbersberg, I. J., Appleton, G., Axton, M., Baak, A., Blomberg, N., Boiten, J.-W., da Silva Santos, L. B., Bourne, P. E., et al. (2016) · Scientific Data · doi:10.1038/sdata.2016.18 · Cited by 18,423
Harris, C., Millman, K., van der Walt, S., Gommers, R., Virtanen, P., Cournapeau, D., Wieser, E., Taylor, J., Berg, S., Smith, N., et al. (2020) · RePEc: Research Papers in Economics · Cited by 17,844
Integrated analysis of multimodal single-cell data
Hao, Y., Hao, S., Andersen-Nissen, E., Mauck, W. M., Zheng, S., Butler, A., Lee, M. J., Wilk, A. J., Darby, C., Zagar, M., et al. (2020) · doi:10.1101/2020.10.12.335331 · Cited by 15,508
SciPy 1.0: fundamental algorithms for scientific computing in Python
Virtanen, P., Gommers, R., Oliphant, T. E., Haberland, M., Reddy, T., Cournapeau, D., Burovski, E., Peterson, P., Weckesser, W., Bright, J., et al. (2019) · Apollo - University of Cambridge Repository · doi:10.17863/cam.64134 · Cited by 10,460
SCANPY: large-scale single-cell gene expression data analysis
Wolf, F. A., Angerer, P., & Theis, F. J. (2018) · Genome Biology · doi:10.1186/s13059-017-1382-0 · Cited by 8,881 · cited 8×
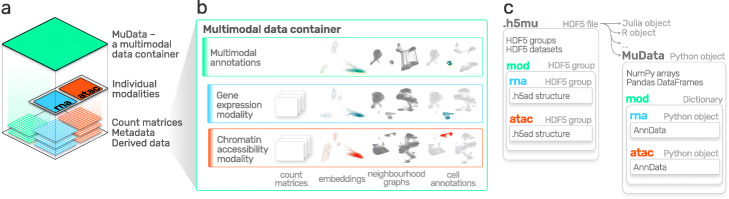
“At the core of the framework is MuData , an open data structure standard, which is compatible with and extends previous data formats for single omics [9, 17].”
BackgroundMethodInfluential
Research works printed but not linked: 3
- Van Rossum G, Drake FL Jr. Python tutorial. Centrum voor Wiskunde en Informatica Amsterdam; 1995.
- McKinney W. Others. pandas: a foundational Python library for data analysis and statistics. Python High Perform Sci Comput. 2011;14:1–9.
- Collette A. Python and HDF5: unlocking scientific data. "O'Reilly Media, Inc."; 2013.
Cited by
Methods and applications for single-cell and spatial multi-omics
Vandereyken, K., Sifrim, A., Thienpont, B., & Voet, T. (2023) · Nature Reviews Genetics · doi:10.1038/s41576-023-00580-2 · Cited by 1,244
Best practices for single-cell analysis across modalities
Heumos, L., Schaar, A. C., Lance, C., Litinetskaya, A., Drost, F., Zappia, L., Lücken, M. D., Strobl, D. C., Henao, J., Curion, F., et al. (2023) · Nature Reviews Genetics · doi:10.1038/s41576-023-00586-w · Cited by 1,051
anndata: Access and store annotated data matrices
Virshup, I., Rybakov, S., Theis, F. J., Angerer, P., & Wolf, F. A. (2024) · Journal of Open Source Software · doi:10.21105/joss.04371 · Cited by 485
The scverse project provides a computational ecosystem for single-cell omics data analysis
Virshup, I., Bredikhin, D., Heumos, L., Palla, G., Sturm, G., Gayoso, A., Kats, I., Koutrouli, M., Community, S., Angerer, P., et al. (2023) · Nature Biotechnology · doi:10.1038/s41587-023-01733-8 · Cited by 341
Self-citationAutonomous biomedical research with an artificial intelligence agent
Huang, K., Zhang, S., Wang, H., Qu, Y., Lu, Y., Li, R., Roohani, Y., Qiu, L., Cao, S., Li, G. L., et al. (2026) · Science · doi:10.1126/science.adz4351 · Cited by 349
Metadata
- Authors
- Bredikhin, D., Kats, I., & Stegle, O.
- Affiliations
- German Cancer Research Center (DE)
- Corresponding author
- Bredikhin, Danila
- Stegle, Oliver
- Venue
- Genome Biology
- Published
- 2022-02-01
- Volume
- 23
- Issue
- 1
- Pages
- 42-42
- ISSN
- 1465-6906 (ISSN-L)
- 1474-760X
- PMC
- PMC8805324
- OpenAlex
- W4210607772
- Cited by
- 216
- References
- 58
- Citations by year
- 2026: 65 · 2025: 59 · 2024: 54 · 2023: 30 · 2022: 7
- FWCI
- 12.32
- Type
- journal article
- Language
- en
- Open access
- gold
- doi.org
- Licence
- cc-by
- creativecommons.org/licenses/by/4.0 (tdm)
- creativecommons.org/licenses/by/4.0 (vor)
- Locations
- Genome biology (publishedVersion, cc-by)
- bioRxiv (Cold Spring Harbor Laboratory) (acceptedVersion, cc-by-nd)
- PubMed Central (publishedVersion, cc-by)
- PubMed (publishedVersion)
- DOAJ (DOAJ: Directory of Open Access Journals) (submittedVersion, cc-by-sa)
- Funders
- darwin trust (Darwin Trust Fellowship)
- European Molecular Biology Laboratory (EMBL)
- Topics
- Life Sciences › Biochemistry, Genetics and Molecular Biology › Molecular Biology › Bioinformatics and Genomic Networks
- Life Sciences › Biochemistry, Genetics and Molecular Biology › Molecular Biology › Genomics and Phylogenetic Studies
- Social Sciences › Decision Sciences › Information Systems and Management › Scientific Computing and Data Management
- Keywords
- multi-omics, multimodal data, data standards, data interoperability, data structures, data exchange, data preprocessing, data visualization, muons
- MeSH terms
- Mesons, Computational Biology
About these checks
Registry, retraction, Cites and statistics results are computed, not judged, with one exception: a printed reference that no index lists is read once by a model before it counts as a citation error. Claims are extracted by a model and kept only when their quote appears verbatim in the text; each cited source is then checked, with a model’s help, for whether it says what the claim relies on. Those verdicts can be wrong — read the claim’s quote and the cited source before relying on one.
Statistics and arithmetic are recomputed, not judged.
Confidence bands are shown only for fields calibrated on our annotated test set. None is calibrated yet, so no band is shown.
What counts as a claim ›How we measure confidence ›How we check this ›
Are you an author, or do you see a problem with this page? Request a review
How to cite
Cite CoChat for the checks on this page, and the paper for its own findings.
- This page
- CoChat. (2026). Citation check: MUON: multimodal omics analysis framework. https://app.cochat.ai/papers/10.1186/s13059-021-02577-8
- The paper
- Bredikhin, D., Kats, I., & Stegle, O. (2022). MUON: multimodal omics analysis framework. Genome Biology. https://doi.org/10.1186/s13059-021-02577-8
Data sources
Bibliographic data: Semantic Scholar, OpenAlex, Crossref.
Contains information from the Semantic Scholar Academic Graph Datasets, made available under the ODC Attribution License (ODC-BY 1.0).
Semantic Scholar’s data is described in: Kinney, R., et al. (2023). The Semantic Scholar Open Data Platform. arXiv:2301.10140.
