

The DOI matches its Crossref record; 117 of the 117 references it cites were found in a registry or an index.
Statistical and machine learning methods for spatially resolved transcriptomics data analysis
Open accessAbstract
The recent advancement in spatial transcriptomics technology has enabled multiplexed profiling of cellular transcriptomes and spatial locations. As the capacity and efficiency of the experimental technologies continue to improve, there is an emerging need for the development of analytical approaches. Furthermore, with the continuous evolution of sequencing protocols, the underlying assumptions of current analytical methods need to be re-evaluated and adjusted to harness the increasing data complexity. To motivate and aid future model development, we herein review the recent development of statistical and machine learning methods in spatial transcriptomics, summarize useful resources, and highlight the challenges and opportunities ahead.
Overview
The claims and statistics of this paper haven’t been checked yet.
Run the check — free, no account needed. It reads the open-access text and checks the sources it cites.
Integrity signals
Registry
Cites
Statistics
Figures
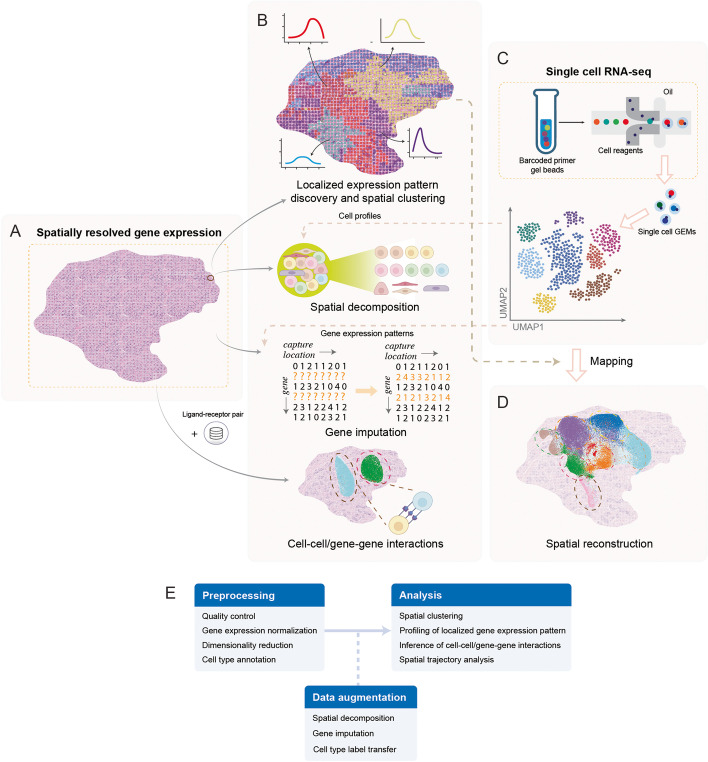
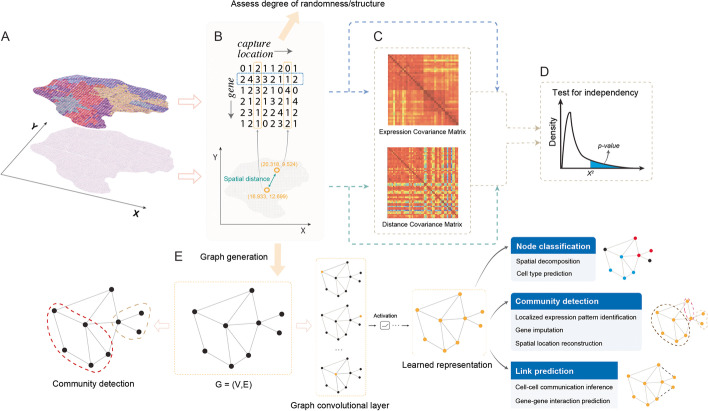
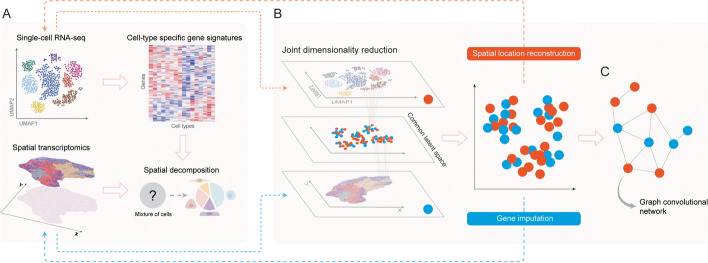
Verification
Claims the paper makes
The claims and statistics of this paper haven’t been checked yet.
Run the check — free, no account needed. It reads the open-access text and checks the sources it cites.
Claims other papers make about this one
Each is checked against this paper’s own text: does it say what the citing paper says it does?
The cited source says what the claim attributes to it.
In the citing paper
“Deep learning methods have been applied to extract the interactions between cellular location and molecular phenotypes [125].”
From Challenges in AI-driven Biomedical Multimodal Data Fusion and Analysis (2025) · cites this paper as [125]
Self-check
Percentages, sums and reported differences re-computed from the paper’s own numbers.
The self-check needs the paper’s full text.
Citations
Cites
Comprehensive Integration of Single-Cell Data
Stuart, T., Butler, A., Hoffman, P., Hafemeister, C., Papalexi, E., Mauck, W. M., Hao, Y., Stoeckius, M., Smibert, P., & Satija, R. (2019) · Cell · doi:10.1016/j.cell.2019.05.031 · Cited by 15,453
Fast, sensitive and accurate integration of single-cell data with Harmony
Korsunsky, I., Millard, N., Fan, J., Slowikowski, K., Zhang, F., Wei, K., Baglaenko, Y., Brenner, M., Loh, P.-R., & Raychaudhuri, S. (2019) · Nature Methods · doi:10.1038/s41592-019-0619-0 · Cited by 10,488
Spatial reconstruction of single-cell gene expression data
Satija, R., Farrell, J. A., Gennert, D., Schier, A. F., & Regev, A. (2015) · Nature Biotechnology · doi:10.1038/nbt.3192 · Cited by 7,055 · cited 6×
“Based on this reference map, Seurat [50] projects scRNA-seq cells to spatial locations with a probabilistic score using a bimodal mixture model (Fig.”
BackgroundMethodInfluentialWeiss, K., Khoshgoftaar, T. M., & Wang, D. (2016) · Journal of Big Data · doi:10.1186/s40537-016-0043-6 · Cited by 6,260
Visualization and analysis of gene expression in tissue sections by spatial transcriptomics
Ståhl, P. L., Salmén, F., Vickovic, S., Lundmark, A., Navarro, J. F., Magnusson, J., Giacomello, S., Asp, M., Westholm, J. O., Huss, M., et al. (2016) · Science · doi:10.1126/science.aaf2403 · Cited by 3,834
Spatially resolved, highly multiplexed RNA profiling in single cells
Chen, K. H., Boettiger, A. N., Moffitt, J. R., Wang, S., & Zhuang, X. (2015) · Science · doi:10.1126/science.aaa6090 · Cited by 2,969
Deep generative modeling for single-cell transcriptomics
Lopez, R., Regier, J., Cole, M. B., Jordan, M. I., & Yosef, N. (2018) · Nature Methods · doi:10.1038/s41592-018-0229-2 · Cited by 2,530
Slide-seq: A scalable technology for measuring genome-wide expression at high spatial resolution
Rodriques, S. G., Stickels, R. R., Goeva, A., Martin, C. A., Murray, E., Vanderburg, C. R., Welch, J., Chen, L. M., Chen, F., & Macosko, E. Z. (2019) · Science · doi:10.1126/science.aaw1219 · Cited by 2,424
Statistical Analysis and Modelling of Spatial Point Patterns
Illian, J., Penttinen, A., Stoyan, H., & Stoyan, D. (2007) · Wiley eBooks · doi:10.1002/9780470725160 · Cited by 1,848
Transcriptome-scale super-resolved imaging in tissues by RNA seqFISH
Eng, C.-H. L., Lawson, M., Zhu, Q., Dries, R., Koulena, N., Takei, Y., Yun, J., Cronin, C., Karp, C., Yuan, G.-C., et al. (2019) · Nature · doi:10.1038/s41586-019-1049-y · Cited by 1,754
Cited by
Multimodal machine learning in precision health: A scoping review
Kline, A., Wang, H., Li, Y., Dennis, S., Hutch, M., Xu, Z., Wang, F., Cheng, F., & Luo, Y. (2022) · npj Digital Medicine · doi:10.1038/s41746-022-00712-8 · Cited by 528
Self-citationApplications of single-cell RNA sequencing in drug discovery and development
Van de Sande, B., Lee, J. S., Mutasa-Gottgens, E., Naughton, B., Bacon, W., Manning, J., Wang, Y., Pollard, J., Mendez, M., Hill, J., et al. (2023) · Nature Reviews Drug Discovery · doi:10.1038/s41573-023-00688-4 · Cited by 437
An Unsupervised Machine Learning Algorithms: Comprehensive Review
Naeem, S., Ali, A., Anam, S., & Ahmed, M. M. (2023) · International Journal of Computing and Digital Systems · doi:10.12785/ijcds/130172 · Cited by 289
“Develop models that detect trends in historical data and utilize those models to make forecasts to generate data-driven predictions [1], [2], [3].”
MethodClinical and translational values of spatial transcriptomics
Zhang, L., Chen, D., Song, D., Liu, X., Zhang, Y., Xu, X., & Wang, X. (2022) · Signal Transduction and Targeted Therapy · doi:10.1038/s41392-022-00960-w · Cited by 213
Spatial transcriptomics in health and disease
Jain, S. R., & Eadon, M. T. (2024) · Nature Reviews Nephrology · doi:10.1038/s41581-024-00841-1 · Cited by 168
“Each of these techniques has different underlying mathematical properties, which can lead to considerable variability in how cells or spots are defined 40–42 .”
Metadata
- Authors
- Zeng, Z., Li, Y., Li, Y., & Luo, Y.
- Affiliations
- Peking University (CN)
- Northwestern University (US)
- Corresponding author
- Luo, Yuan
- Venue
- Genome Biology
- Published
- 2022-03-25
- Volume
- 23
- Issue
- 1
- Pages
- 83-83
- ISSN
- 1465-6906 (ISSN-L)
- 1474-760X
- PMC
- PMC8951701
- OpenAlex
- W4221095552
- Semantic Scholar
- ad1c1fc6d1ee5ef416501317dbfd24045bc8b136
- Cited by
- 186
- References
- 113
- Citations by year
- 2026: 28 · 2025: 41 · 2024: 59 · 2023: 41 · 2022: 17
- FWCI
- 4.26
- Type
- journal article
- Language
- en
- Open access
- gold
- doi.org
- Licence
- cc-by
- creativecommons.org/licenses/by/4.0 (tdm)
- creativecommons.org/licenses/by/4.0 (vor)
- Locations
- Genome biology (publishedVersion, cc-by)
- PubMed Central (publishedVersion, cc-by)
- PubMed (publishedVersion)
- DOAJ (DOAJ: Directory of Open Access Journals) (submittedVersion)
- Funders
- National Institutes of Health (R01LM013337, 5UL1TR001422)
- Topics
- Life Sciences › Biochemistry, Genetics and Molecular Biology › Molecular Biology › Single-cell and spatial transcriptomics
- Life Sciences › Biochemistry, Genetics and Molecular Biology › Molecular Biology › Gene expression and cancer classification
- Social Sciences › Economics, Econometrics and Finance › Economics and Econometrics › Spatial and Panel Data Analysis
- Keywords
- spatial transcriptomics, statistical analysis, machine learning, single-cell transcriptomics, spatial location, data complexity
- MeSH terms
- Machine Learning, Data Analysis, Sequence Analysis, Single-Cell Analysis, Transcriptome
About these checks
Registry, retraction, Cites and statistics results are computed, not judged, with one exception: a printed reference that no index lists is read once by a model before it counts as a citation error. Claims are extracted by a model and kept only when their quote appears verbatim in the text; each cited source is then checked, with a model’s help, for whether it says what the claim relies on. Those verdicts can be wrong — read the claim’s quote and the cited source before relying on one.
Statistics and arithmetic are recomputed, not judged.
Confidence bands are shown only for fields calibrated on our annotated test set. None is calibrated yet, so no band is shown.
What counts as a claim ›How we measure confidence ›How we check this ›
Are you an author, or do you see a problem with this page? Request a review
How to cite
Cite CoChat for the checks on this page, and the paper for its own findings.
- This page
- CoChat. (2026). Citation check: Statistical and machine learning methods for spatially resolved transcriptomics data analysis. https://app.cochat.ai/papers/10.1186/s13059-022-02653-7
- The paper
- Zeng, Z., Li, Y., Li, Y., & Luo, Y. (2022). Statistical and machine learning methods for spatially resolved transcriptomics data analysis. Genome Biology. https://doi.org/10.1186/s13059-022-02653-7
Data sources
Bibliographic data: Semantic Scholar, OpenAlex, Crossref.
Contains information from the Semantic Scholar Academic Graph Datasets, made available under the ODC Attribution License (ODC-BY 1.0).
Semantic Scholar’s data is described in: Kinney, R., et al. (2023). The Semantic Scholar Open Data Platform. arXiv:2301.10140.
