CoChat

Population structure discovery in meta-analyzed microbial communities and inflammatory bowel disease using MMUPHin

Open access

The DOI matches its Crossref record; 67 of the 68 references it cites were found in a registry or an index.

Abstract

Microbiome studies of inflammatory bowel diseases (IBD) have achieved a scale for meta-analysis of dysbioses among populations. To enable microbial community meta-analyses generally, we develop MMUPHin for normalization, statistical meta-analysis, and population structure discovery using microbial taxonomic and functional profiles. Applying it to ten IBD cohorts, we identify consistent associations, including novel taxa such as Acinetobacter and Turicibacter, and additional exposure and interaction effects. A single gradient of dysbiosis severity is favored over discrete types to summarize IBD microbiome population structure. These results provide a benchmark for characterization of IBD and a framework for meta-analysis of any microbial communities.

Overview

The claims and statistics of this paper haven’t been checked yet.

Free: it reads the open-access text and checks the first 5 claims that cite a source we can check. Create a free account to check every claim.

A few free checks a day · papers already verified open instantly · results are public

Integrity signals

Registry

Crossref · 10.1186/s13059-022-02753-4

Cites

67 of 67 references verified0 citation errors · 0 not checkable

Statistics

Figures

Fig. 1 A method for large-scale microbial community meta-analysis and its application to inflammatory bowel disease. a We developed a novel statistical framework, MMUPHin, allowing joint normalization and meta-analysis of large microbial community profile collections with heterogeneous and complex designs (multiple covariates, longitudinal samples, etc.). We applied it to a collection of 10 inflammatory bowel disease studies comprising 2179 subjects and 5151 total samples (Table 1). We uniformly processed the associated sequence data and harmonized metadata across cohorts. Microbial taxonomic profiles were then corrected for batch and study effects before downstream analyses for omnibus and per-feature association with disease phenotypes and unsupervised population structure discovery. b MDS ordination of all microbial profiles (Bray-Curtis dissimilarity) before batch correction visualize the strongest associations with gut microbial composition, including disease, sample type (biopsy or stool), cohort (visualized separately for larger and smaller studies), and dominant phyla
Fig. 1 A method for large-scale microbial community meta-analysis and its application to inflammatory bowel disease. a We developed a novel statistical framework, MMUPHin, allowing joint normalization and meta-analysis of large microbial community profile collections with heterogeneous and complex designs (multiple covariates, longitudinal samples, etc.). We applied it to a collection of 10 inflammatory bowel disease studies comprising 2179 subjects and 5151 total samples (Table 1). We uniformly processed the associated sequence data and harmonized metadata across cohorts. Microbial taxonomic profiles were then corrected for batch and study effects before downstream analyses for omnibus and per-feature association with disease phenotypes and unsupervised population structure discovery. b MDS ordination of all microbial profiles (Bray-Curtis dissimilarity) before batch correction visualize the strongest associations with gut microbial composition, including disease, sample type (biopsy or stool), cohort (visualized separately for larger and smaller studies), and dominant phylaCC BY · PubMed Central
Fig. 2 Effectiveness of batch correction, association meta-analysis, and unsupervised population structure discovery methods. All evaluations use simulated microbial community profiles as detailed in “Methods.” Left panels summarize representative subsets of results (full set of simulation cases presented in Additional file 4: Table S2 and results in Additional file 1: Figs. S6-S9), and right panels show examples of batch-influenced data pre- and post-correction. a, b MMUPHin_Correct is effective for covariate-adjusted batch effect reduction while maintaining the effect of positive control variables. For panel a, PERMANOVA R2 statistics summarize the effect of batch and positive/negative control variables on the overall microbial composition, before and after batch correction. Results shown correspond to the subset of details in Additional file 1: Fig. S6 with number of samples per batch = 500, number of batches = 4, and number of features = 1000 with 5% spiked with associations. c, d Batch correction and meta-analysis with MMUPHin_MetaDA reduces false positives when an exposure is spuriously associated with microbiome features due to an imbalanced distribution between batches. Corresponds to Additional file 1: Fig. S7 with number of samples per batch = 500, number of features = 1000 with 10% spiked associations, and case proportion difference between batches = 0.8. Evaluations of BDMMA generate low FPRs due to the zero-inflated nature of simulated microbial abundances, and are included only in Additional file 1: Fig. S7. e, f Batch correction improves correct identification of the true underlying number of clusters during discrete population structure discovery. Success rate is measured as the percentage of selecting the true number of clusters (before and after correction) across simulation iterations. Corresponds to Additional file 1: Fig. S8 with number of samples per batch = 500 and number of batches = 2. g, h Continuous structure discovery with MMUPHin_Continuous accurately recovers microbiome compositional gradients in a simulated population. We compare identified continuous structure loading with true scores with Pearson correlations. Corresponds to Additional file 1: Fig. S9 with number of batches = 6
Fig. 2 Effectiveness of batch correction, association meta-analysis, and unsupervised population structure discovery methods. All evaluations use simulated microbial community profiles as detailed in “Methods.” Left panels summarize representative subsets of results (full set of simulation cases presented in Additional file 4: Table S2 and results in Additional file 1: Figs. S6-S9), and right panels show examples of batch-influenced data pre- and post-correction. a, b MMUPHin_Correct is effective for covariate-adjusted batch effect reduction while maintaining the effect of positive control variables. For panel a, PERMANOVA R2 statistics summarize the effect of batch and positive/negative control variables on the overall microbial composition, before and after batch correction. Results shown correspond to the subset of details in Additional file 1: Fig. S6 with number of samples per batch = 500, number of batches = 4, and number of features = 1000 with 5% spiked with associations. c, d Batch correction and meta-analysis with MMUPHin_MetaDA reduces false positives when an exposure is spuriously associated with microbiome features due to an imbalanced distribution between batches. Corresponds to Additional file 1: Fig. S7 with number of samples per batch = 500, number of features = 1000 with 10% spiked associations, and case proportion difference between batches = 0.8. Evaluations of BDMMA generate low FPRs due to the zero-inflated nature of simulated microbial abundances, and are included only in Additional file 1: Fig. S7. e, f Batch correction improves correct identification of the true underlying number of clusters during discrete population structure discovery. Success rate is measured as the percentage of selecting the true number of clusters (before and after correction) across simulation iterations. Corresponds to Additional file 1: Fig. S8 with number of samples per batch = 500 and number of batches = 2. g, h Continuous structure discovery with MMUPHin_Continuous accurately recovers microbiome compositional gradients in a simulated population. We compare identified continuous structure loading with true scores with Pearson correlations. Corresponds to Additional file 1: Fig. S9 with number of batches = 6CC BY · PubMed Central
Fig. 3 Meta-analytic omnibus and per-feature testing reveal novel and previously documented IBD associations. a Omnibus testing (PERMANOVA on Bray-Curtis dissimilarities with stratification and covariate control where appropriate, see “Methods” and Additional file 5: Table S3) identified between-subject differences as the greatest source of microbiome variability, with IBD phenotype, disease (CD/UC), and sample type (stool/biopsy) as additional main sources of biological variation. MMUPHin successfully reduced between-cohort and within-study batch effects, although these technical sources also remained significant contributors to variability. b Individual taxa significantly associated with IBD phenotypes or treatments after meta-analysis. Taxa are arranged by family-level median effect size of IBD vs. control for disease results and that of antibiotic usage for treatment results. Effect sizes are aggregated regression coefficients (across studies with random effects modelling) on arcsin square root-transformed relative abundances. Detailed model information in “Methods” and Additional file 5: Table S3. Individual study results in Additional file 6: Table S4
Fig. 3 Meta-analytic omnibus and per-feature testing reveal novel and previously documented IBD associations. a Omnibus testing (PERMANOVA on Bray-Curtis dissimilarities with stratification and covariate control where appropriate, see “Methods” and Additional file 5: Table S3) identified between-subject differences as the greatest source of microbiome variability, with IBD phenotype, disease (CD/UC), and sample type (stool/biopsy) as additional main sources of biological variation. MMUPHin successfully reduced between-cohort and within-study batch effects, although these technical sources also remained significant contributors to variability. b Individual taxa significantly associated with IBD phenotypes or treatments after meta-analysis. Taxa are arranged by family-level median effect size of IBD vs. control for disease results and that of antibiotic usage for treatment results. Effect sizes are aggregated regression coefficients (across studies with random effects modelling) on arcsin square root-transformed relative abundances. Detailed model information in “Methods” and Additional file 5: Table S3. Individual study results in Additional file 6: Table S4CC BY · PubMed Central
Fig. 4 IBD-associated taxa are aggravated in more severe disease; disease biogeography and CD/UC differentially affect some taxa with respect to disease and treatment. a Statistically significant genera from meta-analytically synthesized differential abundance effects among severity of CD and UC phenotypes as quantified by Montreal classification. The difference between the most severe phenotype with the least severe one (B3 vs. B1 for CD, E3 vs. E1 for UC) was in most cases more aggravated than that of the intermediate phenotype. Many of the identified features overlap with those associated with IBD vs. control differences, suggesting a consistent gradient of severity effects on the microbiome. Individual study results in Additional file 7: Table S5. b Genus Dehalobacterium as an example in which a taxon is uniquely affected in the stool microbiome during CD and not at the mucosa. Likewise, family Enterobacteriaceae as an example in which steroid treatment corresponds with enrichment of the clade in CD samples, but depletion in UC. In all panels, effect sizes are aggregated regression coefficients on arcsin square root-transformed relative abundances. Full sets of statistically significant interactions, with individual study results, are in Additional file 8: Table S6
Fig. 4 IBD-associated taxa are aggravated in more severe disease; disease biogeography and CD/UC differentially affect some taxa with respect to disease and treatment. a Statistically significant genera from meta-analytically synthesized differential abundance effects among severity of CD and UC phenotypes as quantified by Montreal classification. The difference between the most severe phenotype with the least severe one (B3 vs. B1 for CD, E3 vs. E1 for UC) was in most cases more aggravated than that of the intermediate phenotype. Many of the identified features overlap with those associated with IBD vs. control differences, suggesting a consistent gradient of severity effects on the microbiome. Individual study results in Additional file 7: Table S5. b Genus Dehalobacterium as an example in which a taxon is uniquely affected in the stool microbiome during CD and not at the mucosa. Likewise, family Enterobacteriaceae as an example in which steroid treatment corresponds with enrichment of the clade in CD samples, but depletion in UC. In all panels, effect sizes are aggregated regression coefficients on arcsin square root-transformed relative abundances. Full sets of statistically significant interactions, with individual study results, are in Additional file 8: Table S6CC BY · PubMed Central
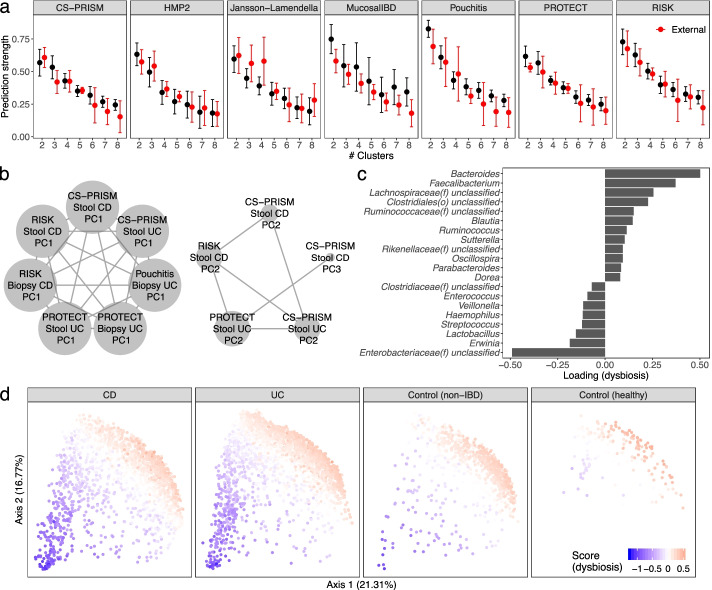
Fig. 5 Unsupervised population structure discovery finds no evidence of microbiome-based subtypes in the IBD gut, but a reproducible gradient of continuously variable dysbiosis in disease. a No support was detected for discrete microbiome subtypes (clusters) within the IBD microbiome, neither within cohort nor when evaluated among studies (red bars) using prediction strength [42]. This remained true during stratification within CD and UC, and for additional dissimilarity metric/clustering strength measurements (Additional file 1: Fig. S12). b Conversely, two reproducible, continuously variable patterns of microbiome population structure were identified using groups of similar principal components (“Methods”) [35]. These patterns were consistent within and between cohorts, disease types, and sample types, as well as under different edge strength cutoffs (Additional file 1: Fig. S14), and their consensus loadings were reproducible among cohorts (Additional file 1: Fig. S15). c Top 20 genera with highest absolute loadings for the disease-associated dysbiosis score corresponding to the first cluster in b. Many of these taxa were also IBD-associated (Fig. 3b). d Distribution of the dysbiosis pattern across CD, UC, non-IBD control, and healthy populations. Although it was defined in an unsupervised way solely within the IBD population, across which the pattern is highly variable, it also differentiates well between IBD and control populations (Additional file 1: Fig. S16)
Fig. 5 Unsupervised population structure discovery finds no evidence of microbiome-based subtypes in the IBD gut, but a reproducible gradient of continuously variable dysbiosis in disease. a No support was detected for discrete microbiome subtypes (clusters) within the IBD microbiome, neither within cohort nor when evaluated among studies (red bars) using prediction strength [42]. This remained true during stratification within CD and UC, and for additional dissimilarity metric/clustering strength measurements (Additional file 1: Fig. S12). b Conversely, two reproducible, continuously variable patterns of microbiome population structure were identified using groups of similar principal components (“Methods”) [35]. These patterns were consistent within and between cohorts, disease types, and sample types, as well as under different edge strength cutoffs (Additional file 1: Fig. S14), and their consensus loadings were reproducible among cohorts (Additional file 1: Fig. S15). c Top 20 genera with highest absolute loadings for the disease-associated dysbiosis score corresponding to the first cluster in b. Many of these taxa were also IBD-associated (Fig. 3b). d Distribution of the dysbiosis pattern across CD, UC, non-IBD control, and healthy populations. Although it was defined in an unsupervised way solely within the IBD population, across which the pattern is highly variable, it also differentiates well between IBD and control populations (Additional file 1: Fig. S16)CC BY · PubMed Central

Verification

Claims the paper makes

The claims and statistics of this paper haven’t been checked yet.

Free: it reads the open-access text and checks the first 5 claims that cite a source we can check. Create a free account to check every claim.

A few free checks a day · papers already verified open instantly · results are public

Claims other papers make about this one

Each is checked against this paper’s own text: does it say what the citing paper says it does?

Self-check

Percentages, sums and reported differences re-computed from the paper’s own numbers.

The self-check needs the paper’s full text.

Citations

Cites

Show all 67 references

Research works printed but not linked: 1

  1. Csardi G, Nepusz T. The igraph software package for complex network research. Int J Complex Syst. 2006;1695(5):1–9.

Cited by

See all 168

Metadata

Authors
Ma, S., Shungin, D., Mallick, H., Schirmer, M., Nguyen, L. H., Kolde, R., Franzosa, E., Vlamakis, H., Xavier, R., & Huttenhower, C.
Affiliations
  • Harvard University (US)
  • Broad Institute (US)
  • Massachusetts General Hospital (US)
Corresponding author
  • Xavier, Ramnik
  • Huttenhower, Curtis
Venue
Genome biology
Published
2022-10-03
Volume
23
Issue
1
Pages
208-208
ISSN
  • 1465-6906 (ISSN-L)
  • 1474-760X
OpenAlex
W4300863449
Cited by
164
References
68
Citations by year
2026: 40 · 2025: 47 · 2024: 40 · 2023: 28 · 2022: 7
FWCI
3.31
Type
journal article
Language
en
Open access
Licence
Locations
  • Genome biology (publishedVersion, cc-by)
  • PubMed Central (publishedVersion, cc-by)
  • PubMed (publishedVersion)
  • DOAJ (DOAJ: Directory of Open Access Journals) (submittedVersion, cc-by-sa)
Funders
national institute of diabetes and digestive and kidney diseases (R24DK110499, P30DK043351)
Topics
  • Life Sciences › Biochemistry, Genetics and Molecular Biology › Molecular Biology › Gut microbiota and health
  • Health Sciences › Medicine › Gastroenterology › Inflammatory Bowel Disease
  • Physical Sciences › Environmental Science › Ecology › Microbial Community Ecology and Physiology
Keywords
inflammatory bowel disease, gut microbiota, dysbiosis, taxonomic profiles, functional profile, Acinetobacter, Turicibacter
MeSH terms
Gastrointestinal Microbiome, Humans, Inflammatory Bowel Diseases, Microbiota, Dysbiosis

About these checks

Registry, retraction, Cites and statistics results are computed, not judged, with one exception: a printed reference that no index lists is read once by a model before it counts as a citation error. Claims are extracted by a model and kept only when their quote appears verbatim in the text; each cited source is then checked, with a model’s help, for whether it says what the claim relies on. Those verdicts can be wrong — read the claim’s quote and the cited source before relying on one.

Statistics and arithmetic are recomputed, not judged.

Confidence bands are shown only for fields calibrated on our annotated test set. None is calibrated yet, so no band is shown.

What counts as a claim ›How we measure confidence ›How we check this ›

Are you an author, or do you see a problem with this page? Request a review

How to cite

Cite CoChat for the checks on this page, and the paper for its own findings.

This page
CoChat. (2026). Citation check: Population structure discovery in meta-analyzed microbial communities and inflammatory bowel disease using MMUPHin. https://app.cochat.ai/papers/10.1186/s13059-022-02753-4
The paper
Ma, S., Shungin, D., Mallick, H., Schirmer, M., Nguyen, L. H., Kolde, R., Franzosa, E., Vlamakis, H., Xavier, R., & Huttenhower, C. (2022). Population structure discovery in meta-analyzed microbial communities and inflammatory bowel disease using MMUPHin. Genome biology. https://doi.org/10.1186/s13059-022-02753-4

Data sources

Bibliographic data: Semantic Scholar, OpenAlex, Crossref.

Contains information from the Semantic Scholar Academic Graph Datasets, made available under the ODC Attribution License (ODC-BY 1.0).

Semantic Scholar’s data is described in: Kinney, R., et al. (2023). The Semantic Scholar Open Data Platform. arXiv:2301.10140.