

The DOI matches its Crossref record; 67 of the 69 references it cites were found in a registry or an index.
Predicting heterogeneity in clone-specific therapeutic vulnerabilities using single-cell transcriptomic signatures
Open accessPublished version of a preprint
Abstract
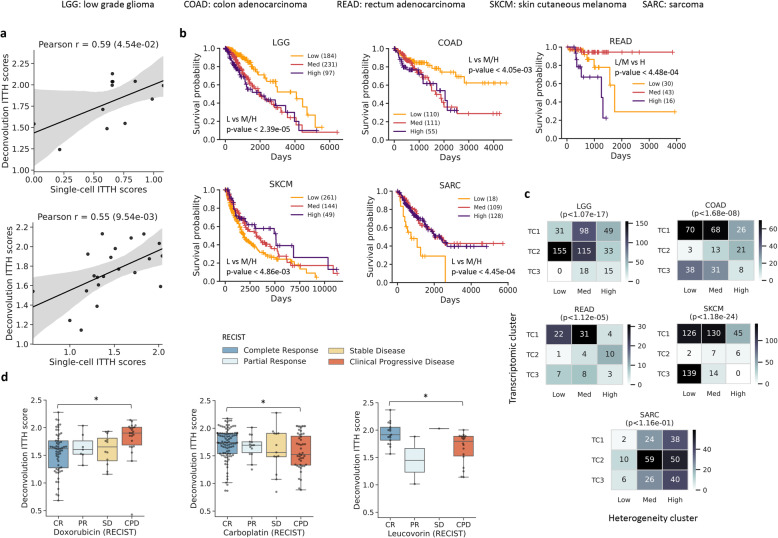
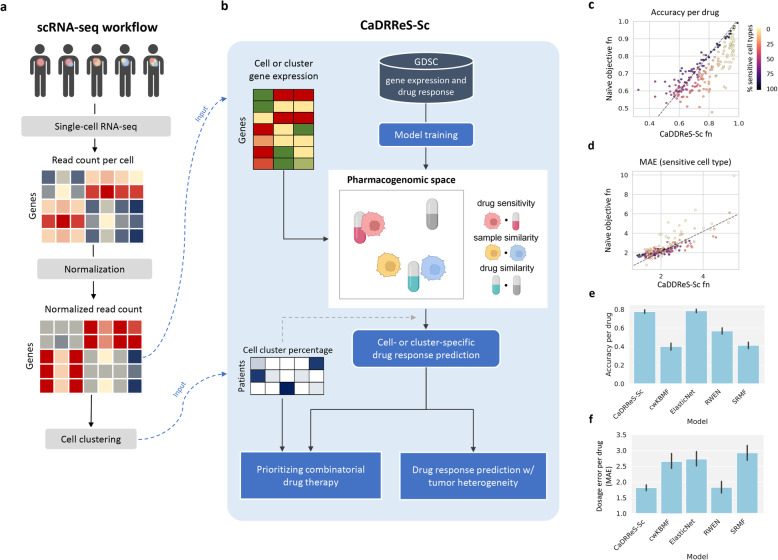
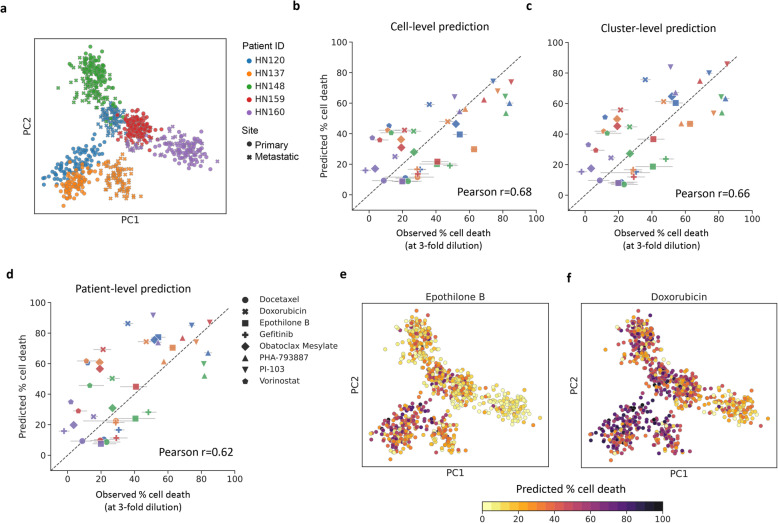
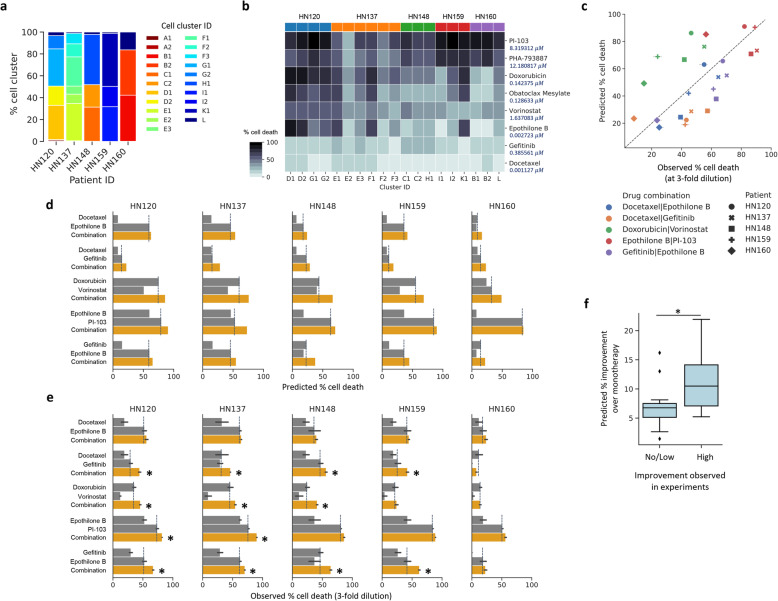
While understanding molecular heterogeneity across patients underpins precision oncology, there is increasing appreciation for taking intra-tumor heterogeneity into account. Based on large-scale analysis of cancer omics datasets, we highlight the importance of intra-tumor transcriptomic heterogeneity (ITTH) for predicting clinical outcomes. Leveraging single-cell RNA-seq (scRNA-seq) with a recommender system (CaDRReS-Sc), we show that heterogeneous gene-expression signatures can predict drug response with high accuracy (80%). Using patient-proximal cell lines, we established the validity of CaDRReS-Sc’s monotherapy (Pearson r >0.6) and combinatorial predictions targeting clone-specific vulnerabilities (>10% improvement). Applying CaDRReS-Sc to rapidly expanding scRNA-seq compendiums can serve as in silico screen to accelerate drug-repurposing studies. Availability: https://github.com/CSB5/CaDRReS-Sc .
Overview
The claims and statistics of this paper haven’t been checked yet.
Free: it reads the open-access text and checks the first 5 claims that cite a source we can check. Create a free account to check every claim.
Integrity signals
Registry
Cites
Statistics
Figures
Verification
Claims the paper makes
The claims and statistics of this paper haven’t been checked yet.
Free: it reads the open-access text and checks the first 5 claims that cite a source we can check. Create a free account to check every claim.
Claims other papers make about this one
Each is checked against this paper’s own text: does it say what the citing paper says it does?
The cited source says what the claim attributes to it.
In the citing paper
“which predicts cancer drug responses for unseen cell lines or patients, based on learning projections for drugs and cell lines within a latent ‘pharmacogenomic’ space.”
From A mini-review on perturbation modelling across single-cell omic modalities (2024) · cites this paper as [41]
In the citing paper
“CaDRReS-Sc combines cell- or cluster-specific drug response predictions to estimate overall drug response and prioritise drug combinations for a patient.”
From A mini-review on perturbation modelling across single-cell omic modalities (2024) · cites this paper as [41]
In the citing paper
“CaDRReS-Sc can effectively combine cell-specific drug response values into a holistic response value using Newton’s method, which is ideal for constructing IC50 sigmoid-like curves.”
From A mini-review on perturbation modelling across single-cell omic modalities (2024) · cites this paper as [41]
In the citing paper
“Moreover, CaDRReS-Sc enables drug-pathway associations and combinatorial therapy responses for personalised therapeutic regimens.”
From A mini-review on perturbation modelling across single-cell omic modalities (2024) · cites this paper as [41]
Self-check
Percentages, sums and reported differences re-computed from the paper’s own numbers.
The self-check needs the paper’s full text.
Citations
Cites
STAR: ultrafast universal RNA-seq aligner
Dobin, A., Davis, C. A., Schlesinger, F., Drenkow, J., Zaleski, C., Jha, S., Batut, P., Chaisson, M., & Gingeras, T. R. (2013) · Bioinformatics · doi:10.1093/bioinformatics/bts635 · Cited by 51,709 · cited 1×
“2a, default parameters) [28], followed by RSEM analysis (v1.”
MethodRSEM: accurate transcript quantification from RNA-Seq data with or without a reference genome
Li, B., & Dewey, C. N. (2011) · BMC Bioinformatics · doi:10.1186/1471-2105-12-323 · Cited by 22,179 · cited 1×
“3.0, default parameters) [29].”
InfluentialFast unfolding of communities in large networks
Blondel, V. D., Guillaume, J.-L., Lambiotte, R., & Lefebvre, E. (2008) · Journal of Statistical Mechanics: Theory and Experiment · doi:10.1088/1742-5468/2008/10/p10008 · Cited by 21,424 · cited 1×
“In the final step, the neighborhood graph was used for cell clustering using the Louvain algorithm (Blondel et al., 2008).”
MethodRobust enumeration of cell subsets from tissue expression profiles
Newman, A. M., Liu, C. L., Green, M. R., Gentles, A. J., Feng, W., Xu, Y., Hoang, C. D., Diehn, M., & Alizadeh, A. A. (2015) · Nature Methods · doi:10.1038/nmeth.3337 · Cited by 13,224 · cited 3×
“While this analysis emphasized the general importance of taking ITTH into account for predicting treatment response and outcomes, the power to detect associations might have been limited by the dependence on an in silico deconvolution approach [34, 56].”
BackgroundMethodIntegrating single-cell transcriptomic data across different conditions, technologies, and species
Butler, A., Hoffman, P., Smibert, P., Papalexi, E., & Satija, R. (2018) · Nature Biotechnology · doi:10.1038/nbt.4096 · Cited by 13,174 · cited 1×
“A standard scRNA-seq workflow described in the Scanpy tutorial was used to perform single-cell clustering [30, 31].”
MethodMatrix Factorization Techniques for Recommender Systems
Koren, Y., Bell, R., & Volinsky, C. (2009) · Computer · doi:10.1109/mc.2009.263 · Cited by 11,673 · cited 1×
“System for single-cell RNA-seq or CaDDReS-Sc) that robustly combines single-cell RNA-sequencing (scRNA-seq) data with matrix factorization techniques for recommender system [18, 26] to predict drug response for a heterogeneous tumor.”
MethodSCANPY: large-scale single-cell gene expression data analysis
Wolf, F. A., Angerer, P., & Theis, F. J. (2018) · Genome Biology · doi:10.1186/s13059-017-1382-0 · Cited by 8,881 · cited 1×
“A standard scRNA-seq workflow described in the Scanpy tutorial was used to perform single-cell clustering [30, 31].”
MethodThe Cancer Cell Line Encyclopedia enables predictive modelling of anticancer drug sensitivity
Barretina, J., Caponigro, G., Stransky, N., Venkatesan, K., Margolin, A. A., Kim, S., Wilson, C. J., Lehár, J., Kryukov, G. V., Sonkin, D., et al. (2012) · Nature · doi:10.1038/nature11003 · Cited by 7,950 · cited 2×
“These efforts have been complemented by studies on cancer cell lines [14 – 16] to understand the relationship between molecular markers and drug response in vitro.”
BackgroundDrug combination studies and their synergy quantification using the Chou-Talalay method
Chou, T.-C. (2010) · Cancer Research · doi:10.1158/0008-5472.can-09-1947 · Cited by 5,739 · cited 1×
“impact of drug-drug interactions (Chou, 2010; Jia et al., 2009; Yadav et al., 2015), overall we were able to capture the effect of combinatorial drug therapy (Figure 4C-E) and its improvement over monotherapy (Figure 4F).”
BackgroundSingle-cell RNA-seq highlights intratumoral heterogeneity in primary glioblastoma
Patel, A. P., Tirosh, I., Trombetta, J. J., Shalek, A. K., Gillespie, S. M., Wakimoto, H., Cahill, D. P., Nahed, B. V., Curry, W. T., Martuza, R. L., et al. (2014) · Science · doi:10.1126/science.1254257 · Cited by 5,063 · cited 1×
“The development of single-cell transcriptomics has enabled the direct identification and quantification of cell populations within a tumor [4, 44 – 46].”
Cited by
Gene expression based inference of cancer drug sensitivity
Chawla, S., Rockstroh, A., Lehman, M., Ratther, E., Jain, A., Anand, A., Gupta, A., Bhattacharya, N., Poonia, S., Rai, P., et al. (2022) · Nature Communications · doi:10.1038/s41467-022-33291-z · Cited by 183
“21 and another method by Sakellaropoulos, Theodore, et al 16 .”
BackgroundMethodSinha, S., Vegesna, R., Mukherjee, S., Kammula, A. V., Dhruba, S. R., Wu, W., Kerr, D. L., Nair, N. U., Jones, M. G., Yosef, N., et al. (2024) · Nature Cancer · doi:10.1038/s43018-024-00756-7 · Cited by 150
“We obtained the sc-expression data for five head and neck squamous cell cancer PDCs lines, along with their treatment response for eight drugs and combination therapy at two different dosages 26 .”
MethodKe, M. S., Elshenawy, B., Sheldon, H., Arora, A., & Buffa, F. M. (2022) · BioEssays · doi:10.1002/bies.202200084 · Cited by 89
A mini-review on perturbation modelling across single-cell omic modalities
Gavriilidis, G. I., Vasileiou, V., Orfanou, A., Ishaque, N., & Psomopoulos, F. (2024) · Computational and Structural Biotechnology Journal · doi:10.1016/j.csbj.2024.04.058 · Cited by 54
“CaDRReS-Sc [41] (Cancer Drug Response prediction using a Recommender System for single-cell RNA-seq) is the single-cell version of the CaDRReS model (https://doi.org/10.1093/bioinformatics/ bty452), which predicts cancer drug responses for unseen cell lines or patients, based on learning…”
MethodInfluentialscDrug: From single-cell RNA-seq to drug response prediction
Hsieh, C.-Y., Wen, J.-H., Lin, S.-M., Tseng, T.-Y., Huang, J., Huang, H., & Juan, H. (2022) · Computational and Structural Biotechnology Journal · doi:10.1016/j.csbj.2022.11.055 · Cited by 59
“The cancer cluster-specific model proposed in CaDRReS-Sc [16] was defined as where s iu is the observed drug response (IC 50 or scaled 1 (cid:1) AUC) of cell line u to drug i , b s iu is the predicted drug response, l is the over-all mean drug response, b and b are the bias terms for drug i and cell…”
BackgroundMethod
Metadata
- Authors
- Suphavilai, C., Chia, S., Sharma, A., Tu, L., Da Silva, R. P., Mongia, A., DasGupta, R., & Nagarajan, N.
- Affiliations
- Agency for Science, Technology and Research (SG)
- Corresponding author
- DasGupta, Ramanuj
- Nagarajan, Niranjan
- Venue
- Genome Medicine
- Published
- 2021-12
- Volume
- 13
- Issue
- 1
- Pages
- 189-189
- ISSN
- 1756-994X (ISSN-L)
- PMC
- PMC8680165
- OpenAlex
- W4225886114
- Cited by
- 58
- References
- 69
- Citations by year
- 2026: 8 · 2025: 13 · 2024: 21 · 2023: 8 · 2022: 6 · 2021: 2
- FWCI
- 3.61
- Type
- journal article
- Language
- en
- Open access
- gold
- doi.org
- Licence
- cc-by
- creativecommons.org/licenses/by/4.0 (tdm)
- creativecommons.org/licenses/by/4.0 (vor, 15 d)
- Locations
- Genome Medicine (publishedVersion, cc-by)
- bioRxiv (Cold Spring Harbor Laboratory) (acceptedVersion)
- PubMed Central (publishedVersion, cc-by)
- PubMed (publishedVersion)
- National University of Singapore (submittedVersion, cc-by)
- cIRcle (University of British Columbia) (submittedVersion, cc-by)
- DOAJ (DOAJ: Directory of Open Access Journals) (submittedVersion, cc-by-sa)
- Funders
- Genome Institute of Singapore
- Topics
- Life Sciences › Biochemistry, Genetics and Molecular Biology › Molecular Biology › Single-cell and spatial transcriptomics
- Life Sciences › Biochemistry, Genetics and Molecular Biology › Cancer Research › Cancer Genomics and Diagnostics
- Life Sciences › Biochemistry, Genetics and Molecular Biology › Molecular Biology › Gene expression and cancer classification
- Keywords
- intratumoral heterogeneity, drug response prediction, single-cell transcriptomics, recommender systems, precision oncology, drug repurposing
- MeSH terms
- Clone Cells, Humans, Neoplasms, Software, Sequence Analysis, RNA, Gene Expression Profiling, Precision Medicine, Single-Cell Analysis, Transcriptome
About these checks
Registry, retraction, Cites and statistics results are computed, not judged, with one exception: a printed reference that no index lists is read once by a model before it counts as a citation error. Claims are extracted by a model and kept only when their quote appears verbatim in the text; each cited source is then checked, with a model’s help, for whether it says what the claim relies on. Those verdicts can be wrong — read the claim’s quote and the cited source before relying on one.
Statistics and arithmetic are recomputed, not judged.
Confidence bands are shown only for fields calibrated on our annotated test set. None is calibrated yet, so no band is shown.
What counts as a claim ›How we measure confidence ›How we check this ›
Are you an author, or do you see a problem with this page? Request a review
How to cite
Cite CoChat for the checks on this page, and the paper for its own findings.
- This page
- CoChat. (2026). Citation check: Predicting heterogeneity in clone-specific therapeutic vulnerabilities using single-cell transcriptomic signatures. https://app.cochat.ai/papers/10.1186/s13073-021-01000-y
- The paper
- Suphavilai, C., Chia, S., Sharma, A., Tu, L., Da Silva, R. P., Mongia, A., DasGupta, R., & Nagarajan, N. (2021). Predicting heterogeneity in clone-specific therapeutic vulnerabilities using single-cell transcriptomic signatures. Genome Medicine. https://doi.org/10.1186/s13073-021-01000-y
Data sources
Bibliographic data: Semantic Scholar, OpenAlex, Crossref.
Contains information from the Semantic Scholar Academic Graph Datasets, made available under the ODC Attribution License (ODC-BY 1.0).
Semantic Scholar’s data is described in: Kinney, R., et al. (2023). The Semantic Scholar Open Data Platform. arXiv:2301.10140.
