

The DOI matches its Crossref record; 30 of the 30 references it cites were found in a registry or an index.
Ketogenic diet modifies the gut microbiota in a murine model of autism spectrum disorder
Open accessAbstract
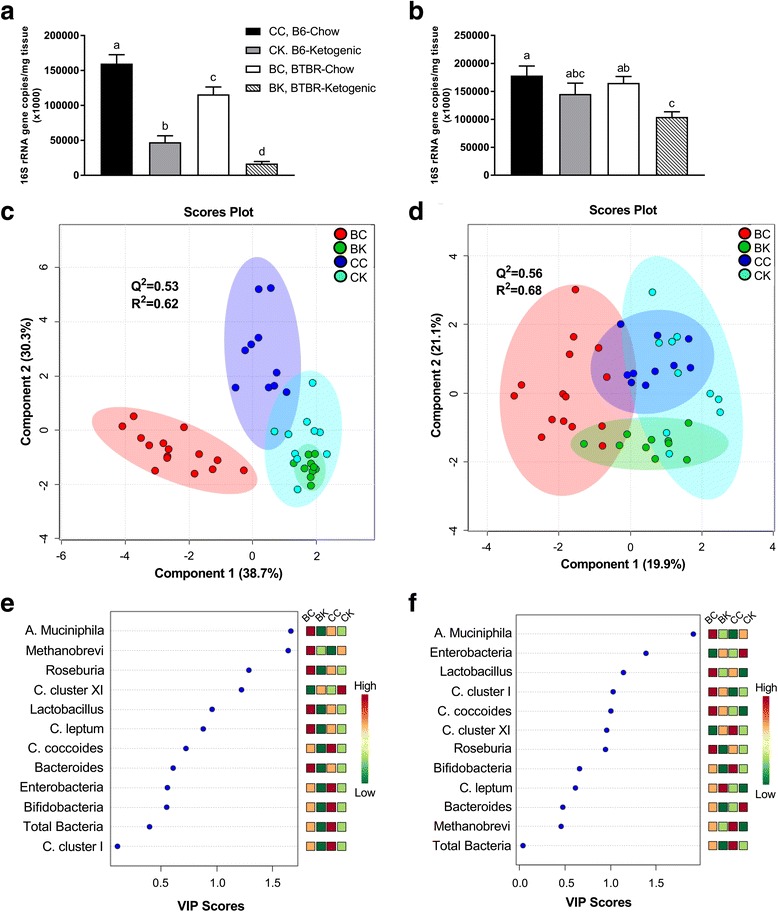
BACKGROUND: Gastrointestinal dysfunction and gut microbial composition disturbances have been widely reported in autism spectrum disorder (ASD). This study examines whether gut microbiome disturbances are present in the BTBR(T + tf/j) (BTBR) mouse model of ASD and if the ketogenic diet, a diet previously shown to elicit therapeutic benefit in this mouse model, is capable of altering the profile. FINDINGS: Juvenile male C57BL/6 (B6) and BTBR mice were fed a standard chow (CH, 13 % kcal fat) or ketogenic diet (KD, 75 % kcal fat) for 10-14 days. Following diets, fecal and cecal samples were collected for analysis. Main findings are as follows: (1) gut microbiota compositions of cecal and fecal samples were altered in BTBR compared to control mice, indicating that this model may be of utility in understanding gut-brain interactions in ASD; (2) KD consumption caused an anti-microbial-like effect by significantly decreasing total host bacterial abundance in cecal and fecal matter; (3) specific to BTBR animals, the KD counteracted the common ASD phenotype of a low Firmicutes to Bacteroidetes ratio in both sample types; and (4) the KD reversed elevated Akkermansia muciniphila content in the cecal and fecal matter of BTBR animals. CONCLUSIONS: Results indicate that consumption of a KD likely triggers reductions in total gut microbial counts and compositional remodeling in the BTBR mouse. These findings may explain, in part, the ability of a KD to mitigate some of the neurological symptoms associated with ASD in an animal model.
Overview
The claims and statistics of this paper haven’t been checked yet.
Run the check — free, no account needed. It reads the open-access text and checks the sources it cites.
Integrity signals
Registry
Cites
Statistics
Figures
Verification
Claims the paper makes
The claims and statistics of this paper haven’t been checked yet.
Run the check — free, no account needed. It reads the open-access text and checks the sources it cites.
Claims other papers make about this one
Each is checked against this paper’s own text: does it say what the citing paper says it does?
In the citing paper
“Additionally BTBR mice was characterized by a gut microbiota profile that was different from that of controls [110].”
From Autism, Gastrointestinal Symptoms and Modulation of Gut Microbiota by Nutritional Interventions (2019) · cites this paper as [110]
Self-check
Percentages, sums and reported differences re-computed from the paper’s own numbers.
The self-check needs the paper’s full text.
Citations
Cites
Changes of Intestinal Functions in Liver Cirrhosis
Fukui, H., & Wiest, R. (2016) · Inflammatory Intestinal Diseases · doi:10.1159/000444436 · Cited by 6,820
Gut microbiota in health and disease
Sekirov, I., Russell, S. L., Antunes, L. C. M., & Finlay, B. B. (2010) · Physiological Reviews · doi:10.1152/physrev.00045.2009 · Cited by 4,182
Role of the gut microbiota in immunity and inflammatory disease
Kamada, N., Seo, S.-U., Chen, G. Y., & Núñez, G. (2013) · Nature reviews. Immunology · doi:10.1038/nri3430 · Cited by 2,256
Microbiota-Generated Metabolites Promote Metabolic Benefits via Gut-Brain Neural Circuits
De Vadder, F., Kovatcheva-Datchary, P., Goncalves, D., Vinera, J., Zitoun, C., Duchampt, A., Bäckhed, F., & Mithieux, G. (2014) · Cell · doi:10.1016/j.cell.2013.12.016 · Cited by 2,200
Dietary emulsifiers impact the mouse gut microbiota promoting colitis and metabolic syndrome
Chassaing, B., Koren, O., Goodrich, J. K., Poole, A. C., Srinivasan, S., Ley, R. E., & Gewirtz, A. T. (2015) · Nature · doi:10.1038/nature14232 · Cited by 2,055
Stoddard, S. F., Smith, B. J., Hein, R., Roller, B. R. K., & Schmidt, T. M. (2014) · Nucleic Acids Research · doi:10.1093/nar/gku1201 · Cited by 1,142
Nau, R., Sörgel, F., & Eiffert, H. (2010) · Clinical Microbiology Reviews · doi:10.1128/cmr.00007-10 · Cited by 1,063
Pyrosequencing study of fecal microflora of autistic and control children
Finegold, S. M., Dowd, S. E., Gontcharova, V., Liu, C., Henley, K. E., Wolcott, R. D., Youn, E., Summanen, P. H., Granpeesheh, D., Dixon, D., et al. (2010) · Anaerobe · doi:10.1016/j.anaerobe.2010.06.008 · Cited by 977
De Angelis, M., Piccolo, M., Vannini, L., Siragusa, S., De Giacomo, A., Serrazzanetti, D. I., Cristofori, F., Guerzoni, M. E., Gobbetti, M., & Francavilla, R. (2013) · PLoS ONE · doi:10.1371/journal.pone.0076993 · Cited by 887
Autism‐like behavioral phenotypes in BTBR T+tf/J mice
McFarlane, H. G., Kusek, G. K., Yang, M., Phoenix, J. L., Bolivar, V. J., & Crawley, J. N. (2008) · Genes, Brain and Behavior · doi:10.1111/j.1601-183x.2007.00330.x · Cited by 812
Cited by
Sorted by citations
Cryan, J. F., O'Riordan, K. J., Cowan, C. S. M., Sandhu, K. V., Bastiaanssen, T. F. S., Boehme, M., Codagnone, M. G., Cussotto, S., Fulling, C., Golubeva, A. V., et al. (2019) · Physiological Reviews · doi:10.1152/physrev.00018.2018 · Cited by 5,286
The gut microbiome in neurological disorders
Cryan, J. F., O'Riordan, K. J., Sandhu, K., Peterson, V., & Dinan, T. G. (2020) · The Lancet Neurology · doi:10.1016/s1474-4422(19)30356-4 · Cited by 1,336
Human Gut Microbiota from Autism Spectrum Disorder Promote Behavioral Symptoms in Mice
Sharon, G., Cruz, N. J., Kang, D.-W., Gandal, M. J., Wang, B., Kim, Y.-M., Zink, E. M., Casey, C. P., Taylor, B. C., Lane, C. J., et al. (2019) · Cell · doi:10.1016/j.cell.2019.05.004 · Cited by 1,182
The Gut Microbiota Mediates the Anti-Seizure Effects of the Ketogenic Diet
Olson, C. A., Vuong, H. E., Yano, J. M., Liang, Q. Y., Nusbaum, D. J., & Hsiao, E. Y. (2018) · Cell · doi:10.1016/j.cell.2018.04.027 · Cited by 1,057
Zheng, P., Zeng, B., Liu, M., Chen, J., Pan, J., Han, Y., Liu, Y., Cheng, K., Zhou, C., Wang, H., et al. (2019) · Science Advances · doi:10.1126/sciadv.aau8317 · Cited by 704
Effect of Diet and Dietary Components on the Composition of the Gut Microbiota
Beam, A., Clinger, E., & Hao, L. (2021) · Nutrients · doi:10.3390/nu13082795 · Cited by 576
The Gut Microbiota and Autism Spectrum Disorders
Li, Q., Han, Y., Dy, A. B. C., & Hagerman, R. J. (2017) · Frontiers in Cellular Neuroscience · doi:10.3389/fncel.2017.00120 · Cited by 462
Zhu, H., Bi, D., Zhang, Y., Kong, C., Du, J., Wu, X., Wei, Q., & Qin, H. (2022) · Signal Transduction and Targeted Therapy · doi:10.1038/s41392-021-00831-w · Cited by 412
Gubert, C., Kong, G., Renoir, T., & Hannan, A. J. (2019) · Neurobiology of Disease · doi:10.1016/j.nbd.2019.104621 · Cited by 387
Golubeva, A. V., Joyce, S. A., Moloney, G., Burokas, A., Sherwin, E., Arboleya, S., Flynn, I., Khochanskiy, D., Moya-Pérez, A., Peterson, V., et al. (2017) · EBioMedicine · doi:10.1016/j.ebiom.2017.09.020 · Cited by 364
Recent developments in understanding the role of the gut microbiota in brain health and disease
Sherwin, E., Dinan, T. G., & Cryan, J. F. (2018) · Annals of the New York Academy of Sciences · doi:10.1111/nyas.13416 · Cited by 338
Ketogenic diet enhances neurovascular function with altered gut microbiome in young healthy mice
Ma, D., Wang, A. C., Parikh, I. J., Green, S. J., Hoffman, J. D., Chlipala, G. E., Murphy, M. P., Sokola, B. S., Bauer, B., Hartz, A. M. S., et al. (2018) · Scientific Reports · doi:10.1038/s41598-018-25190-5 · Cited by 315
Roles of Short-Chain Fatty Acids in Inflammatory Bowel Disease
Shin, Y., Han, S., Kwon, J., Ju, S., Choi, T., Kang, I., & Kim, S. S. (2023) · Nutrients · doi:10.3390/nu15204466 · Cited by 313
Altered gut microbiome composition in children with refractory epilepsy after ketogenic diet
Zhang, Y., Zhou, S., Zhou, Y., Yu, L., Zhang, L., & Wang, Y. (2018) · Epilepsy Research · doi:10.1016/j.eplepsyres.2018.06.015 · Cited by 269
Ketogenic Diet and Microbiota: Friends or Enemies?
Paoli, A., Mancin, L., Bianco, A., Thomas, E., Mota, J. F., & Piccini, F. (2019) · Genes · doi:10.3390/genes10070534 · Cited by 276
New insights into the mechanisms of the ketogenic diet
Boison, D. (2017) · Current Opinion in Neurology · doi:10.1097/wco.0000000000000432 · Cited by 258
Autism, Gastrointestinal Symptoms and Modulation of Gut Microbiota by Nutritional Interventions
Ristori, M. V., Quagliariello, A., Reddel, S., Ianiro, G., Vicari, S., Gasbarrini, A., & Putignani, L. (2019) · Nutrients · doi:10.3390/nu11112812 · Cited by 214
Zheng, P., Wu, J., Zhang, H., Perry, S. W., Yin, B., Tan, X., Chai, T., Liang, W., Huang, Y., Li, Y., et al. (2020) · Molecular Psychiatry · doi:10.1038/s41380-020-0744-2 · Cited by 202
The Effects of Intermittent Fasting on Brain and Cognitive Function
Gudden, J., Vásquez, A. A., & Bloemendaal, M. (2021) · Nutrients · doi:10.3390/nu13093166 · Cited by 212
Barlow, J. T., Bogatyrev, S. R., & Ismagilov, R. F. (2020) · Nature Communications · doi:10.1038/s41467-020-16224-6 · Cited by 204
The BTBR mouse model of idiopathic autism – Current view on mechanisms
Meyza, K. Z., & Blanchard, D. C. (2017) · Neuroscience & Biobehavioral Reviews · doi:10.1016/j.neubiorev.2016.12.037 · Cited by 196
Coretti, L., Cristiano, C., Florio, E., Scala, G., Lama, A., Keller, S., Cuomo, M., Russo, R., Pero, R., Paciello, O., et al. (2017) · Scientific Reports · doi:10.1038/srep45356 · Cited by 175
Lee, R. W. Y., Corley, M. J., Pang, A. P. S., Arakaki, G., Abbott, L., Nishimoto, M., Miyamoto, R. H., Lee, E., Yamamoto, S., Maunakea, A. K., et al. (2018) · Physiology & Behavior · doi:10.1016/j.physbeh.2018.02.006 · Cited by 171
Gut microbiota profiles in treatment-naïve children with attention deficit hyperactivity disorder
Jiang, H.-Y., Zhou, Y.-Y., Zhou, G.-L., Li, Y.-C., Yuan, J., Li, X.-H., & Ruan, B. (2018) · Behavioural Brain Research · doi:10.1016/j.bbr.2018.03.036 · Cited by 173
Gut Microbiota in Colorectal Cancer: Biological Role and Therapeutic Opportunities
Pandey, H., Tang, D. W. T., Wong, S. H., & Lal, D. (2023) · Cancers · doi:10.3390/cancers15030866 · Cited by 171
Mitochondrial Dysfunction in Autism Spectrum Disorder: Unique Abnormalities and Targeted Treatments
Frye, R. E. (2020) · Seminars in Pediatric Neurology · doi:10.1016/j.spen.2020.100829 · Cited by 161
Impact of Different Types of Diet on Gut Microbiota Profiles and Cancer Prevention and Treatment
Klement, R. J., & Pazienza, V. (2019) · Medicina · doi:10.3390/medicina55040084 · Cited by 186
Metabolic Dysfunction Underlying Autism Spectrum Disorder and Potential Treatment Approaches
Cheng, N., Rho, J. M., & Masino, S. A. (2017) · Frontiers in Molecular Neuroscience · doi:10.3389/fnmol.2017.00034 · Cited by 162
Nutritional interventions for autism spectrum disorder
Karhu, E., Zukerman, R. J., Eshraghi, R. S., Mittal, J., Deth, R. C., Castejon, A. M., Trivedi, M. S., Mittal, R., & Eshraghi, A. A. (2019) · Nutrition Reviews · doi:10.1093/nutrit/nuz092 · Cited by 159
Diet can impact microbiota composition in children with autism spectrum disorder
Berding, K., & Donovan, S. M. (2018) · Frontiers in Neuroscience · doi:10.3389/fnins.2018.00515 · Cited by 144
Autism Spectrum Disorder as a Brain-Gut-Microbiome Axis Disorder
Saurman, V. E., Margolis, K. G., & Luna, R. A. (2020) · Digestive Diseases and Sciences · doi:10.1007/s10620-020-06133-5 · Cited by 144
Żarnowska, I. (2020) · Nutrients · doi:10.3390/nu12092616 · Cited by 141
The Current Status of the Ketogenic Diet in Psychiatry
Bostock, E. C. S., Kirkby, K. C., & Taylor, B. V. M. (2017) · Frontiers in Psychiatry · doi:10.3389/fpsyt.2017.00043 · Cited by 127
The Role of Nutrition and the Gut-Brain Axis in Psychiatry: A Review of the Literature
Mörkl, S., Wagner‐Skacel, J., Lahousen, T., Lackner, S., Holasek, S. J., Bengesser, S., Painold, A., Holl, A. K., & Reininghaus, E. Z. (2018) · Neuropsychobiology · doi:10.1159/000492834 · Cited by 136
Xu, Y., Jiang, C., Wu, J., Liu, P., Deng, X., Zhang, Y., Peng, B., & Zhu, Y. (2021) · CNS Neuroscience & Therapeutics · doi:10.1111/cns.13779 · Cited by 127
Current nutritional approaches in managing autism spectrum disorder: A review
Çekici, H., & Şanlıer, N. (2017) · Nutritional Neuroscience · doi:10.1080/1028415x.2017.1358481 · Cited by 123
García-Gutiérrez, E., Narbad, A., & Rodríguez, J. M. (2020) · Frontiers in Neuroscience · doi:10.3389/fnins.2020.578666 · Cited by 118
Wang, D., Wu, J., Zhu, P., Xie, H., Lu, L., Bai, W., Pan, W., Shi, R., Ye, J., Xia, B., et al. (2022) · Food Research International · doi:10.1016/j.foodres.2022.111289 · Cited by 118
Microbiota-brain interactions: Moving toward mechanisms in model organisms
Nagpal, J. K., & Cryan, J. F. (2021) · Neuron · doi:10.1016/j.neuron.2021.09.036 · Cited by 110
Can we ‘seize’ the gut microbiota to treat epilepsy?
De Caro, C., Iannone, L. F., Citraro, R., Striano, P., De Sarro, G., Constanti, A., Cryan, J. F., & Russo, E. (2019) · Neuroscience & Biobehavioral Reviews · doi:10.1016/j.neubiorev.2019.10.002 · Cited by 110
Jang, J., Kim, S. R., Lee, J. E., Lee, S.-Y., Son, H. J., Choe, W., Yoon, K., Kim, S. S., Yeo, E., & Kang, I. (2023) · International Journal of Molecular Sciences · doi:10.3390/ijms25010124 · Cited by 116
Reddel, S., Putignani, L., & Del Chierico, F. (2019) · Nutrients · doi:10.3390/nu11020373 · Cited by 104
Liu, F., Horton-Sparks, K., Hull, V. L., Li, R. W., & Martínez‐Cerdeño, V. (2018) · Molecular Autism · doi:10.1186/s13229-018-0251-3 · Cited by 108
Gut microbiota and Autism Spectrum Disorder: From pathogenesis to potential therapeutic perspectives
Mehra, A., Arora, G., Sahni, G., Kaur, M., Singh, H. B., Singh, B., & Kaur, S. (2022) · Journal of Traditional and Complementary Medicine · doi:10.1016/j.jtcme.2022.03.001 · Cited by 116
Akkermansia muciniphila in neuropsychiatric disorders: friend or foe?
Lei, W., Cheng, Y., Gao, J., Liu, X., Shao, L., Kong, Q., Zheng, N., Ling, Z., & Hu, W. (2023) · Frontiers in Cellular and Infection Microbiology · doi:10.3389/fcimb.2023.1224155 · Cited by 104
The gut microbiota–brain axis in neurological disorders
You, M., Chen, N., Yang, Y., Cheng, L., He, H., Cai, Y., Liu, Y., Liu, H., & Hong, G. (2024) · MedComm · doi:10.1002/mco2.656 · Cited by 113
Hung, L. Y., & Margolis, K. G. (2024) · Nature Reviews Gastroenterology & Hepatology · doi:10.1038/s41575-023-00857-1 · Cited by 96
Xu, R., Zhang, Y., Chen, S., Zeng, Y., Fu, X., Chen, T., Luo, S., & Zhang, X. (2022) · Critical Reviews in Microbiology · doi:10.1080/1040841x.2022.2044286 · Cited by 96
The Expanding Role of Ketogenic Diets in Adult Neurological Disorders
McDonald, T. J. W., & Cervenka, M. C. (2018) · Brain Sciences · doi:10.3390/brainsci8080148 · Cited by 92
Ketogenic diet as a metabolic treatment for mental illness
Norwitz, N. G., Sethi, S., & Palmer, C. (2020) · Current Opinion in Endocrinology Diabetes and Obesity · doi:10.1097/med.0000000000000564 · Cited by 99
A Ketogenic Diet and the Treatment of Autism Spectrum Disorder
Li, Q., Liang, J., Fu, N., Han, Y., & Qin, J. (2021) · Frontiers in Pediatrics · doi:10.3389/fped.2021.650624 · Cited by 94
The Role of the Gut Microbiota on the Beneficial Effects of Ketogenic Diets
Attaye, I., van Oppenraaij, S. L., Warmbrunn, M. V., & Nieuwdorp, M. (2021) · Nutrients · doi:10.3390/nu14010191 · Cited by 85
Good or bad: gut bacteria in human health and diseases
Wang, H., Wei, C.-X., Lu, M., & Zhu, L. (2018) · Biotechnology & Biotechnological Equipment · doi:10.1080/13102818.2018.1481350 · Cited by 90
Citraro, R., Lembo, F., Caro, C. D., Tallarico, M., Coretti, L., Iannone, L. F., Leo, A., Palumbo, D., Cuomo, M., Buommino, E., et al. (2021) · Epilepsia · doi:10.1111/epi.16813 · Cited by 86
Potential Protective Mechanisms of Ketone Bodies in Migraine Prevention
Gross, E. C., Klement, R. J., Schoenen, J. E., D’Agostino, D. P., & Fischer, D. (2019) · Nutrients · doi:10.3390/nu11040811 · Cited by 78
He, Y., Wang, K., Su, N., Yuan, C., Zhang, N., Hu, X., Fu, Y., & Zhao, F. (2024) · Journal of Cellular and Molecular Medicine · doi:10.1111/jcmm.70099 · Cited by 83
Beta-Hydroxybutyrate: A Dual Function Molecular and Immunological Barrier Function Regulator
Qi, J., Gan, L., Fang, J. S., Zhang, J., Yu, X., Guo, H., Cai, D., Cui, H., Gou, L., Deng, J., et al. (2022) · Frontiers in Immunology · doi:10.3389/fimmu.2022.805881 · Cited by 74
Keto microbiota: A powerful contributor to host disease recovery
Cabrera-Mulero, A., Tinahones, A., Bandera-Merchán, B., Moreno‐Indias, I., Macías‐González, M., & Tinahones, F. J. (2019) · Reviews in Endocrine and Metabolic Disorders · doi:10.1007/s11154-019-09518-8 · Cited by 70
Crosstalk between the Ketogenic Diet and Epilepsy: From the Perspective of Gut Microbiota
Fan, Y., Wang, H., Liu, X., Zhang, J., & Liu, G. (2019) · Mediators of Inflammation · doi:10.1155/2019/8373060 · Cited by 70
The Gut Microbiota and Oxidative Stress in Autism Spectrum Disorders (ASD)
Hu, T., Dong, Y., He, C., Zhao, M., & He, Q. (2020) · Oxidative Medicine and Cellular Longevity · doi:10.1155/2020/8396708 · Cited by 72
Obesity, Gut Microbiota, and Metabolome: From Pathophysiology to Nutritional Interventions
Puljiz, Z., Kumrić, M., Vrdoljak, J., Martinović, D., Kurir, T. T., Krnic, M. O., Urlić, H., Puljiz, Ž., Žučko, J., Dumanić, P., et al. (2023) · Nutrients · doi:10.3390/nu15102236 · Cited by 74
Ketogenic Diet for the Treatment and Prevention of Dementia: A Review
Davis, J. J., Fournakis, N. A., & Ellison, J. M. (2020) · Journal of Geriatric Psychiatry and Neurology · doi:10.1177/0891988720901785 · Cited by 73
Lim, J.-M., Letchumanan, V., Tan, L. T., Hong, K., Wong, S. H., Mutalib, N. A., Lee, L., & Law, J. W. (2022) · Nutrients · doi:10.3390/nu14173566 · Cited by 75
Ketogenic therapy in neurodegenerative and psychiatric disorders: From mice to men
Kraeuter, A.-K., Phillips, R., & Sarnyai, Z. (2020) · Progress in Neuro-Psychopharmacology and Biological Psychiatry · doi:10.1016/j.pnpbp.2020.109913 · Cited by 67
Gut microbiota and neuropsychiatric disorders: Implications for neuroendocrine-immune regulation
Ge, T., Yao, X., Zhao, H., Yang, W., Zou, X., Peng, F., Li, B., & Cui, R. (2021) · Pharmacological Research · doi:10.1016/j.phrs.2021.105909 · Cited by 62
Alteration of Gut Microbiota: New Strategy for Treating Autism Spectrum Disorder
Liu, J., Gao, Z., Chuanqi, L., Liu, T., Gao, J., Cai, Y., & Fan, X. (2022) · Frontiers in Cell and Developmental Biology · doi:10.3389/fcell.2022.792490 · Cited by 71
Roussin, L., Prince, N., Perez‐Pardo, P., Kraneveld, A. D., Rabot, S., & Naudon, L. (2020) · Microorganisms · doi:10.3390/microorganisms8091369 · Cited by 64
Trudeau, M. S., Madden, R. F., Parnell, J. A., Gibbard, W. B., & Shearer, J. (2019) · Nutrients · doi:10.3390/nu11081783 · Cited by 59
Needham, B. D., Tang, W., & Wu, W. (2018) · Developmental Neurobiology · doi:10.1002/dneu.22581 · Cited by 60
Zheng, Y., Bek, M. K., Prince, N., Marzal, L. N. P., Garssen, J., Perez‐Pardo, P., & Kraneveld, A. D. (2021) · Frontiers in Neuroscience · doi:10.3389/fnins.2021.738220 · Cited by 59
Rawat, K., Singh, N., Kumari, P., & Saha, L. (2020) · Reviews in the Neurosciences · doi:10.1515/revneuro-2020-0078 · Cited by 61
The impact of keto-adaptation on exercise performance and the role of metabolic-regulating cytokines
Sherrier, M. C., & Li, H. (2019) · American Journal of Clinical Nutrition · doi:10.1093/ajcn/nqz145 · Cited by 56
Ketogenic diet, neuroprotection, and antiepileptogenesis
Murugan, M., & Boison, D. (2020) · Epilepsy Research · doi:10.1016/j.eplepsyres.2020.106444 · Cited by 56
Genetic Approaches Using Zebrafish to Study the Microbiota–Gut–Brain Axis in Neurological Disorders
Lee, J. G., Cho, H.-J., Jeong, Y.-M., & Lee, J.-S. (2021) · Cells · doi:10.3390/cells10030566 · Cited by 57
Multi-Omics Analysis Reveals Aberrant Gut-Metabolome-Immune Network in Schizophrenia
Fan, Y., Gao, Y., Ma, Q., Yang, Z., Zhao, B., He, X., Yang, J., Yan, B., Gao, F., Li, Q., et al. (2022) · Frontiers in Immunology · doi:10.3389/fimmu.2022.812293 · Cited by 58
Clinical studies and anti‐inflammatory mechanisms of treatments
French, J. A., Koepp, M. J., Naegelin, Y., Vigevano, F., Auvin, S., Rho, J. M., Rosenberg, E. C., Devinsky, O., Olofsson, P. S., & Dichter, M. A. (2017) · Epilepsia · doi:10.1111/epi.13779 · Cited by 54
Molecular Mechanisms Underlying the Bioactive Properties of a Ketogenic Diet
Murakami, M., & Tognini, P. (2022) · Nutrients · doi:10.3390/nu14040782 · Cited by 58
Comparing the Gut Microbiome in Autism and Preclinical Models: A Systematic Review
Alamoudi, M. U. A., Hosie, S., Shindler, A. E., Wood, J. L., Franks, A. E., & Hill‐Yardin, E. L. (2022) · Frontiers in Cellular and Infection Microbiology · doi:10.3389/fcimb.2022.905841 · Cited by 59
Yu, Y., Huang, J.-Y., Chen, X., Fu, J., Wang, X., Pu, L., Gu, C., & Cai, C. (2022) · Frontiers in Neurology · doi:10.3389/fneur.2022.844117 · Cited by 47
Crawford, J. A., Liu, S., & Tao, F. (2022) · Neurobiology of Pain · doi:10.1016/j.ynpai.2022.100090 · Cited by 48
Ferraris, C., Meroni, E., Casiraghi, M. C., Tagliabue, A., GIORGIS, V. D., & Erba, D. (2021) · Frontiers in Nutrition · doi:10.3389/fnut.2021.613100 · Cited by 53
Gut microbiota and host genetics modulate the effect of diverse diet patterns on metabolic health
Huda, M. N., Salvador, A. C., Barrington, W. T., Gacasan, C. A., D’Souza, E. M., Ramirez, L. D., Threadgill, D. W., & Bennett, B. J. (2022) · Frontiers in Nutrition · doi:10.3389/fnut.2022.896348 · Cited by 51
Dietary interventions for autism spectrum disorder: New perspectives from the gut-brain axis
Doenyas, C. (2018) · Physiology & Behavior · doi:10.1016/j.physbeh.2018.07.014 · Cited by 52
Predictive ability of host genetics and rumen microbiome for subclinical ketosis
Gebreyesus, G., Difford, G. F., Buitenhuis, B., Lassen, J., Noel, S. J., Højberg, O., Plichta, D. R., Zhu, Z., Poulsen, N. A., Sundekilde, U. K., et al. (2020) · Journal of Dairy Science · doi:10.3168/jds.2019-17824 · Cited by 48
Depicting the composition of gut microbiota in children with tic disorders: an exploratory study
Xi, W., Gao, X., Zhao, H., Luo, X., Li, J., Tan, X., Wang, L., Zhao, J., Wang, J., Yang, G., et al. (2021) · Journal of Child Psychology and Psychiatry · doi:10.1111/jcpp.13409 · Cited by 52
Yue, S., Li, Z., Hu, F., & Picimbon, J. (2020) · Scientific Reports · doi:10.1038/s41598-020-75207-1 · Cited by 52
Larroya, A., Pantoja, J., Codoñer‐Franch, P., & Cénit, M. C. (2021) · Frontiers in Pediatrics · doi:10.3389/fped.2021.705859 · Cited by 47
Gut microbiome-mediated mechanisms in aging-related diseases: are probiotics ready for prime time?
Ren, J., Li, H., Zeng, G., Pang, B., Wang, Q., & Wei, J.-P. (2023) · Frontiers in Pharmacology · doi:10.3389/fphar.2023.1178596 · Cited by 46
Gut microbiota as a biomarker and modulator of anti-tumor immunotherapy outcomes
Yan, J., Yang, L., Ren, Q., Zhu, C., Du, H., Wang, Z., Qi, Y., Xian, X., & Chen, D. (2024) · Frontiers in Immunology · doi:10.3389/fimmu.2024.1471273 · Cited by 52
The link between autism spectrum disorder and gut microbiota: A scoping review
Nitschke, A. S., Deonandan, R., & Konkle, A. T. M. (2020) · Autism · doi:10.1177/1362361320913364 · Cited by 46
Targeted gut microbiota manipulation attenuates seizures in a model of infantile spasms syndrome
Mu, C., Nikpoor, N., Tompkins, T. A., Choudhary, A., Wang, M., Marks, W. N., Rho, J. M., Scantlebury, M. H., & Shearer, J. (2022) · JCI Insight · doi:10.1172/jci.insight.158521 · Cited by 43
Facts and Hopes for Gut Microbiota Interventions in Cancer Immunotherapy
Davar, D., & Zarour, H. M. (2022) · Clinical Cancer Research · doi:10.1158/1078-0432.ccr-21-1129 · Cited by 40
Wei, N., Ju, M., Su, X., Zhang, Y., Huang, Y., Rao, X., Cui, L., Lin, Z., & Dong, Y. W. (2024) · Schizophrenia · doi:10.1038/s41537-024-00460-6 · Cited by 45
Exploring the mechanisms of action of the antidepressant effect of the ketogenic diet
Ricci, A. L., Idzikowski, M. A., Soares, C. N., & Brietzke, E. M. (2020) · Reviews in the Neurosciences · doi:10.1515/revneuro-2019-0073 · Cited by 44
Kraeuter, A.-K., Phillips, R., & Sarnyai, Z. (2020) · Frontiers in Psychiatry · doi:10.3389/fpsyt.2020.00799 · Cited by 43
Wang, H., Sun, Y., Xin, J., Zhang, T., Sun, N., Ni, X., Zeng, D., & Bai, Y. (2020) · Frontiers in Microbiology · doi:10.3389/fmicb.2020.01941 · Cited by 43
Qin, L., Ma, K., & Yan, Z. (2021) · Neuropsychopharmacology · doi:10.1038/s41386-021-01212-1 · Cited by 43
Mruk-Mazurkiewicz, H., Kulaszyńska, M., Czarnecka, W., Podkówka, A., Ekstedt, N., Zawodny, P., Wierzbicka-Woś, A., Marlicz, W. M., Skupin, B., Stachowska, E., et al. (2024) · Nutrients · doi:10.3390/nu16111695 · Cited by 41
The role of microbiota in autism spectrum disorders
Campion, D., Ponzo, P., Alessandria, C., Saracco, G. M., & Balzola, F. A. (2018) · Minerva Gastroenterologica e Dietologica · doi:10.23736/s1121-421x.18.02493-5 · Cited by 40
Altered Gut Microbiota in a Fragile X Syndrome Mouse Model
Altimiras, F. J., García, J., Palacios-García, I., Hurley, M. J., Deacon, R. M. J., González, B., & Cogram, P. (2021) · Frontiers in Neuroscience · doi:10.3389/fnins.2021.653120 · Cited by 39
Metadata
- Authors
- Newell, C., Bomhof, M. R., Reimer, R. A., Hittel, D. S., Rho, J. M., & Shearer, J.
- Affiliations
- University of Calgary (CA)
- Corresponding author
- Newell, Christopher
- Venue
- Molecular Autism
- Published
- 2016-09-01
- Volume
- 7
- Issue
- 1
- Pages
- 37-37
- ISSN
- 2040-2392 (ISSN-L)
- PMC
- PMC5009541
- OpenAlex
- W2509638174
- Cited by
- 272
- References
- 30
- Citations by year
- 2026: 13 · 2025: 30 · 2024: 23 · 2023: 31 · 2022: 41 · 2021: 33 · 2020: 40 · 2019: 29 · 2018: 20 · 2017: 10 · 2016: 2
- FWCI
- 10.56
- Type
- journal article
- Language
- en
- Open access
- gold
- doi.org
- Licence
- cc-by
- Locations
- Molecular Autism (publishedVersion, cc-by)
- PubMed Central (publishedVersion, cc-by)
- PubMed (publishedVersion)
- eScholarship (California Digital Library) (submittedVersion)
- eScholarship (California Digital Library) (submittedVersion, cc-by)
- Funders
- Alberta Children's Hospital Foundation
- Canadian Institutes of Health Research
- MitoCanada
- Topics
- Life Sciences › Biochemistry, Genetics and Molecular Biology › Molecular Biology › Gut microbiota and health
- Life Sciences › Neuroscience › Cognitive Neuroscience › Autism Spectrum Disorder Research
- Health Sciences › Medicine › Physiology (medical) › Diet and metabolism studies
- Keywords
- ketogenic diet, autism spectrum disorder, gut microbiota, gut-brain axis, Akkermansia muciniphila, Firmicutes/Bacteroidetes ratio, cecal microbiota, fecal microbiota, dietary fat, gastrointestinal dysfunction
- MeSH terms
- Autism Spectrum Disorder, Gastrointestinal Microbiome, Animals, Bacteria, Behavior, Animal, Cecum, Disease Models, Animal, Feces, Male, Mice, Inbred C57BL, Social Behavior, Mice, Diet, Ketogenic
About these checks
Registry, retraction, Cites and statistics results are computed, not judged, with one exception: a printed reference that no index lists is read once by a model before it counts as a citation error. Claims are extracted by a model and kept only when their quote appears verbatim in the text; each cited source is then checked, with a model’s help, for whether it says what the claim relies on. Those verdicts can be wrong — read the claim’s quote and the cited source before relying on one.
Statistics and arithmetic are recomputed, not judged.
Confidence bands are shown only for fields calibrated on our annotated test set. None is calibrated yet, so no band is shown.
What counts as a claim ›How we measure confidence ›How we check this ›
Are you an author, or do you see a problem with this page? Request a review
