

The DOI matches its Crossref record; 6 of the 6 references it cites were found in a registry or an index.
Dynamic changes of CX3CL1/CX3CR1 axis during microglial activation and motor neuron loss in the spinal cord of ALS mouse model
Overview
The claims and statistics of this paper haven’t been checked yet.
Run the check — free, no account needed. It reads the open-access text and checks the sources it cites.
Integrity signals
Registry
Cites
Statistics
Figures
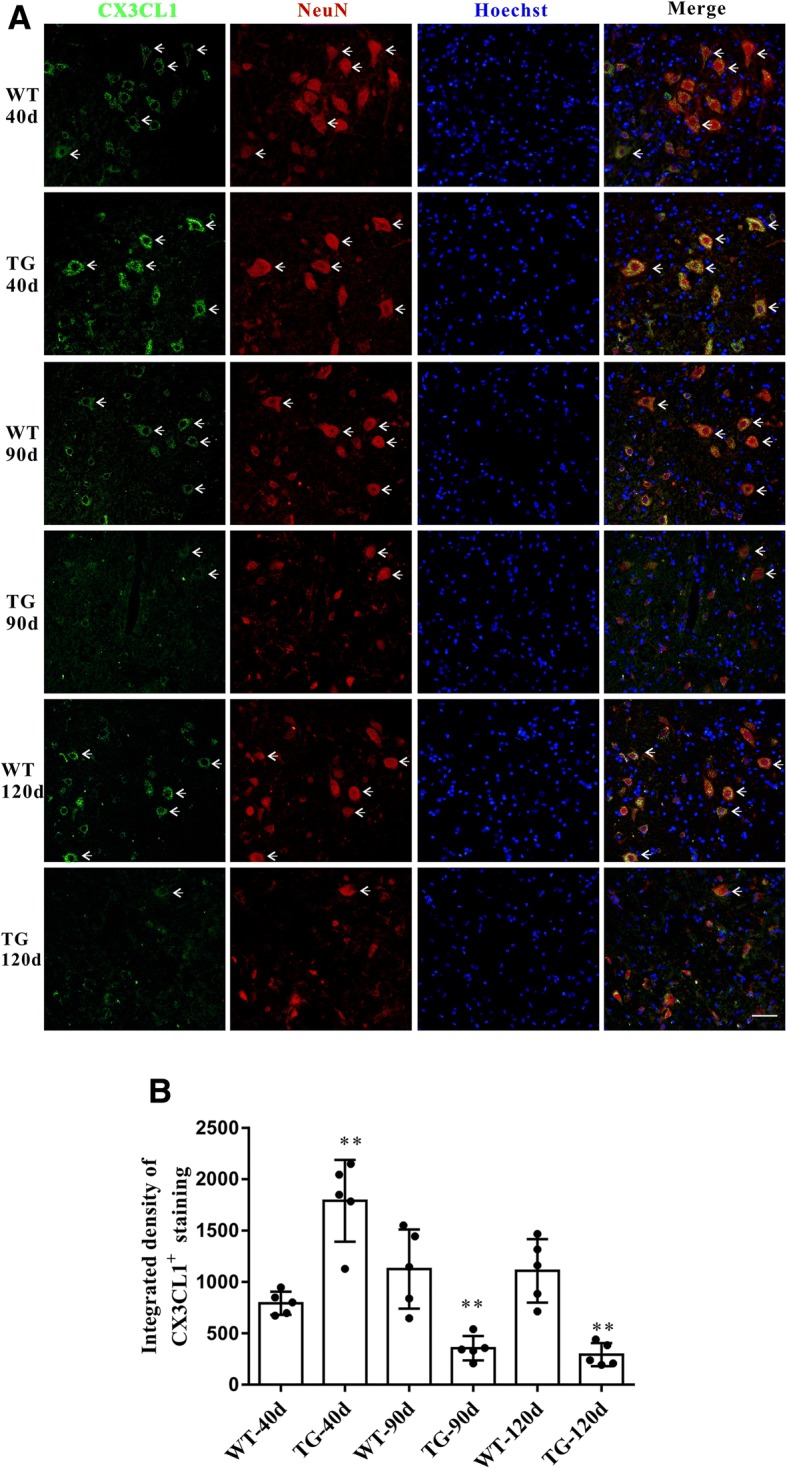
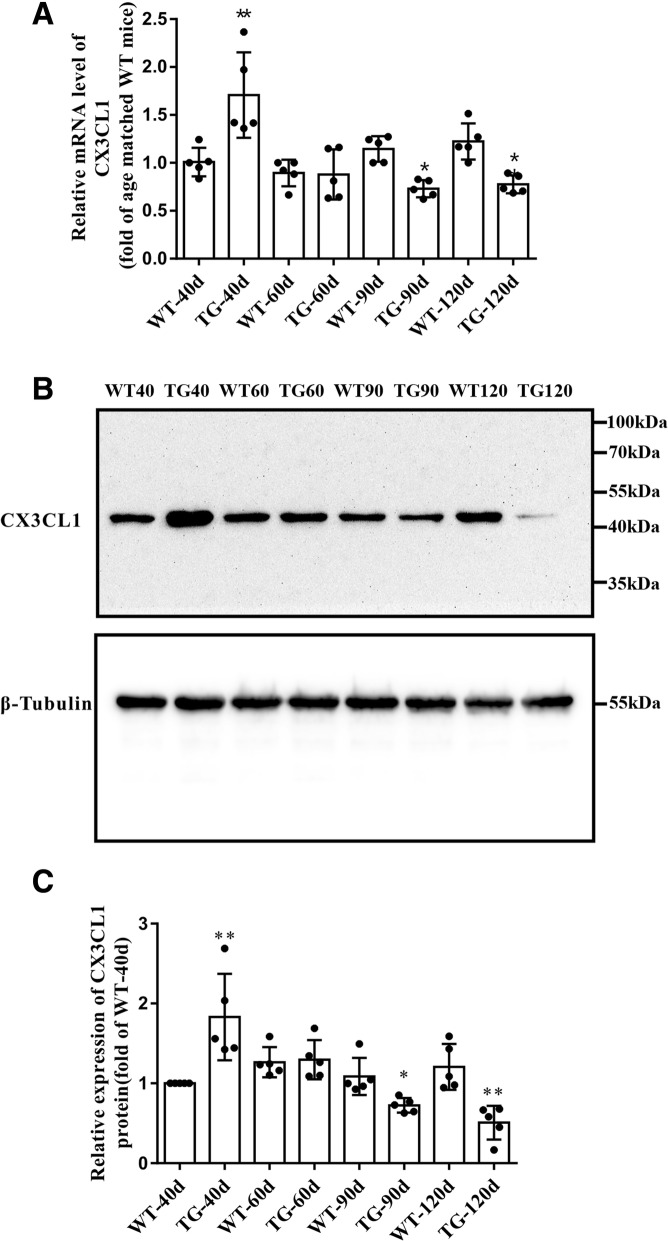
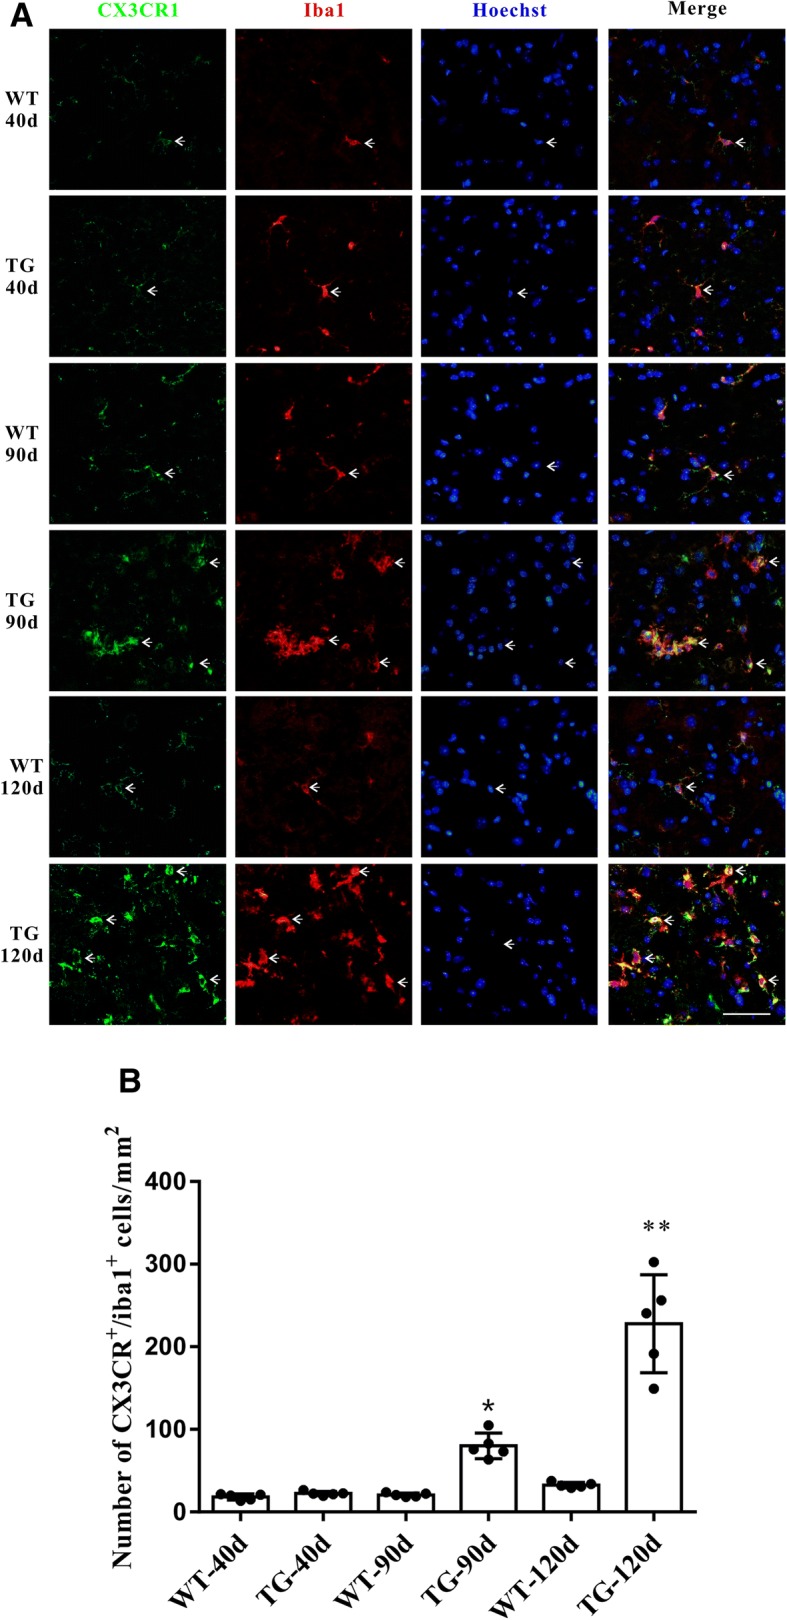
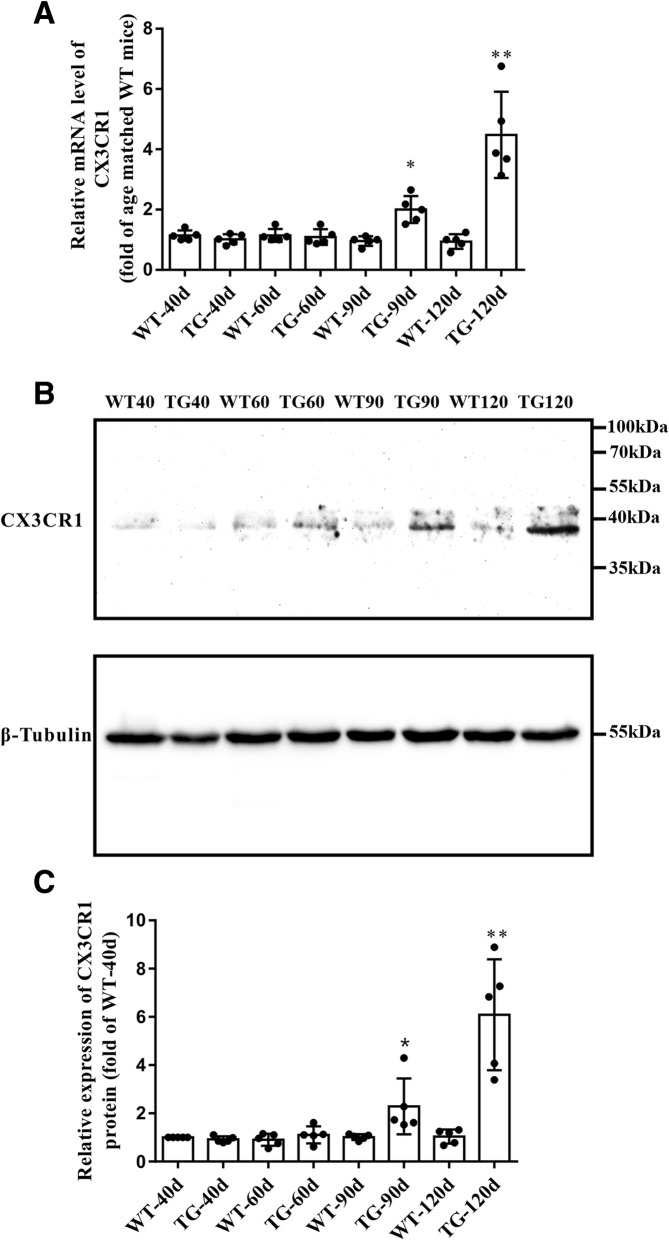
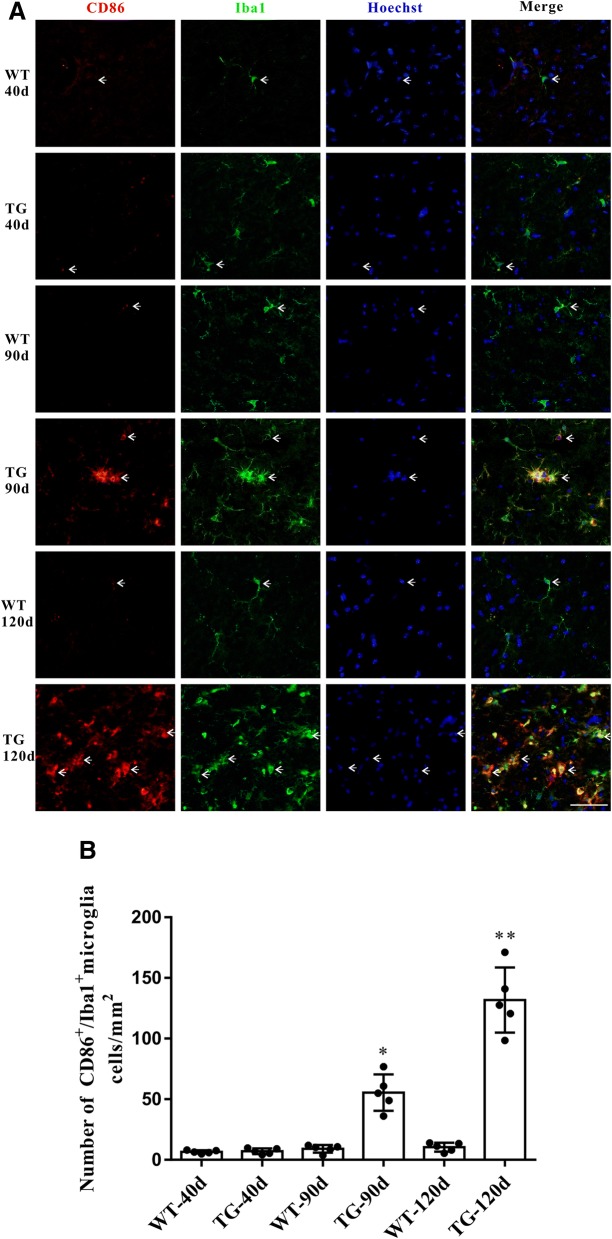
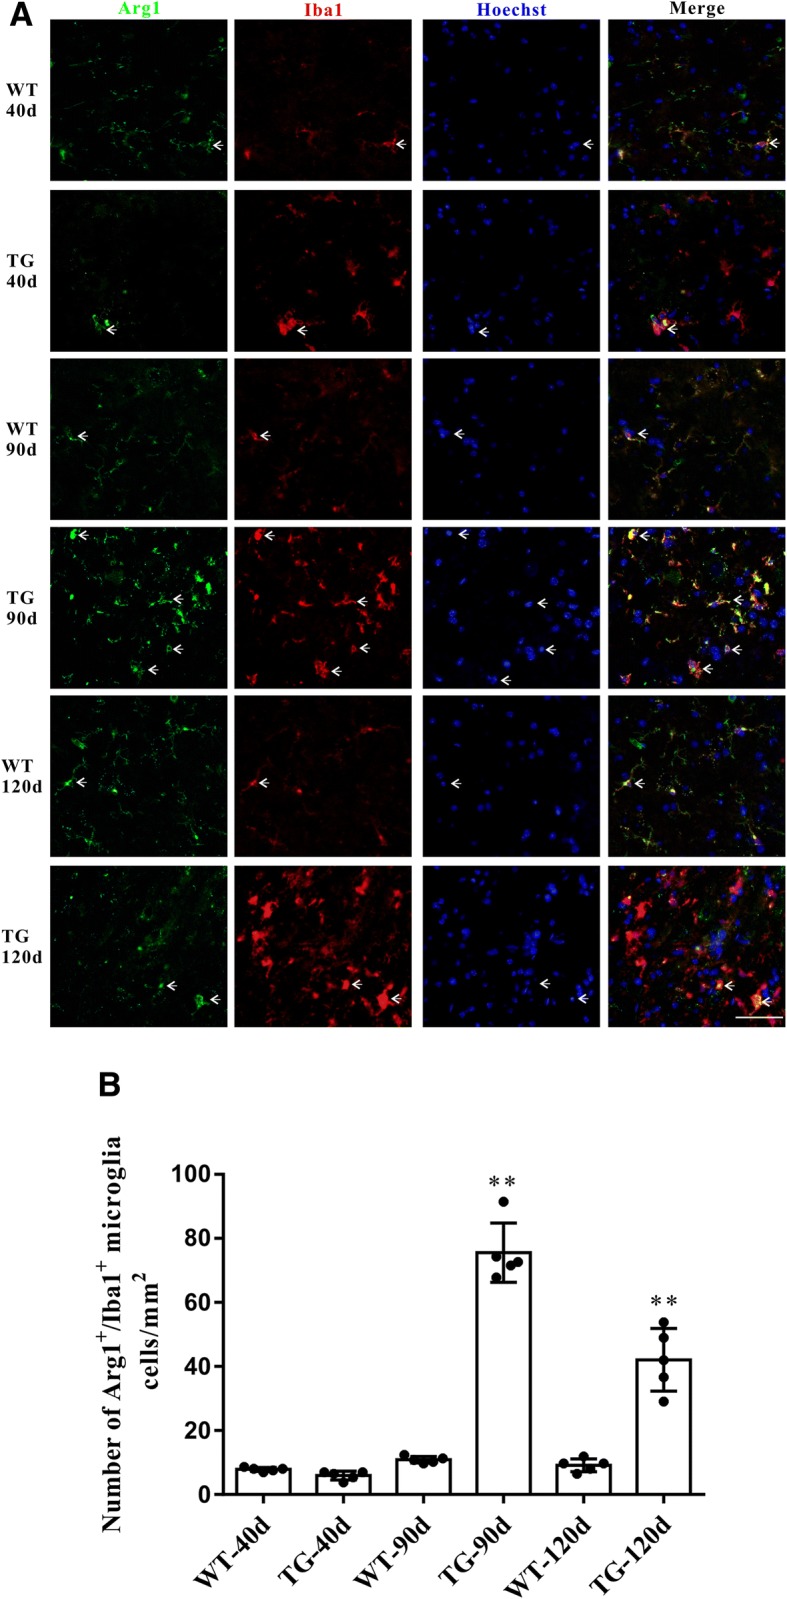
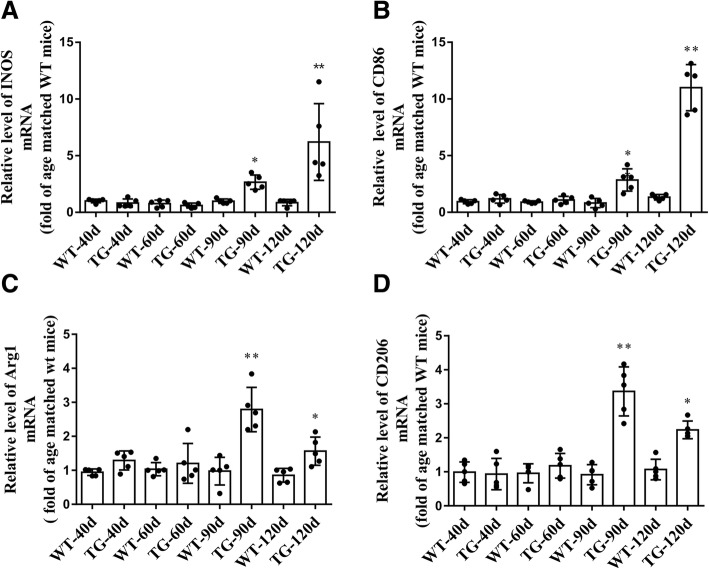
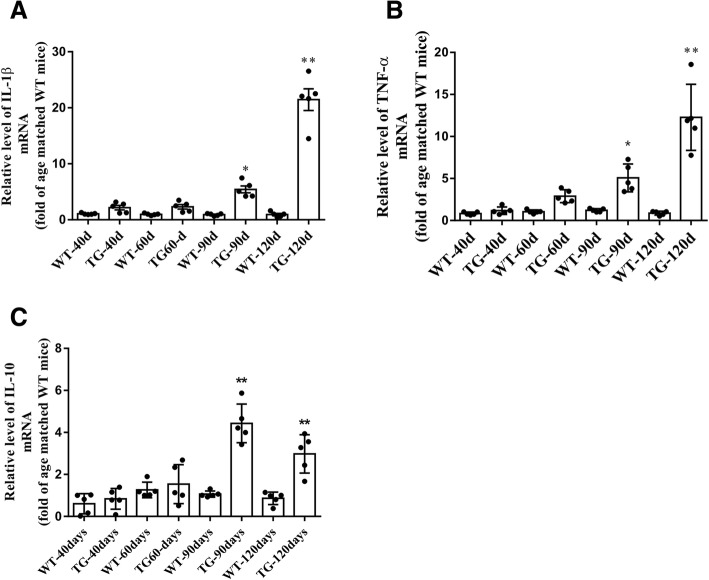
Verification
Claims the paper makes
The claims and statistics of this paper haven’t been checked yet.
Run the check — free, no account needed. It reads the open-access text and checks the sources it cites.
Claims other papers make about this one
Each is checked against this paper’s own text: does it say what the citing paper says it does?
The source backs part of the claim, not all of it — or backs it for a different population, condition or comparison.
In the citing paper
“Then, activated microglia release a large number of inflammatory factors like TNF-α, IL-1α, and C1q, which in turn lead to neuroinflammation and neuronal death [46, 47].”
From CX3CL1/CX3CR1 axis attenuates early brain injury via promoting the delivery of exosomal microRNA-124 from neuron to microglia after subarachnoid hemorrhage (2020) · cites this paper as [47]
Experimental — accuracy not yet measuredThe source backs part of the claim, not all of it — or backs it for a different population, condition or comparison.
In the citing paper
“Then, activated microglia release a large number of inflammatory factors like TNF-α, IL-1α, and C1q, which in turn lead to neuroinflammation and neuronal death [46, 47].”
From CX3CL1/CX3CR1 axis attenuates early brain injury via promoting the delivery of exosomal microRNA-124 from neuron to microglia after subarachnoid hemorrhage (2020) · cites this paper as [47]
Experimental — accuracy not yet measuredIn the citing paper
“Then, activated microglia release a large number of inflammatory factors like TNF-α, IL-1α, and C1q, which in turn lead to neuroinflammation and neuronal death [46, 47].”
From CX3CL1/CX3CR1 axis attenuates early brain injury via promoting the delivery of exosomal microRNA-124 from neuron to microglia after subarachnoid hemorrhage (2020) · cites this paper as [47]
Self-check
Percentages, sums and reported differences re-computed from the paper’s own numbers.
The self-check needs the paper’s full text.
Citations
Cites
Onset and Progression in Inherited ALS Determined by Motor Neurons and Microglia
Boillée, S., Yamanaka, K., Lobsiger, C. S., Copeland, N. G., Jenkins, N. A., Kassiotis, G., Kollias, G., & Cleveland, D. W. (2006) · Science · doi:10.1126/science.1123511 · Cited by 1,623
Control of microglial neurotoxicity by the fractalkine receptor
Cardona, A. E., Pioro, E. P., Sasse, M. E., Kostenko, V., Cardona, S. M., Dijkstra, I. M., Huang, D., Kidd, G., Dombrowski, S., Dutta, R., et al. (2006) · Nature Neuroscience · doi:10.1038/nn1715 · Cited by 1,531
Molecular pathways of motor neuron injury in amyotrophic lateral sclerosis
Ferraiuolo, L., Kirby, J., Grierson, A. J., Sendtner, M., & Shaw, P. J. (2011) · Nature Reviews Neurology · doi:10.1038/nrneurol.2011.152 · Cited by 615
Urushitani, M., Sik, A., Sakurai, T., Nukina, N., Takahashi, R., & Julien, J.-P. (2006) · Nature Neuroscience · doi:10.1038/nn1603 · Cited by 419
Lyons, A., Lynch, A. M., Downer, E. J., Hanley, R., O’Sullivan, J. B., Smith, A., & Lynch, M. A. (2009) · Journal of Neurochemistry · doi:10.1111/j.1471-4159.2009.06253.x · Cited by 202
Time-dependent effects of CX3CR1 in a mouse model of mild traumatic brain injury
Febinger, H. Y., Thomasy, H. E., Pavlova, M. N., Ringgold, K. M., Barf, P. R., George, A. M., Grillo, J. N., Bachstetter, A. D., Garcia, J. A., Cardona, A. E., et al. (2015) · Journal of Neuroinflammation · doi:10.1186/s12974-015-0386-5 · Cited by 110
Research works printed but not linked: 34
- Gurney ME, Pu H, Chiu AY, Dal Canto MC, Polchow CY, Alexander DD, et al. Motor neuron degeneration in mice that express a human Cu, Zn superoxide dismutase mutation. Science. 1994;264(5166):1772–5. · DOI · Paper page
- Clement AM, Nguyen MD, Roberts EA, Garcia ML, Boillee S, Rule M, et al. Wild-type nonneuronal cells extend survival of SOD1 mutant motor neurons in ALS mice. Science. 2003;302(5642):113–7. · DOI
- Pramatarova A, Laganière J, Roussel J, Brisebois K, Rouleau GA. Neuron-specific expression of mutant superoxide dismutase 1 in transgenic mice does not lead to motor impairment. J Neurosci. 2001;21(10):3369–74. · DOI · Paper page
- Lino MM, Schneider C, Caroni P. Accumulation of SOD1 mutants in postnatal motoneurons does not cause motoneuron pathology or motoneuron disease. J Neurosci. 2002;22(12):4825–32. · DOI · Paper page
- Puentes F, Malaspina A, van Noort JM, Amor S. Non-neuronal cells in ALS: role of glial, immune cells and blood-CNS barriers. Brain Pathol. 2016;26(2):248–57. · DOI
- Frakes AE, Ferraiuolo L, Haidet-Phillips AM, Schmelzer L, Braun L, Miranda CJ, et al. Microglia induce motor neuron death via the classical NF-kappaB pathway in amyotrophic lateral sclerosis. Neuron. 2014;81(5):1009–23. · DOI · Paper page
- Spiller KJ, Restrepo CR, Khan T, Dominique MA, Fang TC, Canter RG, et al. Microglia-mediated recovery from ALS-relevant motor neuron degeneration in a mouse model of TDP-43 proteinopathy. Nat Neurosci. 2018;21(3):329–40. · DOI · Paper page
- Tang Y, Le W. Differential roles of M1 and M2 microglia in neurodegenerative diseases. Mol Neurobiol. 2016;53(2):1181–94. · DOI · Paper page
- Henkel JS, Beers DR, Zhao W, Appel SH. Microglia in ALS: the good, the bad, and the resting. J Neuroimmune Pharmacol. 2009;4(4):389–98. · DOI · Paper page
- Zhao W, Beers DR, Appel SH. Immune-mediated mechanisms in the pathoprogression of amyotrophic lateral sclerosis. J NeuroImmune Pharmacol. 2013;8(4):888–99. · DOI
- Appel SH, Zhao W, Beers D, Henkel J. The microglial-motoneuron dialogue in ALS. Acta Myol. 2011;30(1):4–8.
- Brites D, Vaz AR. Microglia centered pathogenesis in ALS: insights in cell interconnectivity. Front Cell Neurosci. 2014;8:117. · DOI
- Biber K, Neumann H, Inoue K, Boddeke HW. Neuronal ‘On’ and ‘Off’ signals control microglia. Trends Neurosci. 2007;30(11):596–602. · DOI · Paper page
- Hernangomez M, Carrillo-Salinas FJ, Mecha M, Correa F, Mestre L, Loria F, et al. Brain innate immunity in the regulation of neuroinflammation: therapeutic strategies by modulating CD200-CD200R interaction involve the cannabinoid system. Curr Pharm Des. 2014;20(29):4707–22. · DOI
- Chapman GA, Moores KE, Gohil J, Berkhout TA, Patel L, Green P, et al. The role of fractalkine in the recruitment of monocytes to the endothelium. Eur J Pharmacol. 2000;392(3):189–95. · DOI
- Harrison JK, Jiang Y, Chen S, Xia Y, Maciejewski D, McNamara RK, et al. Role for neuronally derived fractalkine in mediating interactions between neurons and CX3CR1-expressing microglia. Proc Natl Acad Sci U S A. 1998;95(18):10896–901. · DOI · Paper page
- Rogers JT, Morganti JM, Bachstetter AD, Hudson CE, Peters MM, Grimmig BA, et al. CX3CR1 deficiency leads to impairment of hippocampal cognitive function and synaptic plasticity. J Neurosci. 2011;31(45):16241–50. · DOI · Paper page
- Calvo A, Moglia C, Canosa A, Cammarosano S, Ilardi A, Bertuzzo D, et al. Commonpolymorphisms of chemokine (C-X3-C motif) receptor 1 gene modify amyotrophic lateral sclerosis outcome: A population-based study. Muscle Nerve. 2018;57(2):212–6. · DOI
- Kanning KC, Kaplan A, Henderson CE. Motor neuron diversity in development and disease. Annu Rev Neurosci. 2010;33:409–40. · DOI
- Zhang X, Chen S, Song L, Tang Y, Shen Y, Jia L, et al. MTOR-independent, autophagic enhancer trehalose prolongs motor neuron survival and ameliorates the autophagic flux defect in a mouse model of amyotrophic lateral sclerosis. Autophagy. 2014;10(4):588–602. · DOI
- Choi CI, Lee YD, Gwag BJ, Cho SI, Kim SS, Suh-Kim H. Effects of estrogen on lifespan and motor functions in female hSOD1 G93A transgenic mice. J Neurol Sci. 2008;268(1–2):40–7. · DOI
- Zhang X, Chen S, Li L, Wang Q, Le W. Decreased level of 5-methyltetrahydrofolate: a potential biomarker for pre-symptomatic amyotrophic lateral sclerosis. J Neurol Sci. 2010;293(1):102–5. · DOI
- Schneider CA, Rasband WS, Eliceiri KW. NIH Image to ImageJ: 25 years of image analysis. Nat Methods. 2012;9(7):671–5. · DOI · Paper page
- Hall ED, Oostveen JA, Gurney ME. Relationship of microglial and astrocytic activation to disease onset and progression in a transgenic model of familial ALS. Glia. 1998;23(3):249–56. · DOI
- Gowing G, Philips T, Van Wijmeersch B, Audet JN, Dewil M, Van Den Bosch L, et al. Ablation of proliferating microglia does not affect motor neuron degeneration in amyotrophic lateral sclerosis caused by mutant superoxide dismutase. J Neurosci. 2008;28(41):10234–44. · DOI
- Castro-Sanchez S, Garcia-Yague AJ, Lopez-Royo T, Casarejos M, Lanciego JL, Lastres-Becker I. Cx3cr1-deficiency exacerbates alpha-synuclein-A53T induced neuroinflammation and neurodegeneration in a mouse model of Parkinson’s disease. Glia. 2018; 66(8):1752–62 · DOI
- Tang Z, Gan Y, Liu Q, Yin JX, Liu Q, Shi J, et al. CX3CR1 deficiency suppresses activation and neurotoxicity of microglia/macrophage in experimental ischemic stroke. J Neuroinflammation. 2014;11:26. · DOI
- Zhang L, Xu J, Gao J, Wu Y, Yin M, Zhao W. CD200-, CX3CL1-, and TREM2-mediated neuron-microglia interactions and their involvements in Alzheimer’s disease. Rev Neurosci. 2018; 29(8):837–48 · DOI
- Mecca C, Giambanco I, Donato R, Arcuri C. Microglia and aging: the role of the TREM2-DAP12 and CX3CL1-CX3CR1 axes. Int J Mol Sci. 2018;19(1):e318. · DOI · Paper page
- Chapman GA, Moores K, Harrison D, Campbell CA, Stewart BR, Strijbos PJ. Fractalkine cleavage from neuronal membranes represents an acute event in the inflammatory response to excitotoxic brain damage. J Neurosci. 2000;20(15):RC87. · DOI
- Cerbai F, Lana D, Nosi D, Petkova-Kirova P, Zecchi S, Brothers HM, et al. The neuron-astrocyte-microglia triad in normal brain ageing and in a model of neuroinflammation in the rat hippocampus. PLoS One. 2012;7(9):e45250. · DOI · Paper page
- Geloso MC, Corvino V, Marchese E, Serrano A, Michetti F, D’Ambrosi N. The dual role of microglia in ALS: mechanisms and therapeutic approaches. Front Aging Neurosci. 2017;9:242. · DOI
- Hooten KG, Beers DR, Zhao W, Appel SH. Protective and toxic neuroinflammation in amyotrophic lateral sclerosis. Neurotherapeutics. 2015;12(2):364–75. · DOI
- Liao B, Zhao W, Beers DR, Henkel JS, Appel SH. Transformation from a neuroprotective to a neurotoxic microglial phenotype in a mouse model of ALS. Exp Neurol. 2012;237(1):147–52. · DOI
Cited by
Sorted by citations
Béland, L.-C., Markovinovic, A., Jakovac, H., De Marchi, F., Bilic, E., Mazzini, L., Kriz, J., & Munitic, I. (2020) · Brain Communications · doi:10.1093/braincomms/fcaa124 · Cited by 125
Puntambekar, S. S., Moutinho, M., Lin, P. B.-C., Jadhav, V., Tumbleson-Brink, D., Balaji, A., Benito, M. A., Xu, G., Oblak, A., Lasagna-Reeves, C. A., et al. (2022) · Molecular Neurodegeneration · doi:10.1186/s13024-022-00545-9 · Cited by 113
“Similar results have been reported in the SOD1-G93A model of ALS, where Cx3cr1 deficiency is associated with increased SOD1 aggregation, neuronal loss and inflammatory microglial activation with impaired autophagy-lysosomal degradation pathways and autophagosome maturation [18, 19].”
ResultChen, X., Jiang, M., Li, H., Wang, Y., Shen, H., Li, X., Zhang, Y., Wu, J., Yu, Z., & Chen, G. (2020) · Journal of Neuroinflammation · doi:10.1186/s12974-020-01882-6 · Cited by 85
Physical Exercise-Induced Myokines in Neurodegenerative Diseases
Lee, B., Shin, M., Park, Y., Won, S.-Y., & Cho, K. S. (2021) · International Journal of Molecular Sciences · doi:10.3390/ijms22115795 · Cited by 79
Metadata
- Authors
- Zhang, J., Liu, Y., Liu, X., Li, S., Cheng, C., Chen, S., & Le, W.
- Venue
- Translational Neurodegeneration
- Published
- 2018-12
- Volume
- 7
- Issue
- 1
- ISSN
- 2047-9158
- PMC
- PMC6309063
- Cited by
- 57
- References
- 6
- Language
- en
- Funders
- the National Natural Sciences Foundation of China (NSFC 81430021, NSFC 81370470)
- he Program for Liaoning Innovative Research Team in University (LT2015009)
- Liaoning Science and Technology Project (2015225008)
About these checks
Registry, retraction, Cites and statistics results are computed, not judged, with one exception: a printed reference that no index lists is read once by a model before it counts as a citation error. Claims are extracted by a model and kept only when their quote appears verbatim in the text; each cited source is then checked, with a model’s help, for whether it says what the claim relies on. Those verdicts can be wrong — read the claim’s quote and the cited source before relying on one.
Statistics and arithmetic are recomputed, not judged.
Confidence bands are shown only for fields calibrated on our annotated test set. None is calibrated yet, so no band is shown.
What counts as a claim ›How we measure confidence ›How we check this ›
Are you an author, or do you see a problem with this page? Request a review
