

The DOI matches its Crossref record; 57 of the 59 references it cites were found in a registry or an index.
Cardiorespiratory fitness as a predictor of intestinal microbial diversity and distinct metagenomic functions
Open accessAbstract
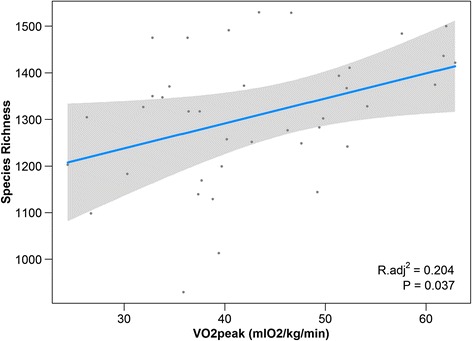
BACKGROUND: Reduced microbial diversity in human intestines has been implicated in various conditions such as diabetes, colorectal cancer, and inflammatory bowel disease. The role of physical fitness in the context of human intestinal microbiota is currently not known. We used high-throughput sequencing to analyze fecal microbiota of 39 healthy participants with similar age, BMI, and diets but with varying cardiorespiratory fitness levels. Fecal short-chain fatty acids were analyzed using gas chromatography. RESULTS: We showed that peak oxygen uptake (VO2peak), the gold standard measure of cardiorespiratory fitness, can account for more than 20 % of the variation in taxonomic richness, after accounting for all other factors, including diet. While VO2peak did not explain variation in beta diversity, it did play a significant role in explaining variation in the microbiomes' predicted metagenomic functions, aligning positively with genes related to bacterial chemotaxis, motility, and fatty acid biosynthesis. These predicted functions were supported by measured increases in production of fecal butyrate, a short-chain fatty acid associated with improved gut health, amongst physically fit participants. We also identified increased abundances of key butyrate-producing taxa (Clostridiales, Roseburia, Lachnospiraceae, and Erysipelotrichaceae) amongst these individuals, which likely contributed to the observed increases in butyrate levels. CONCLUSIONS: Results from this study show that cardiorespiratory fitness is correlated with increased microbial diversity in healthy humans and that the associated changes are anchored around a set of functional cores rather than specific taxa. The microbial profiles of fit individuals favor the production of butyrate. As increased microbiota diversity and butyrate production is associated with overall host health, our findings warrant the use of exercise prescription as an adjuvant therapy in combating dysbiosis-associated diseases.
Overview
The claims and statistics of this paper haven’t been checked yet.
Run the check — free, no account needed. It reads the open-access text and checks the sources it cites.
Integrity signals
Registry
Cites
Statistics
Figures
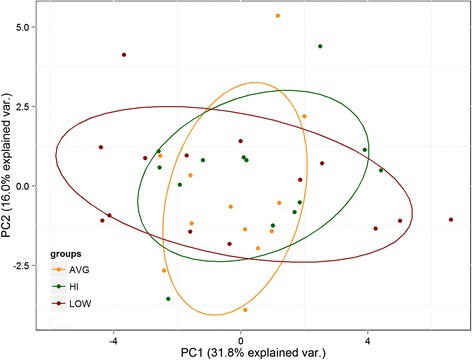
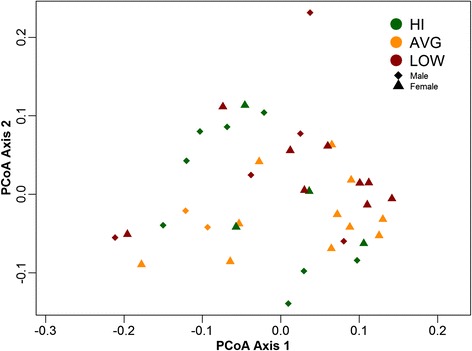
Verification
Claims the paper makes
The claims and statistics of this paper haven’t been checked yet.
Run the check — free, no account needed. It reads the open-access text and checks the sources it cites.
Claims other papers make about this one
Each is checked against this paper’s own text: does it say what the citing paper says it does?
The cited source says what the claim attributes to it.
In the citing paper
“regular physical activity may help to combat reductions in butyrate-producing microbiota (Clostridiales, Roseburia, Lachnospiraceae, and Erysipelotrichaceae) [102] and Lactobacillus levels [103] that are commonly seen with aging [15, 84, 98].”
From Gut Microbiota Contribute to Age-Related Changes in Skeletal Muscle Size, Composition, and Function: Biological Basis for a Gut-Muscle Axis (2018) · cites this paper as [102]
In the citing paper
“Observational studies show exercise alters gut microbiome composition in mice14 and humans15–18.”
From Exercise-induced microbiota metabolite enhances CD8 T cell antitumor immunity promoting immunotherapy efficacy (2025) · cites this paper as [16]
In the citing paper
“Cardiorespiratory fitness has also been associated with higher fecal levels of butyrate and increased abundances of butyrate-producing taxa, including Clostridiales, Roseburia, Lachnospiraceae, and Erysipelotrichaceae.111”
From Influence of the Gut Microbiome, Diet, and Environment on Risk of Colorectal Cancer (2020) · cites this paper as [111]
In the citing paper
“Exercise appears to be able to enrich microbiota diversity [20–25]”
From International Society of Sports Nutrition Position Stand: Probiotics (2019) · cites this paper as [20]
In the citing paper
“Protein intake appears to be a strong modulator of the microbiota [20, 32, 34]”
From International Society of Sports Nutrition Position Stand: Probiotics (2019) · cites this paper as [20]
In the citing paper
“In addition, the gut microbiota with its ability to harvest energy, modulate the immune system, and influence gastrointestinal health, likely plays an important role in athlete health, wellbeing, and sports performance.”
From The athletic gut microbiota (2020) · cites this paper as [14]
In the citing paper
“Also identified was a core set of gene related functions rather than a core set of bacterial taxa in individuals with high levels of fitness [14].”
From The athletic gut microbiota (2020) · cites this paper as [14]
In the citing paper
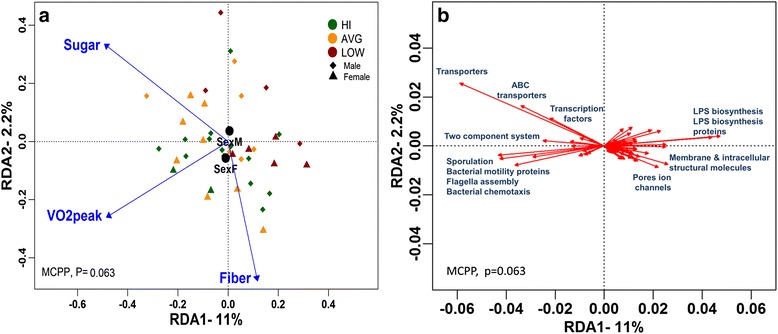
“VO2peak was inversely correlated with LPS biosynthesis and LPS biosynthesis proteins which were elevated among less fit participants.”
From The athletic gut microbiota (2020) · cites this paper as [14]
In the citing paper
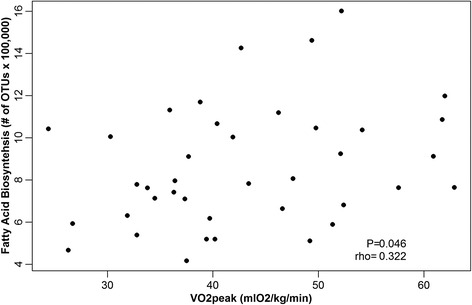
“Additionally, enhanced bacterial diversity was correlated positively with certain microbial metabolic functions including chemotaxis, motility, and fatty acid biosynthesis.”
From The athletic gut microbiota (2020) · cites this paper as [14]
In the citing paper
“Further, ~ 20% of the variation in gut bacterial alpha diversity could be explained by VO2peak alone; in fact, VO2peak stood as the only variable that contributed significantly to increased alpha diversity.”
From The athletic gut microbiota (2020) · cites this paper as [14]
In the citing paper
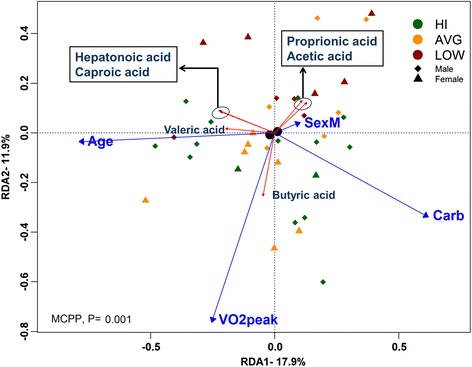
“Increases in fecal butyrate were observed when relative abundances of Clostridiales, Roseburia, Lachnospiraceae, and Erysipelotrichaceae were increased [14].”
From The athletic gut microbiota (2020) · cites this paper as [14]
In the citing paper
“Functional categories most strongly correlated with VO2peak were related to bacterial motility (bacterial motility proteins, flagella assembly, and bacterial chemotaxis), sporulation, and to a lesser extent the two-component system known to enable bacterial communities to sense and respond to environmental factors [14].”
From The athletic gut microbiota (2020) · cites this paper as [14]
In the citing paper
“In healthy individuals, Estaki et al. [14] reported higher cardiorespiratory fitness (as measured by peak or maximum oxygen uptake, VO2peak or VO2max) correlated with increases in both microbial diversity and fecal butyrate (see Table 2).”
From The athletic gut microbiota (2020) · cites this paper as [14]
In the citing paper
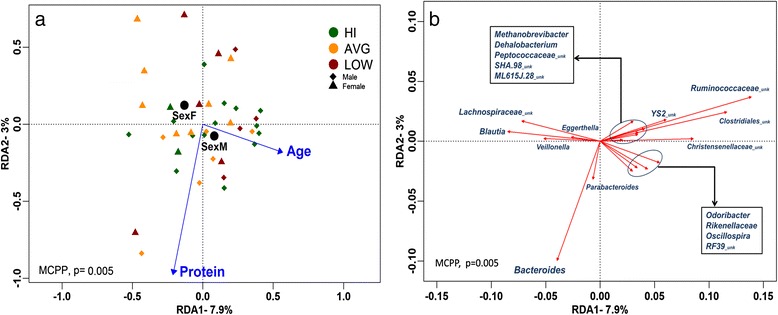
“A strong association was evident between protein intake and Bacteroides and, in particular, Ruminococcaceae and Lachnospiraceae, two of the most abundant families in human gut environments [188], in explaining community diversity.”
From The athletic gut microbiota (2020) · cites this paper as [14]
In the citing paper
“correlations between microbial diversity and cardiorespiratory fitness [102] in concert with the exercise training mediated rescue of high-fat diet-induced microbial disturbance [103] support the idea that exercise training may impart beneficial effects on gut health.”
From Gut Microbiota Contribute to Age-Related Changes in Skeletal Muscle Size, Composition, and Function: Biological Basis for a Gut-Muscle Axis (2018) · cites this paper as [102]
Self-check
Percentages, sums and reported differences re-computed from the paper’s own numbers.
The self-check needs the paper’s full text.
Citations
Cites
R: A Language and Environment for Statistical Computing
R Core Team (2000) · doi:10.32614/r.manuals · Cited by 355,893
QIIME allows analysis of high-throughput community sequencing data
Caporaso, J. G., Kuczynski, J., Stombaugh, J., Bittinger, K., Bushman, F. D., Costello, E. K., Fierer, N., Peña, A. G., Goodrich, J. K., Gordon, J. I., et al. (2010) · Nature Methods · doi:10.1038/nmeth.f.303 · Cited by 34,887
vegan: Community Ecology Package
Oksanen, J., Simpson, G. L., Blanchet, F. G., Kindt, R., Legendre, P., Minchin, P. R., O’Hara, R. B., Sólymos, P., Stevens, M. H. H., Szöcs, E., et al. (2001) · doi:10.32614/cran.package.vegan · Cited by 27,099
ggplot2: Elegant Graphics for Data Analysis
Wickham, H. (2009) · doi:10.1007/978-0-387-98141-3 · Cited by 14,447
Predictive functional profiling of microbial communities using 16S rRNA marker gene sequences
Langille, M. G. I., Zaneveld, J., Caporaso, J. G., McDonald, D., Knights, D., Reyes, J. A., Clemente, J. C., Burkepile, D. E., Vega Thurber, R. L., Knight, R., et al. (2013) · Nature Biotechnology · doi:10.1038/nbt.2676 · Cited by 9,116
Klindworth, A., Pruesse, E., Schweer, T., Peplies, J., Quast, C., Horn, M., & Glöckner, F. O. (2013) · Nucleic Acids Research · doi:10.1093/nar/gks808 · Cited by 8,850
Enterotypes of the human gut microbiome
MetaHIT Consortium (additional members), Arumugam, M., Raes, J., Pelletier, E., Le Paslier, D., Yamada, T., Mende, D. R., Fernandes, G. R., Tap, J., Bruls, T., et al. (2011) · Nature · doi:10.1038/nature09944 · Cited by 7,548
Changes of Intestinal Functions in Liver Cirrhosis
Fukui, H., & Wiest, R. (2016) · Inflammatory Intestinal Diseases · doi:10.1159/000444436 · Cited by 6,820
Linking long-term dietary patterns with gut microbial enterotypes
Wu, G. D., Chen, J., Hoffmann, C., Bittinger, K., Chen, Y.-Y., Keilbaugh, S. A., Bewtra, M., Knights, D., Walters, W. A., Knight, R., et al. (2011) · Science · doi:10.1126/science.1208344 · Cited by 6,513
Ecologically meaningful transformations for ordination of species data
Legendre, P., & Gallagher, E. D. (2001) · Oecologia · doi:10.1007/s004420100716 · Cited by 5,556
Cited by
Sorted by citations
Items 401–475 of 475
Genetic and Environmental Influences on Gut Microbiota
Ishiguro, E. E., Haskey, N., & Campbell, K. (2018) · Elsevier eBooks · doi:10.1016/b978-0-12-810541-2.00005-1
Aerobic Capacity and Bile Acid Metabolism
Maurer, A. (2017) · KU ScholarWorks (The University of Kansas)
Resende, A. D. S. (2019) · Digital Library of Theses and Dissertations (Universidade de São Paulo) · doi:10.11606/d.39.2019.tde-13062019-161054
Physical activity regulates the intestinal microbiota composition
Jurdana, M., & Barlič‐Maganja, D. (2019) · Annales Kinesiologiae · doi:10.35469/ak.2019.185
Leite, G. S. F. (2021) · Digital Library of Theses and Dissertations (Universidade de São Paulo) · doi:10.11606/t.39.2021.tde-18052021-165712
Research in Exercise Science and Gut Microbiota: A Two-way Relationship
Petriz, B. A., de Almeida, J. A., Ribeiro, F. M., & Franco, O. L. (2021) · Elsevier eBooks · doi:10.1016/b978-0-12-819265-8.00066-8
Interaction of quinolone antibiotics with the human intestinal CACO-2 cell model
Kang, M. S. (2001) · Aston Publications Explorer (Aston University) · doi:10.48780/publications.aston.ac.uk.00012354
Aún puede controlarse la tuberculosis
Megías, J. A. (1994) · Medicina integral: Medicina preventiva y asistencial en atención primaria de la salud
Gut microbiota related to nutrition and physical activity: an integrative review
Campos, L. F. (2021) · International Journal of Nutrology · doi:10.54448/ijn22102
Assistance of Gut Microbiota in Depression
Reji, R. T., Krishna, R., & Kumar, R. S. (2021) · Journal of Drug Delivery and Therapeutics · doi:10.22270/jddt.v11i6-s.5202
Cotter, P. D., & Barton, W. (2019) · Faculty Opinions – Post-Publication Peer Review of the Biomedical Literature · doi:10.3410/f.728374643.793567398
Sporcuların bağırsak mikrobiyomu üzerinde egzersizin etkisi: sistematik bir derleme
BÖLÜKBAŞ, M. G., & Vatansever, Ş. (2022) · Anadolu Kliniği Tıp Bilimleri Dergisi · doi:10.21673/anadoluklin.1059732
Metabolic mapping of high-fit and low-fit individuals for human physiological health
Janssen, J. J. E. (2022) · doi:10.18174/573397
Preventing age‐related vascular dysfunction: the gut of the matter
Chavez, D. A., & Bohmke, N. J. (2022) · The Journal of Physiology · doi:10.1113/jp283910
Gut microbiota and symptoms of psychosis: Is there a link?
Nocera, A. (2023) · Current Psychiatry · doi:10.12788/cp.0328
Cai, Y., zhang, K., Shen, S., Duan, J., Li, M., Yuan, H., Huang, Y., & Gao, X. (2023) · Research Square · doi:10.21203/rs.3.rs-3103141/v1
Pérez-Llano, B., Rodríguez, C. M., & Fraile, E. G. (2024) · Research Square · doi:10.21203/rs.3.rs-4026911/v1
The Gut Microbiome and Metabolomics Profiles of dust- exposed ratsPreprint
Shen, X., Wang, M., Pei, S., Xiao, S., Xiao, K., Li, J., Li, X., Xia, Q., Liu, H., & Shen, F. (2024) · Research Square · doi:10.21203/rs.3.rs-4346502/v1
Impact of physical activity on the development of Alzheimer's disease
Paśnik, J., Sendecka, G., Kistela, N., Hądzlik, I., Durowicz, M., & Piotrowski, J. (2024) · Journal of Education Health and Sport · doi:10.12775/jehs.2024.71.51112 · Cited by 1
Особливості мікробіому спортсменів з аеробним механізмом енергозабезпечення
Палладіна, О. Л., & Kaliga, A. M. (2024) · doi:10.36059/978-966-397-383-8-92
Llano, B. P., Rodríguez, C. M., & Fraile, E. G. (2026) · BMC Nutrition · doi:10.1186/s40795-026-01366-5
Multisymptom Burden in Cancer Survivors: Benefits of Physical Activity
Cardaci, T. D., VanderVeen, B. N., Bullard, B. M., Carson, J. A., & Murphy, E. A. (2024) · Exercise Sport and Movement · doi:10.1249/esm.0000000000000029
Obesity, gut bacteria, and the epigenetic control of metabolic disease
Guidi, L., Martínez‐Téllez, B., & Santos, C. P. O. (2024) · Elsevier eBooks · doi:10.1016/b978-0-443-18979-1.00013-7
Einflussfaktoren auf das gastrointestinale Mikrobiom
Macke, L., & Vasapolli, R. (2024) · Springer eBooks · doi:10.1007/978-3-662-68455-9_7
The Gut Microbiome and Metabolomics Profiles of Dust-exposed Rats
Shen, X., Wang, M., Pei, S., Xiao, S., Xiao, K., Li, J., Li, X., Xia, Q., Liu, H., & Shen, F. (2025) · Combinatorial Chemistry & High Throughput Screening · doi:10.2174/0113862073354023250314050225
Alteration of gut microbiota composition in patients with prediabetes and type 2 diabetes mellitus
Александровна, М. О., Алексеевич, Т. А., Олеговна, Щ. А., Martirosian, N. S., Кузина, И. А., Валерьевна, Г. Е., Эдуардовна, Т. М., Акрамовна, Э. Э., & Petunina, N. A. (2025) · Meditsinskiy sovet = Medical Council · doi:10.21518/ms2025-032
Az elhízásért az evolúció lenne a felelős?
Duda, E. (2025) · Magyar Tudomány · doi:10.1556/2065.186.2025.6.9
Lewis, G., Reczek, S., Malas, J., Ramanauskas, K., Walker, J. F., Cook, M. D., Horswill, C. A., & Hampton‐Marcell, J. (2025) · Research Square · doi:10.21203/rs.3.rs-6551234/v1
Individual identities and behaviors shape the microbial community lurking on clothes
Zhou, Z.-Z., Zheng, Y.-L., Grover, R., Malik, S., Patel, B., Srinivasan, V., Ding, L., & Zhu, Y. (2025) · Total Environment Microbiology · doi:10.1016/j.temicr.2025.100024
Athletes looking for a competitive edge may find it within their gut microbiome
Damman, C. J. (2024) · The Conversation · doi:10.64628/aai.snqptwpgm
Impact of physical activity level on adult gut microbiome composition and metabolic functionPreprint
Viera, A., Pozo, A., López, X., Morán, J., Sánchez-Doñas, C., Mieres-Amigo, P., Massoni-Mora, G., Court, F. A., Matsudo, S. M., & Calderón-Romero, P. (2025) · Research Square · doi:10.21203/rs.3.rs-7595052/v1
Shi, J., Nguyen, S. M., Yu, D., Wang, L., Liu, L., Cai, H., Wu, J., Long, J., Cai, Q., Shrubsole, M. J., et al. (2025) · Gut Microbes Reports · doi:10.1080/29933935.2025.2589861
Aya, V., Jiménez, P., Muñoz, E., & Ramírez, J. D. (2024) · Figshare · doi:10.6084/m9.figshare.26596778
Aune, S. K., Byrkjeland, R., Solheim, S., Arnesen, H., Trøseid, M., Awoyemi, A., Seljeflot, I., & Helseth, R. (2021) · Figshare · doi:10.6084/m9.figshare.14361701
Moitinho-Silva, L., Wegener, M., May, S., Schrinner, F., Akhtar, A., Boysen, T. J., Schaeffer, E., Hansen, C., Schmidt, T., Rühlemann, M. C., et al. (2021) · Figshare · doi:10.6084/m9.figshare.14721971
Aune, S. K., Byrkjeland, R., Solheim, S., Arnesen, H., Trøseid, M., Awoyemi, A., Seljeflot, I., & Helseth, R. (2021) · Figshare · doi:10.6084/m9.figshare.14361698
Aya, V., Jiménez, P., Muñoz, E., & Ramírez, J. D. (2024) · Figshare · doi:10.6084/m9.figshare.26596781
Jafaripour, S., Melvin, M., Turluk, M., Howard, E., Fancy, N., Schwagele, M., Zhang, H., Irungu, J. D. W., Wasik, B. R., Chou, D., et al. (2026) · iScience · doi:10.64898/2026.02.07.702670
Self-citationWu, J., Du, S., Sun, Y., Ye, J., & Xu, Y. (2026) · Frontiers in Medicine · doi:10.3389/fmed.2026.1771521
Duan, Y., Wang, L., Cui, H., Zilong, F. A. N. G., Lu, Y., & 孙中光 (2026) · Frontiers in Medicine · doi:10.3389/fmed.2026.1762454
Lewis, G., Adejumo, S. A., Reczek, S., Malas, J., Ramanauskas, K., Walker, J. F., Cook, M. D., Horswill, C. A., & Hampton‐Marcell, J. (2026) · Physiological Genomics · doi:10.1152/physiolgenomics.00278.2025
Gao, R., Wang, J., Song, J., Zhang, W., & Quan, L. (2026) · Frontiers in Microbiology · doi:10.3389/fmicb.2026.1790697
Kalkan, H. (2026) · Physiology · doi:10.5772/intechopen.1015465 · Cited by 1
Biliński, K., Wiśniewski, K., Rafner, L., Witko, P., & Gaweł-Dąbrowska, D. (2026) · Nutrients · doi:10.3390/nu18101523
The Role of Diet and Gut Microbiome in CKD Progression and Therapy
Lau, W. L., Li, W., Sumida, K., & Kalantar‐Zadeh, K. (2026) · Journal of Clinical Medicine · doi:10.3390/jcm15103934
Gould, A. A. M., Walsh, N. P., Tipton, M., Zurawlew, M. J., Robson, S. C., Shute, J. K., Watts, J. E. M., Tyson, H. C., Robinson, M. R., Roberts, A. J., et al. (2026) · Experimental Physiology · doi:10.1113/ep093100
Rui, L. I., Li-Yun, S. H. A., You-Guan, H. E. N. G., & Shen, W.-Q. (2026) · Shengming kexue · doi:10.3724/cbls.2026077
Calabrese, F. M., Bianco, A., Chiarini, M., Prospero, L., Franco, I., Bernardi, M., Celano, G., Calasso, M. P., Riezzo, G., Verrelli, N., et al. (2026) · Nutrients · doi:10.3390/nu18121972
Wang, Q., Zheng, W., Zhang, C., Lv, S., Peng, L., Chen, J., & Lu, A. (2026) · Genes & Diseases · doi:10.1016/j.gendis.2026.102315
Zhong, J., Wijaya, L., Sane, S., Atreya, A., Zhang, C., & Gopalan, V. (2026) · Research Square · doi:10.21203/rs.3.rs-10030154/v1
Crespo-Garcia, C., Borsati, A., Taaffe, D. R., Peddle‐McIntyre, C. J., Campbell, J. P., Avancini, A., Jeffery, E., Galvao, D. A., & Newton, R. U. (2026) · Sports Medicine · doi:10.1007/s40279-026-02481-w
Tumor associated depression, gut microbiota, and immune checkpoint inhibitor sensitivity
Wang, J. (2026) · Psycho-Oncologie · doi:10.18282/po5751
Ni, M., Wang, Q., Ye, T., Lei, H., Wang, Y., & Yuan, Y. (2026) · Journal of Ovarian Research · doi:10.1186/s13048-026-02164-0
Mental health and gut-brain crosstalk: implications for depression and Alzheimer's disease
Skourti, K., Katsaitis, F., Pavlidi, P., Anesti, M., Balla, J., Emvalomatis, A., Kokras, N., Dalla, C., & Sotiropoulos, I. (2026) · Neuroscience Applied · doi:10.1016/j.nsa.2026.107023
Jin, J., Xiao, Y., Xiao, Q., Diao, Y., & Su, M. (2026) · Research Square · doi:10.21203/rs.3.rs-10391928/v1
Exercise-driven microbiome changes regulate host immunity
Phelps, C. M., & Meisel, M. (2026) · Trends in Immunology · doi:10.1016/j.it.2026.08.001 · Cited by 1
Su, M., Jin, J., Lin, F., Yang, S., Diao, Y., & Lin, Z. (2026) · Frontiers in Microbiology · doi:10.3389/fmicb.2026.1887394
Pang, T., Zhou, X., & Ge, Z. (2026) · Metabolites · doi:10.3390/metabo16090638
The exercise–gut–muscle axis in physical frailty: A narrative review
Morishita, S., Iida, N., Sato, T., Endo, Y., Tanno, D., & Yabuki, S. (2026) · Journal of Aging Research and Lifestyle · doi:10.1016/j.jarlif.2026.100087
Microbial-derived exerkines as a model of drug discovery
Burke, B. I., Valentino, T. R., Ismaeel, A., Wen, Y., & McCarthy, J. J. (2026) · American Journal of Physiology-Cell Physiology · doi:10.1152/ajpcell.90006.2026
Prescribing Exercise as a Lifestyle Intervention
Karatzaferi, C., Osório, T. G., Conde, J., Arosa, L., Roditi, E.-E., & Sakkas, G. K. (2026) · Advances in predictive, preventive and personalised medicine · doi:10.1007/978-3-032-32838-0_11
Ying, X., Li, J., Tang, Y., Lu, G., Hong, L., & Zhan, Z. (2026) · Frontiers in Nutrition · doi:10.3389/fnut.2026.1932946
Neal, W. N., Kemp, K. M., Little, R. B., Carter, S. J., Schleicher, E. A., Motl, R. W., Lu, J., Lefkowitz, E. J., Oster, R. A., Norian, L. A., et al. (2026) · Nutrients · doi:10.3390/nu18193286
So, B., Jang, J.-H., Park, J., & Kang, C. (2026) · Sports · doi:10.3390/sports14100436
Ondrak, K. S., Seicshnaydre, E. A., Duffy, S., Rodriguez, C. L., Scott, C., Gladish, S., & Byerley, L. O. (2026) · Nutrients · doi:10.3390/nu18193300
Human Milk Oligosaccharides in Sports Nutrition: Biological Rationale and Current Evidence
Hu, K., Zhang, K., Huang, C., Wang, Z., Huang, X., Li, Y., Cheng, L., & Wu, Y. (2026) · Nutrients · doi:10.3390/nu18203367
Sage, S. A., Abbott, S. J., Korczak, R., & Williams, N. C. (2026) · Journal of the International Society of Sports Nutrition · doi:10.1080/15502783.2026.2748763
Montano, A., Paolini, A., Felli, C., Bruno, S. P., Baldassarre, A., Sandal, S., & Masotti, A. (2026) · Frontiers in Sports and Active Living · doi:10.3389/fspor.2026.1940762
Metadata
- Authors
- Estaki, M., Pither, J., Baumeister, P., Little, J. P., Gill, S. K., Ghosh, S., Ahmadi-Vand, Z., Marsden, K. R., & Gibson, D. L.
- Affiliations
- University of British Columbia (CA)
- University of British Columbia, Okanagan Campus (CA)
- Corresponding author
- Gibson, Deanna L.
- Venue
- Microbiome
- Published
- 2016-08-08
- Volume
- 4
- Issue
- 1
- Pages
- 42-42
- ISSN
- 2049-2618 (ISSN-L)
- PMC
- PMC4976518
- OpenAlex
- W2495055679
- Cited by
- 476
- References
- 59
- Citations by year
- 2026: 44 · 2025: 53 · 2024: 66 · 2023: 54 · 2022: 60 · 2021: 67 · 2020: 42 · 2019: 46 · 2018: 19 · 2017: 22
- FWCI
- 15.08
- Type
- journal article
- Language
- en
- Open access
- gold
- doi.org
- Licence
- cc-by
- Locations
- Microbiome (publishedVersion, cc-by)
- PubMed Central (publishedVersion, cc-by)
- PubMed (publishedVersion)
- cIRcle (University of British Columbia) (submittedVersion, cc-by)
- Funders
- Natural Sciences and Engineering Research Council of Canada
- Canadian Institutes of Health Research
- Michael Smith Foundation for Health Research
- Dairy Farmers of Canada
- Topics
- Life Sciences › Biochemistry, Genetics and Molecular Biology › Molecular Biology › Gut microbiota and health
- Health Sciences › Dentistry › Periodontics › Oral microbiology and periodontitis research
- Life Sciences › Agricultural and Biological Sciences › Food Science › Probiotics and Fermented Foods
- Keywords
- cardiorespiratory fitness, gut microbiota, gut microbiota diversity, peak oxygen uptake, butyrate production, short-chain fatty acids, butyrate-producing bacteria, Roseburia, Lachnospiraceae, Clostridiales, Erysipelotrichaceae, dysbiosis
- MeSH terms
- Gastrointestinal Microbiome, Cardiorespiratory Fitness, Adult, Bacteria, Base Sequence, Butyrates, Chromatography, Gas, Fatty Acids, Volatile, Feces, Female, Humans, Intestines, Male, Pulmonary Gas Exchange, Exercise, Sequence Analysis, DNA, Metagenome, Young Adult, High-Throughput Nucleotide Sequencing
About these checks
Registry, retraction, Cites and statistics results are computed, not judged, with one exception: a printed reference that no index lists is read once by a model before it counts as a citation error. Claims are extracted by a model and kept only when their quote appears verbatim in the text; each cited source is then checked, with a model’s help, for whether it says what the claim relies on. Those verdicts can be wrong — read the claim’s quote and the cited source before relying on one.
Statistics and arithmetic are recomputed, not judged.
Confidence bands are shown only for fields calibrated on our annotated test set. None is calibrated yet, so no band is shown.
What counts as a claim ›How we measure confidence ›How we check this ›
Are you an author, or do you see a problem with this page? Request a review
