

Taxa-function robustness in microbial communities
Open accessThe DOI matches its Crossref record; 62 of the 62 references it cites were found in a registry or an index.
Abstract
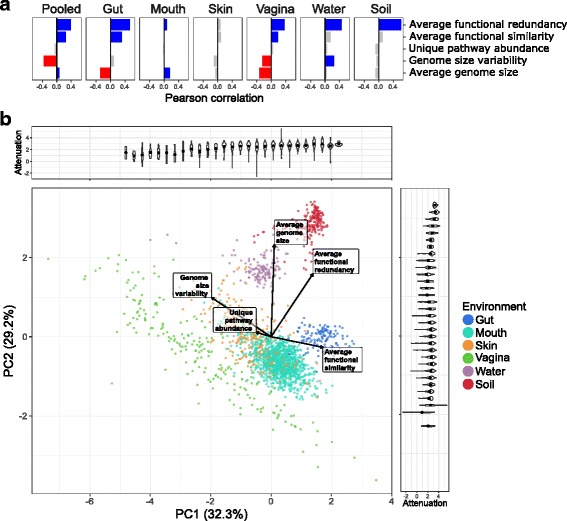
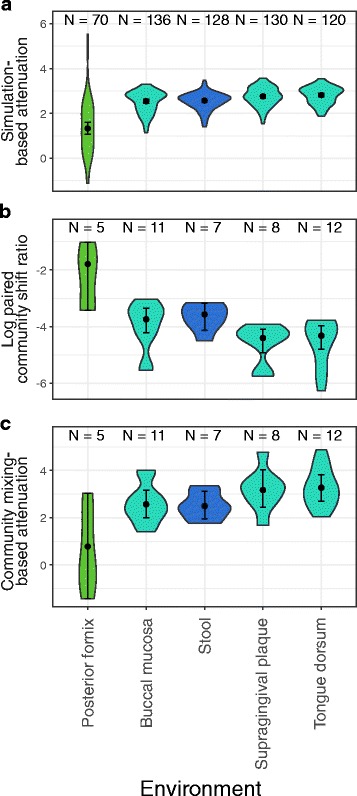
BACKGROUND: The species composition of a microbial community is rarely fixed and often experiences fluctuations of varying degrees and at varying frequencies. These perturbations to a community's taxonomic profile naturally also alter the community's functional profile-the aggregate set of genes encoded by community members-ultimately altering the community's overall functional capacities. The magnitude of such functional changes and the specific shift that will occur in each function, however, are strongly dependent on how genes are distributed across community members' genomes. This gene distribution, in turn, is determined by the taxonomic composition of the community and would markedly differ, for example, between communities composed of species with similar genomic content vs. communities composed of species whose genomes encode relatively distinct gene sets. Combined, these observations suggest that community functional robustness to taxonomic perturbations could vary widely across communities with different compositions, yet, to date, a systematic study of the inherent link between community composition and robustness is lacking. RESULTS: In this study, we examined how a community's taxonomic composition influences the robustness of that community's functional profile to taxonomic perturbation (here termed taxa-function robustness) across a wide array of environments. Using a novel simulation-based computational model to quantify this taxa-function robustness in host-associated and non-host-associated communities, we find notable differences in robustness between communities inhabiting different body sites, including significantly higher robustness in gut communities compared to vaginal communities that cannot be attributed solely to differences in species richness. We additionally find between-site differences in the robustness of specific functions, some of which are potentially related to site-specific environmental conditions. These taxa-function robustness differences are most strongly associated with differences in overall functional redundancy, though other aspects of gene distribution also influence taxa-function robustness in certain body environments, and are sufficient to cluster communities by environment. Further analysis revealed a correspondence between our robustness estimates and taxonomic and functional shifts observed across human-associated communities. CONCLUSIONS: Our analysis approach revealed intriguing taxa-function robustness variation across environments and identified features of community and gene distribution that impact robustness. This approach could be further applied for estimating taxa-function robustness in novel communities and for informing the design of synthetic communities with specific robustness requirements.
Overview
The claims and statistics of this paper haven’t been checked yet.
Free: it reads the open-access text and checks the first 5 claims that cite a source we can check. Create a free account to check every claim.
Integrity signals
Registry
Cites
Statistics
Figures
Verification
Claims the paper makes
The claims and statistics of this paper haven’t been checked yet.
Free: it reads the open-access text and checks the first 5 claims that cite a source we can check. Create a free account to check every claim.
Claims other papers make about this one
Each is checked against this paper’s own text: does it say what the citing paper says it does?
The source backs part of the claim, not all of it — or backs it for a different population, condition or comparison.
In the citing paper
“Robustness as a metric expresses information about the degree of change a community will undergo after a perturbation and how fast and to what degree it can recover, if at all.”
From The Microbiota-Gut-Brain Axis (2019) · cites this paper as Eng and Borenstein, 2018
Experimental — accuracy not yet measuredIn the citing paper
“This observation is somewhat analogous to the relative stability of the human gut microbiome functions compared with its microbial taxa (58, 59).”
From The human tumor microbiome is composed of tumor type–specific intracellular bacteria (2020) · cites this paper as [59]
Self-check
Percentages, sums and reported differences re-computed from the paper’s own numbers.
The self-check needs the paper’s full text.
Citations
Cites
KEGG: Kyoto Encyclopedia of Genes and Genomes
Kanehisa, M. (2000) · Nucleic Acids Research · doi:10.1093/nar/28.1.27 · Cited by 37,077 · cited 7×
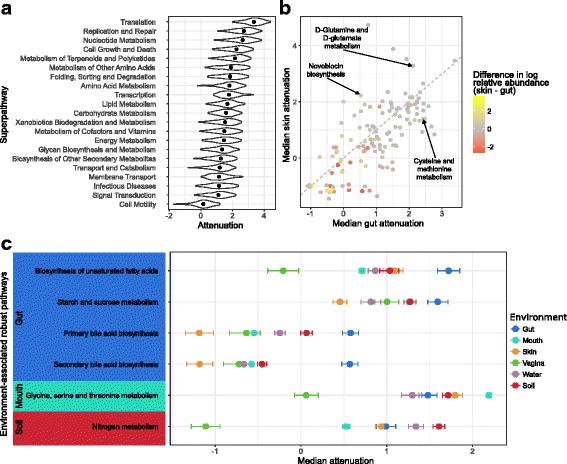
“4 Attenuation of individual functions. a The density of attenuation values for each KEGG superpathway across all communities, with dots indicating the median attenuation. b A scatterplot of the median attenuation of each function in skin communities vs. gut communities.”
InfluentialQIIME allows analysis of high-throughput community sequencing data
Caporaso, J. G., Kuczynski, J., Stombaugh, J., Bittinger, K., Bushman, F. D., Costello, E. K., Fierer, N., Peña, A. G., Goodrich, J. K., Gordon, J. I., et al. (2010) · Nature Methods · doi:10.1038/nmeth.f.303 · Cited by 34,887 · cited 1×
“me), which provides OTU tables generated with the QIIME workflow [53] using Greengenes OTUs [54].”
KEGG: Kyoto Encyclopedia of Genes and Genomes
Ogata, H., Goto, S., Sato, K., Fujibuchi, W., Bono, H., & Kanehisa, M. (1999) · Nucleic Acids Research · doi:10.1093/nar/27.1.29 · Cited by 31,232
Structure, function and diversity of the healthy human microbiome
The Human Microbiome Project Consortium (2012) · Nature · doi:10.1038/nature11234 · Cited by 11,726
A human gut microbial gene catalogue established by metagenomic sequencing
MetaHIT Consortium, Qin, J., Li, R., Raes, J., Arumugam, M., Burgdorf, K. S., Manichanh, C., Nielsen, T., Pons, N., Levenez, F., et al. (2010) · Nature · doi:10.1038/nature08821 · Cited by 11,624 · cited 1×
“Using such data, gene-level analyses have provided insight into the functional capacities of various microbial communities [7, 8] and how those capacities change over time or vary with altered environmental conditions [9, 10].”
Greengenes, a Chimera-Checked 16S rRNA Gene Database and Workbench Compatible with ARB
DeSantis, T. Z., Hugenholtz, P., Larsen, N., Rojas, M., Brodie, E. L., Keller, K., Huber, T., Dalevi, D., Hu, P., & Andersen, G. L. (2006) · Applied and Environmental Microbiology · doi:10.1128/aem.03006-05 · Cited by 10,891 · cited 2×
“me), which provides OTU tables generated with the QIIME workflow [53] using Greengenes OTUs [54].”
Diet rapidly and reproducibly alters the human gut microbiome
David, L. A., Maurice, C. F., Carmody, R. N., Gootenberg, D. B., Button, J. E., Wolfe, B. E., Ling, A. V., Devlin, A. S., Varma, Y., Fischbach, M. A., et al. (2014) · Nature · doi:10.1038/nature12820 · Cited by 10,100 · cited 1×
“Indeed, noticeable alterations to taxonomic composition often accompany large environmental changes, such as in the gut microbiota following diet switches [47], in skin communities during and after”
Predictive functional profiling of microbial communities using 16S rRNA marker gene sequences
Langille, M. G. I., Zaneveld, J., Caporaso, J. G., McDonald, D., Knights, D., Reyes, J. A., Clemente, J. C., Burkepile, D. E., Vega Thurber, R. L., Knight, R., et al. (2013) · Nature Biotechnology · doi:10.1038/nbt.2676 · Cited by 9,116 · cited 4×
“KO abundances were predicted using PICRUSt [13] tables to first normalize each OTU’s relative abundance by its 16S rRNA copy number and then infer KO abundance from the genomic content of each OTU.”
InfluentialKEGG as a reference resource for gene and protein annotation
Kanehisa, M., Sato, Y., Kawashima, M., Furumichi, M., & Tanabe, M. (2016) · Nucleic Acids Research · doi:10.1093/nar/gkv1070 · Cited by 7,387 · cited 7×
“4 Attenuation of individual functions. a The density of attenuation values for each KEGG superpathway across all communities, with dots indicating the median attenuation. b A scatterplot of the median attenuation of each function in skin communities vs. gut communities.”
InfluentialKEGG for linking genomes to life and the environment
Kanehisa, M., Araki, M., Goto, S., Hattori, M., Hirakawa, M., Itoh, M., Katayama, T., Kawashima, S., Okuda, S., Tokimatsu, T., et al. (2007) · Nucleic Acids Research · doi:10.1093/nar/gkm882 · Cited by 6,782 · cited 1×
“Pathwaylevel functional summaries, as defined by the KEGG BRITE hierarchy [57], were obtained by evenly distributing each KO’s average copy number across all pathways that contain that KO.”
Cited by
Cryan, J. F., O'Riordan, K. J., Cowan, C. S. M., Sandhu, K. V., Bastiaanssen, T. F. S., Boehme, M., Codagnone, M. G., Cussotto, S., Fulling, C., Golubeva, A. V., et al. (2019) · Physiological Reviews · doi:10.1152/physrev.00018.2018 · Cited by 5,286
The human tumor microbiome is composed of tumor type–specific intracellular bacteria
Nejman, D., Livyatan, I., Fuks, G., Gavert, N., Zwang, Y., Geller, L. T., Rotter-Maskowitz, A., Weiser, R., Mallel, G., Gigi, E., et al. (2020) · Science · doi:10.1126/science.aay9189 · Cited by 2,464
From hairballs to hypotheses–biological insights from microbial networks
Röttjers, L., & Faust, K. (2018) · FEMS Microbiology Reviews · doi:10.1093/femsre/fuy030 · Cited by 714
“For example, the taxonomic composition of the gutmicrobiome may not be robust to dietary changes (David et al. 2014), even when the functional composition does display robustness (Eng and Borenstein 2018).”
BackgroundQin, Y., Havulinna, A. S., Liu, Y., Jousilahti, P., Ritchie, S. C., Tokolyi, A., Sanders, J. G., Valsta, L., Brożyńska, M., Zhu, Q., et al. (2022) · Nature Genetics · doi:10.1038/s41588-021-00991-z · Cited by 586
The Healthy Microbiome—What Is the Definition of a Healthy Gut Microbiome?
Shanahan, F., Ghosh, T. S., & O’Toole, P. W. (2021) · Gastroenterology · doi:10.1053/j.gastro.2020.09.057 · Cited by 383
Metadata
- Authors
- Eng, A., & Borenstein, E.
- Affiliations
- University of Washington (US)
- Santa Fe Institute (US)
- Corresponding author
- Borenstein, Elhanan
- Venue
- Microbiome
- Published
- 2018-03-02
- Volume
- 6
- Issue
- 1
- Pages
- 45-45
- ISSN
- 2049-2618 (ISSN-L)
- PMC
- PMC5833107
- OpenAlex
- W2794489850
- Cited by
- 89
- References
- 62
- Citations by year
- 2026: 10 · 2025: 10 · 2024: 8 · 2023: 7 · 2022: 14 · 2021: 22 · 2020: 8 · 2019: 6 · 2018: 4
- FWCI
- 3.56
- Type
- journal article
- Language
- en
- Open access
- gold
- doi.org
- Licence
- cc-by
- creativecommons.org/licenses/by/4.0/ (tdm)
- creativecommons.org/licenses/by/4.0/ (vor)
- Locations
- Microbiome (publishedVersion, cc-by)
- Europe PMC (PubMed Central) (publishedVersion, cc-by)
- PubMed Central (publishedVersion, cc-by)
- PubMed (publishedVersion)
- DOAJ (DOAJ: Directory of Open Access Journals) (submittedVersion, cc-by-sa)
- Funders
- National Institutes of Health (DP2 AT007802-01)
- Topics
- Life Sciences › Biochemistry, Genetics and Molecular Biology › Molecular Biology › Gut microbiota and health
- Physical Sciences › Environmental Science › Ecology › Microbial Community Ecology and Physiology
- Physical Sciences › Environmental Science › Nature and Landscape Conservation › Ecology and Vegetation Dynamics Studies
- Keywords
- host-associated microbiome, gut microbiota, vaginal microbiota, body site differences, community composition, synthetic microbial communities
- MeSH terms
- Bacteria, Computer Simulation, Environment, Female, Humans, Phylogeny, RNA, Ribosomal, 16S, Vagina, Gastrointestinal Tract, Biodiversity, Metagenomics, Cellular Microenvironment, Microbiota
About these checks
Registry, retraction, Cites and statistics results are computed, not judged, with one exception: a printed reference that no index lists is read once by a model before it counts as a citation error. Claims are extracted by a model and kept only when their quote appears verbatim in the text; each cited source is then checked, with a model’s help, for whether it says what the claim relies on. Those verdicts can be wrong — read the claim’s quote and the cited source before relying on one.
Statistics and arithmetic are recomputed, not judged.
Confidence bands are shown only for fields calibrated on our annotated test set. None is calibrated yet, so no band is shown.
What counts as a claim ›How we measure confidence ›How we check this ›
Are you an author, or do you see a problem with this page? Request a review
How to cite
Cite CoChat for the checks on this page, and the paper for its own findings.
- This page
- CoChat. (2026). Citation check: Taxa-function robustness in microbial communities. https://app.cochat.ai/papers/10.1186/s40168-018-0425-4
- The paper
- Eng, A., & Borenstein, E. (2018). Taxa-function robustness in microbial communities. Microbiome. https://doi.org/10.1186/s40168-018-0425-4
Data sources
Bibliographic data: Semantic Scholar, OpenAlex, Crossref.
Contains information from the Semantic Scholar Academic Graph Datasets, made available under the ODC Attribution License (ODC-BY 1.0).
Semantic Scholar’s data is described in: Kinney, R., et al. (2023). The Semantic Scholar Open Data Platform. arXiv:2301.10140.
