

The DOI matches its Crossref record; 57 of the 57 references it cites were found in a registry or an index.
Use of dietary indices to control for diet in human gut microbiota studies
Open accessAbstract
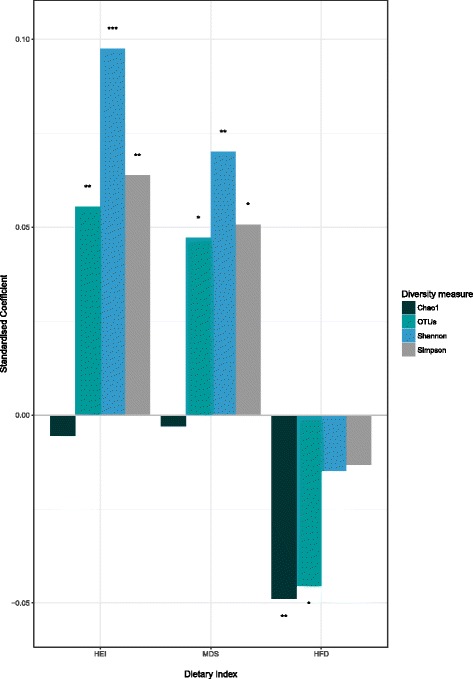
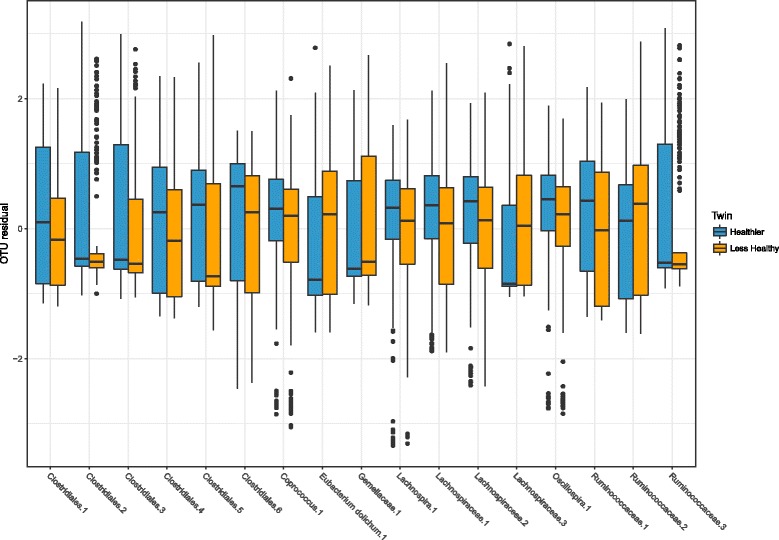
BACKGROUND: Environmental factors have a large influence on the composition of the human gut microbiota. One of the most influential and well-studied is host diet. To assess and interpret the impact of non-dietary factors on the gut microbiota, we endeavoured to determine the most appropriate method to summarise community variation attributable to dietary effects. Dietary habits are multidimensional with internal correlations. This complexity can be simplified by using dietary indices that quantify dietary variance in a single measure and offer a means of controlling for diet in microbiota studies. However, to date, the applicability of different dietary indices to gut microbiota studies has not been assessed. Here, we use food frequency questionnaire (FFQ) data from members of the TwinsUK cohort to create three different dietary measures applicable in western-diet populations: The Healthy Eating Index (HEI), the Mediterranean Diet Score (MDS) and the Healthy Food Diversity index (HFD-Index). We validate and compare these three indices to determine which best summarises dietary influences on gut microbiota composition. RESULTS: All three indices were independently validated using established measures of health, and all were significantly associated with microbiota measures; the HEI had the highest t values in models of alpha diversity measures, and had the highest number of associations with microbial taxa. Beta diversity analyses showed the HEI explained the greatest variance of microbiota composition. In paired tests between twins discordant for dietary index score, the HEI was associated with the greatest variation of taxa and twin dissimilarity. CONCLUSIONS: We find that the HEI explains the most variance in, and has the strongest association with, gut microbiota composition in a western (UK) population, suggesting that it may be the best summary measure to capture gut microbiota variance attributable to habitual diet in comparable populations.
Overview
The claims and statistics of this paper haven’t been checked yet.
Run the check — free, no account needed. It reads the open-access text and checks the sources it cites.
Integrity signals
Registry
Cites
Statistics
Figures
Verification
Claims the paper makes
The claims and statistics of this paper haven’t been checked yet.
Run the check — free, no account needed. It reads the open-access text and checks the sources it cites.
Claims other papers make about this one
Each is checked against this paper’s own text: does it say what the citing paper says it does?
In the citing paper
“The dietary index Healthy Eating Index (HEI) explained the most variance between diet and the microbiome across the three indices, with the strongest association with gut microbial composition than the other measures [91].”
From Effect of Diet on the Gut Microbiota: Rethinking Intervention Duration (2019) · cites this paper as [91]
Self-check
Percentages, sums and reported differences re-computed from the paper’s own numbers.
The self-check needs the paper’s full text.
Citations
Cites
QIIME allows analysis of high-throughput community sequencing data
Caporaso, J. G., Kuczynski, J., Stombaugh, J., Bittinger, K., Bushman, F. D., Costello, E. K., Fierer, N., Peña, A. G., Goodrich, J. K., Gordon, J. I., et al. (2010) · Nature Methods · doi:10.1038/nmeth.f.303 · Cited by 34,887
phyloseq: An R Package for Reproducible Interactive Analysis and Graphics of Microbiome Census Data
McMurdie, P. J., & Holmes, S. (2013) · PLoS ONE · doi:10.1371/journal.pone.0061217 · Cited by 21,942
Mixed-effects modeling with crossed random effects for subjects and items
Baayen, R. H., Davidson, D. J., & Bates, D. M. (2008) · Journal of Memory and Language · doi:10.1016/j.jml.2007.12.005 · Cited by 8,540
Human gut microbiome viewed across age and geography
Yatsunenko, T., Rey, F. E., Manary, M. J., Trehan, I., Dominguez-Bello, M. G., Contreras, M., Magris, M., Hidalgo, G., Baldassano, R. N., Anokhin, A. P., et al. (2012) · Nature · doi:10.1038/nature11053 · Cited by 7,815
Linking long-term dietary patterns with gut microbial enterotypes
Wu, G. D., Chen, J., Hoffmann, C., Bittinger, K., Chen, Y.-Y., Keilbaugh, S. A., Bewtra, M., Knights, D., Walters, W. A., Knight, R., et al. (2011) · Science · doi:10.1126/science.1208344 · Cited by 6,513
A standard procedure for creating a frailty index
Searle, S. D., Mitnitski, A., Gahbauer, E. A., Gill, T. M., & Rockwood, K. (2008) · BMC Geriatrics · doi:10.1186/1471-2318-8-24 · Cited by 3,568
Gut microbiota composition correlates with diet and health in the elderly
Claesson, M. J., Jeffery, I. B., Conde, S., Power, S. E., O’Connor, E. M., Cusack, S., Harris, H. M. B., Coakley, M., Lakshminarayanan, B., O’Sullivan, O., et al. (2012) · Nature · doi:10.1038/nature11319 · Cited by 3,314
The Treatment-Naive Microbiome in New-Onset Crohn’s Disease
Gevers, D., Kugathasan, S., Denson, L. A., Vázquez-Baeza, Y., Van Treuren, W., Ren, B., Schwager, E., Knights, D., Song, S. J., Yassour, M., et al. (2014) · Cell Host & Microbe · doi:10.1016/j.chom.2014.02.005 · Cited by 3,220
Human Genetics Shape the Gut Microbiome
Goodrich, J. K., Waters, J. L., Poole, A. C., Sutter, J. L., Koren, O., Blekhman, R., Beaumont, M., Van Treuren, W., Knight, R., Bell, J. T., et al. (2014) · Cell · doi:10.1016/j.cell.2014.09.053 · Cited by 3,164
The Effect of Diet on the Human Gut Microbiome: A Metagenomic Analysis in Humanized Gnotobiotic Mice
Turnbaugh, P. J., Ridaura, V. K., Faith, J. J., Rey, F. E., Knight, R., & Gordon, J. I. (2009) · Science Translational Medicine · doi:10.1126/scitranslmed.3000322 · Cited by 3,058 · cited 1×
“ing blooming of related bacteria (Erysipelotrichi) in the context of an unhealthy diet [5]; similarly, genus Oscillospira”
Background
Research works printed but not linked: 2
- RStudio Team. RStudio: integrated development for R. [internet]. Boston, MA: RStudio, Inc.; 2015. Available from: http://www.rstudio.com/ .
- Storey J, Bass A, Dabney A, Robinson D. Qvalue: Q-value estimation for false discovery rate control. 2015.
Cited by
Sorted by citations
Effect of Diet on the Gut Microbiota: Rethinking Intervention Duration
Leeming, E. R., Johnson, A. J., Spector, T. D., & Le Roy, C. I. (2019) · Nutrients · doi:10.3390/nu11122862 · Cited by 817
The human gut bacteria Christensenellaceae are widespread, heritable, and associated with health
Waters, J. L., & Ley, R. E. (2019) · BMC Biology · doi:10.1186/s12915-019-0699-4 · Cited by 818
Daily sampling reveals personalized diet-microbiome associations in humans
Johnson, A. J., Vangay, P., Al-Ghalith, G. A., Hillmann, B. M., Ward, T. L., Shields-Cutler, R. R., Kim, A. D., Shmagel, A. K., Syed, A. N., Walter, J., et al. (2019) · Cell Host & Microbe · doi:10.1016/j.chom.2019.05.005 · Cited by 742
Systematic Review of Gut Microbiota and Major Depression
Cheung, S. G., Goldenthal, A. R., Uhlemann, A.-C., Mann, J. J., Miller, J. M., & Sublette, M. E. (2019) · Frontiers in Psychiatry · doi:10.3389/fpsyt.2019.00034 · Cited by 597
Rethinking healthy eating in light of the gut microbiome
Armet, A. M., Deehan, E. C., O’Sullivan, A. F., Mota, J. F., Field, C. J., Prado, C. M., Lucey, A. J., & Walter, J. (2022) · Cell Host & Microbe · doi:10.1016/j.chom.2022.04.016 · Cited by 252
Metadata
- Authors
- Bowyer, R. C. E., Jackson, M. A., Pallister, T., Skinner, J., Spector, T. D., Welch, A. A., & Steves, C. J.
- Affiliations
- St Thomas' Hospital (GB)
- University of East Anglia (GB)
- Corresponding author
- Steves, Claire J.
- ORCID
- Venue
- Microbiome
- Published
- 2018-04-25
- Volume
- 6
- Issue
- 1
- Pages
- 77-77
- ISSN
- 2049-2618 (ISSN-L)
- PMC
- PMC5918560
- OpenAlex
- W2802332168
- Cited by
- 140
- References
- 57
- Citations by year
- 2026: 19 · 2025: 17 · 2024: 11 · 2023: 4 · 2022: 23 · 2021: 26 · 2020: 22 · 2019: 15 · 2018: 3
- FWCI
- 5.84
- Type
- journal article
- Language
- en
- Open access
- gold
- doi.org
- Licence
- Locations
- Microbiome (publishedVersion, cc-by)
- Europe PMC (PubMed Central) (publishedVersion, other-oa)
- PubMed Central (publishedVersion, cc-by)
- PubMed (publishedVersion)
- UEA Digital Repository (University of East Anglia) (acceptedVersion)
- DOAJ (DOAJ: Directory of Open Access Journals) (submittedVersion, cc-by-sa)
- Research Portal (King's College London) (submittedVersion, cc-by)
- Funders
- Wellcome Trust (WT081878MA)
- Kings College London
- Guy's and St Thomas' NHS Foundation Trust
- University of East Anglia
- Chronic Disease Research Foundation (CDRF/10/06/2014)
- Topics
- Life Sciences › Biochemistry, Genetics and Molecular Biology › Molecular Biology › Gut microbiota and health
- Health Sciences › Medicine › Public Health, Environmental and Occupational Health › Nutritional Studies and Diet
- Life Sciences › Biochemistry, Genetics and Molecular Biology › Genetics › Nutrition, Genetics, and Disease
- Keywords
- dietary indices, gut microbiota, Healthy Eating Index, Mediterranean diet score, food frequency questionnaire, alpha diversity, beta diversity, twin discordance, Western diet, microbiota composition
- MeSH terms
- Gastrointestinal Microbiome, Diet, Healthy, Diet, Feeding Behavior, Humans, Reproducibility of Results, Biodiversity
About these checks
Registry, retraction, Cites and statistics results are computed, not judged, with one exception: a printed reference that no index lists is read once by a model before it counts as a citation error. Claims are extracted by a model and kept only when their quote appears verbatim in the text; each cited source is then checked, with a model’s help, for whether it says what the claim relies on. Those verdicts can be wrong — read the claim’s quote and the cited source before relying on one.
Statistics and arithmetic are recomputed, not judged.
Confidence bands are shown only for fields calibrated on our annotated test set. None is calibrated yet, so no band is shown.
What counts as a claim ›How we measure confidence ›How we check this ›
Are you an author, or do you see a problem with this page? Request a review
