

The DOI matches its Crossref record; 48 of the 48 references it cites were found in a registry or an index.
Gut microbiota from NLRP3-deficient mice ameliorates depressive-like behaviors by regulating astrocyte dysfunction via circHIPK2
Open accessAbstract
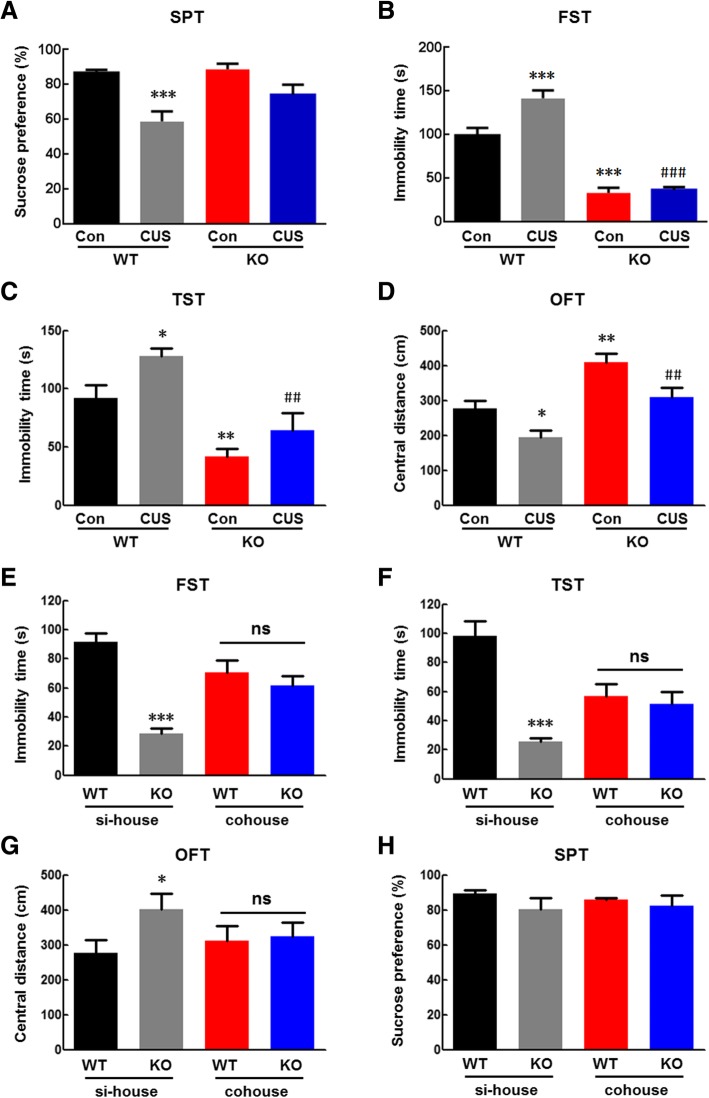
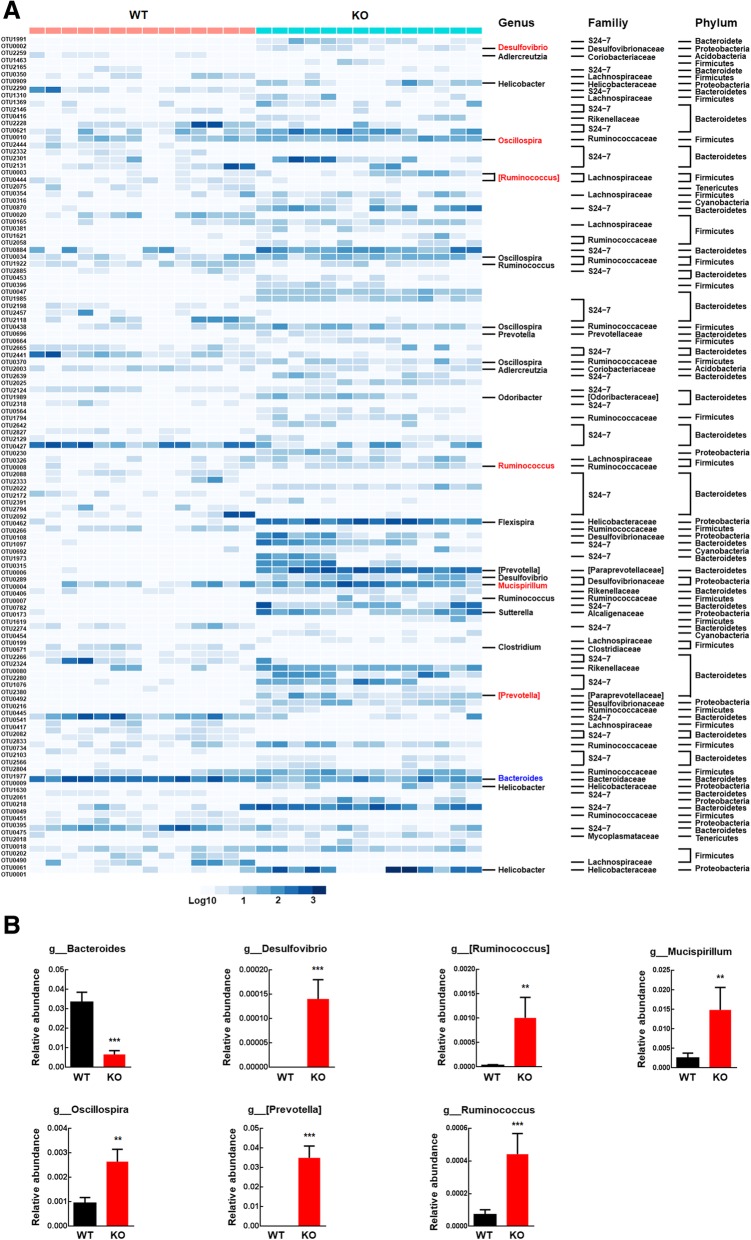
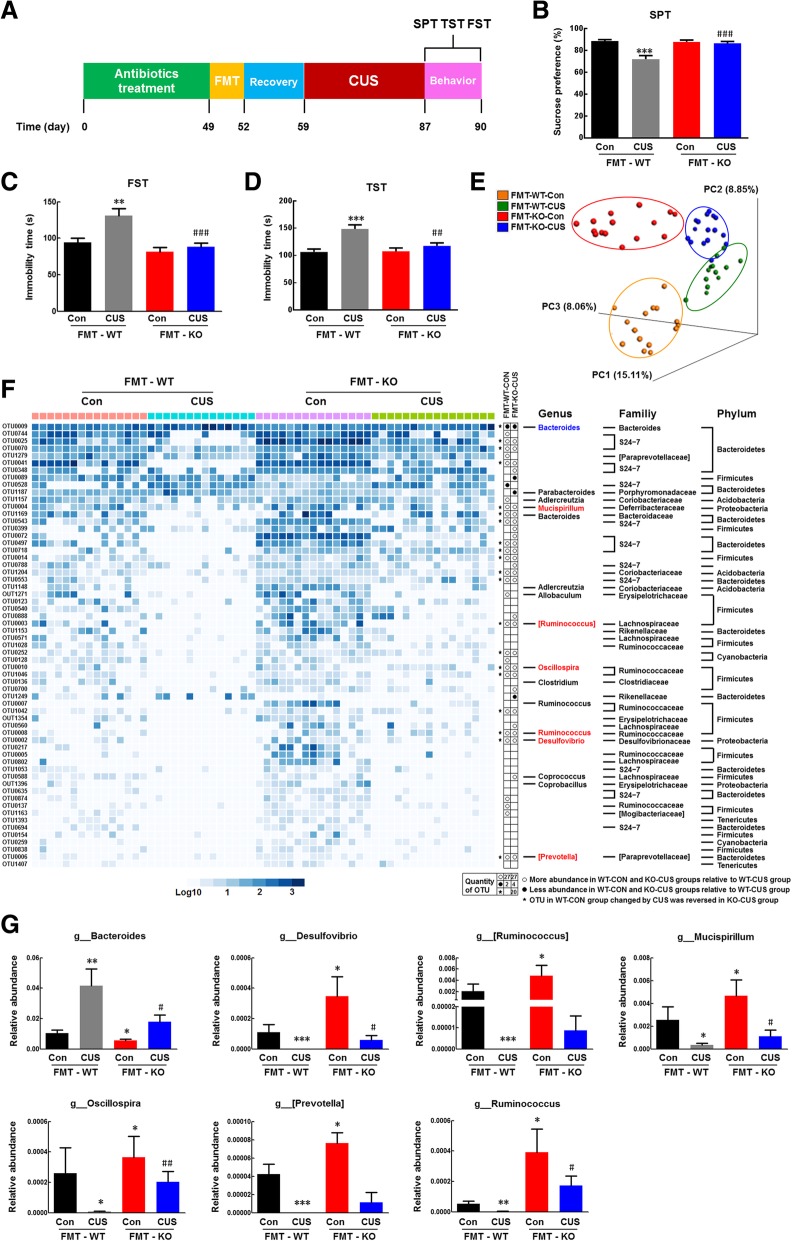
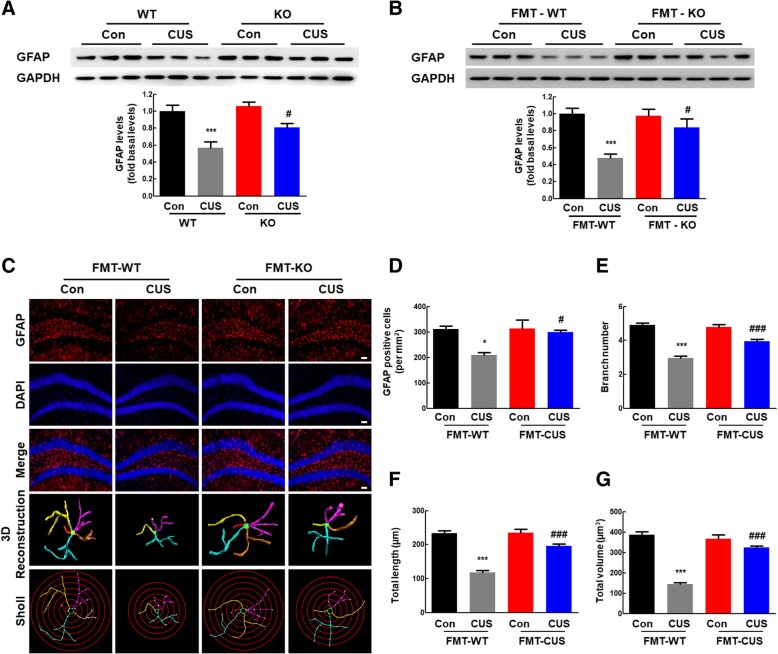
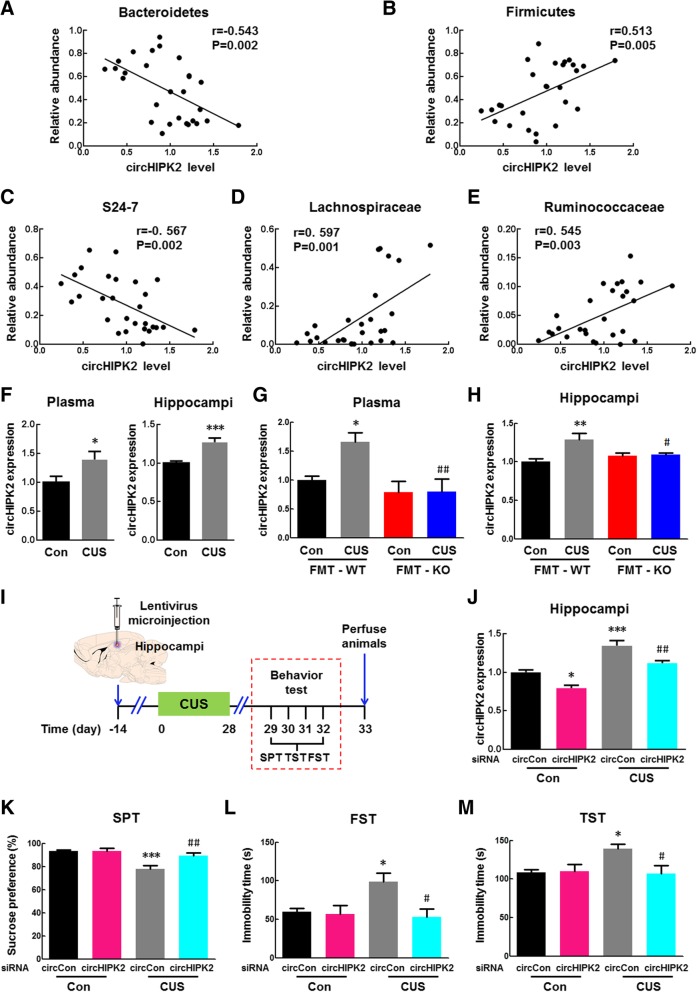
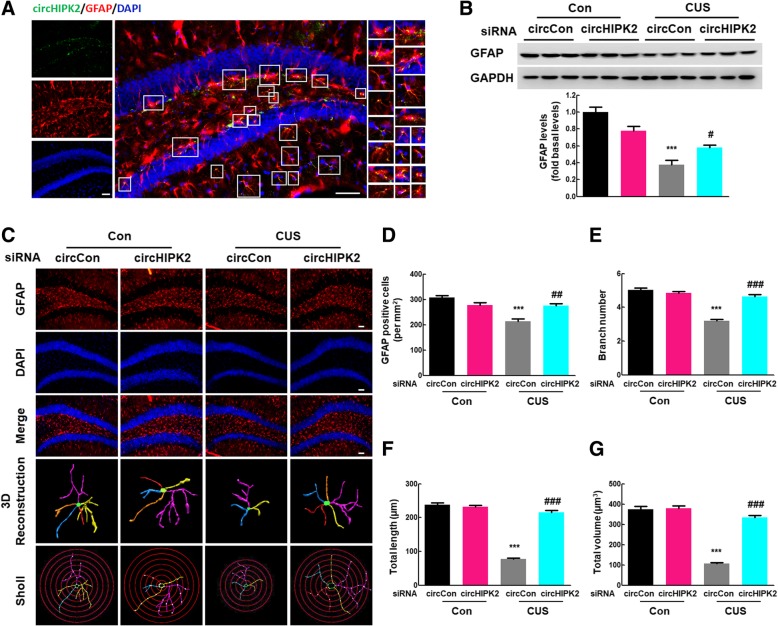
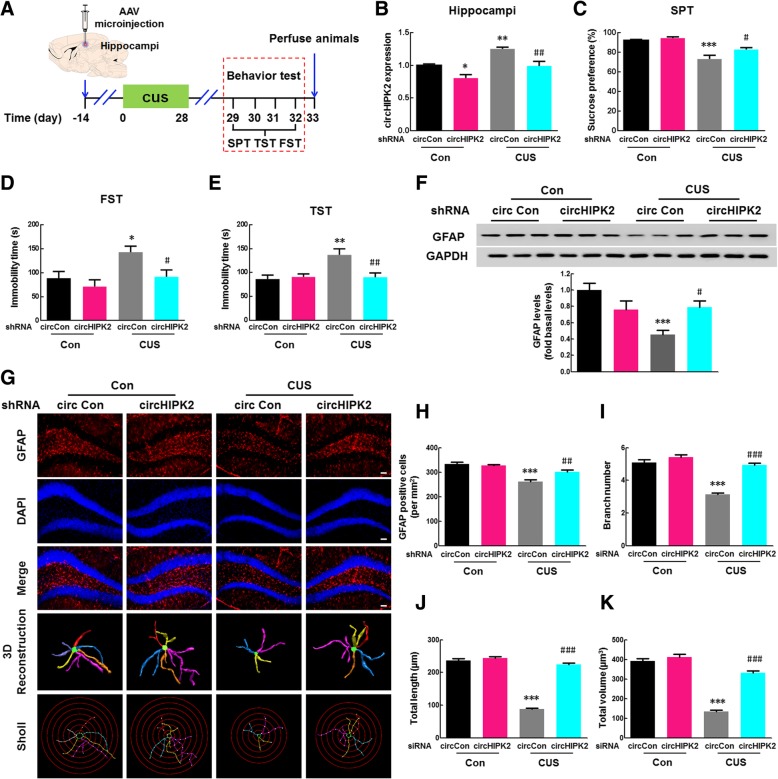
BACKGROUND: Inflammasomes have been found to interact with the gut microbiota, and this effect is associated with depression, but the mechanisms underlying this interaction have not been elucidated in detail. RESULTS: The locomotor activity of NLRP3 KO mice was significantly greater than that of their WT littermates, while cohousing and transplantation of the NLRP3 KO gut microbiota avoid the effects of NLRP3 KO on the general locomotor activity at baseline. Meanwhile, transplantation of the NLRP3 KO microbiota alleviated the CUS-induced depressive-like behaviors. The compositions of the gut microbiota in NLRP3 KO mice and WT mice were significantly different in terms of the relative abundance of Firmicutes, Proteobacteria, and Bacteroidetes. Fecal microbiota transplantation (FMT) from NLRP3 KO mice significantly ameliorated the depressive-like behavior induced by chronic unpredictable stress (CUS) in recipient mice. Given the correlation between circular RNA HIPK2 (circHIPK2) and depression and the observation that the level of circHIPK2 expression was significantly increased in CUS-treated mice compared with that in the control group, further experiments were performed. FMT significantly ameliorated astrocyte dysfunction in recipient mice treated with CUS via inhibition of circHIPK2 expression. CONCLUSIONS: Our study illustrates the involvement of the gut microbiota-circHIPK2-astrocyte axis in depression, providing translational evidence that transplantation of the gut microbiota from NLRP3 KO mice may serve as a novel therapeutic strategy for depression.
Overview
The claims and statistics of this paper haven’t been checked yet.
Run the check — free, no account needed. It reads the open-access text and checks the sources it cites.
Integrity signals
Registry
Cites
Statistics
Figures
Verification
Claims the paper makes
The claims and statistics of this paper haven’t been checked yet.
Run the check — free, no account needed. It reads the open-access text and checks the sources it cites.
Claims other papers make about this one
Each is checked against this paper’s own text: does it say what the citing paper says it does?
The source backs part of the claim, not all of it — or backs it for a different population, condition or comparison.
In the citing paper
“Knockdown of circHIPK2 and overexpression of circSTAG1 have been shown to induce an inhibitory effect on the progression of depression, due to the binding mechanism between circSTAG1 and human AlkB homolog 5 (ALKBH5) and the miR-9 sponge function of circHIPK2.”
From Circular RNAs in depression: Biogenesis, function, expression, and therapeutic potential (2021) · cites this paper as [22]
Experimental — accuracy not yet measuredThe cited source says what the claim attributes to it.
In the citing paper
“This study found that the expression level of circHIPK2 increased significantly in a CUS mouse model with depression compared with a control group.”
From Circular RNAs in depression: Biogenesis, function, expression, and therapeutic potential (2021) · cites this paper as [22]
The cited source says what the claim attributes to it.
In the citing paper
“Fecal microbiota transplantation significantly alleviated astrocyte dysfunction and depression-like behaviors in recipient depressive mice via inhibition of circHIPK2 expression.295”
From Epigenetic regulation in major depression and other stress-related disorders: molecular mechanisms, clinical relevance and therapeutic potential (2023) · cites this paper as [295]
The cited source says what the claim attributes to it.
In the citing paper
“the gut microbiota-circHIPK2-astrocyte axis was involved in the development of depression in a stress mouse model.295”
From Epigenetic regulation in major depression and other stress-related disorders: molecular mechanisms, clinical relevance and therapeutic potential (2023) · cites this paper as [295]
In the citing paper
“Likewise, the role of circRNAs as novel therapeutic targets to ameliorate depression-like symptoms has been demonstrated in various animal models [21][22][23][24].”
From Circular RNAs in depression: Biogenesis, function, expression, and therapeutic potential (2021) · cites this paper as [22]
In the citing paper
“Furthermore, circular STAG1 (circSTAG1) and circular HIPK2 (circHIPK2) were reported to function in astrocyte activation.”
From Circular RNAs in depression: Biogenesis, function, expression, and therapeutic potential (2021) · cites this paper as [22]
In the citing paper
“These results suggest that these two circRNAs may be novel therapeutic targets for depression [16,22] (Fig. 3C & D).”
From Circular RNAs in depression: Biogenesis, function, expression, and therapeutic potential (2021) · cites this paper as [22]
In the citing paper
“Transplantation of the gut microbiota from pyrin domain containing protein 3 knock out (NLRP3 KO) mice alleviated astrocyte dysfunction in CUS mice.”
From Circular RNAs in depression: Biogenesis, function, expression, and therapeutic potential (2021) · cites this paper as [22]
In the citing paper
“This study revealed a regulatory effect of the gut microbiota-circHIPK2-astrocyte axis in depression, and suggested that transplantation of the gut microbiota may constitute a novel therapeutic strategy for depression [22].”
From Circular RNAs in depression: Biogenesis, function, expression, and therapeutic potential (2021) · cites this paper as [22]
In the citing paper
“This study revealed a regulatory effect of the gut microbiota-circHIPK2-astrocyte axis in depression, and suggested that transplantation of the gut microbiota may constitute a novel therapeutic strategy for depression [22].”
From Circular RNAs in depression: Biogenesis, function, expression, and therapeutic potential (2021) · cites this paper as [22]
In the citing paper
“Improved astrocyte function was attributed to the regulation of circHIPK2 expression.”
From Circular RNAs in depression: Biogenesis, function, expression, and therapeutic potential (2021) · cites this paper as [22]
In the citing paper
“(C) Transplantation of the NLRP3 KO gut microbiota decreases the expression of circHIPK2 and reverses astrocyte dysfunction in the CUS model mouse.”
From Circular RNAs in depression: Biogenesis, function, expression, and therapeutic potential (2021) · cites this paper as [22]
In the citing paper
“| 19 | CircHIPK2 | HIPK2 | Mouse | √ | | Plasma, Hippocampus | [22] |”
From Circular RNAs in depression: Biogenesis, function, expression, and therapeutic potential (2021) · cites this paper as [22]
In the citing paper
“It was found that FMT from NLPR3 knockout mice resulted in a decrease in anxiety and depressive-like behaviours in the recipient mice [28].”
From Effect of fecal microbiota transplant on symptoms of psychiatric disorders: a systematic review (2020) · cites this paper as [28]
Self-check
Percentages, sums and reported differences re-computed from the paper’s own numbers.
The self-check needs the paper’s full text.
Citations
Cites
Vos, T., Abajobir, A. A., Abate, K. H., Abbafati, C., Abbas, K. M., Abd-Allah, F., Abdulkader, R. S., Abdulle, A. M., Abebo, T. A., Abera, S. F., et al. (2017) · The Lancet · doi:10.1016/s0140-6736(17)32154-2 · Cited by 13,220
Vos, T., Barber, R. M., Bell, B., Bertozzi-Villa, A., Biryukov, S., Bolliger, I., Charlson, F., Davis, A., Degenhardt, L., Dicker, D., et al. (2015) · The Lancet · doi:10.1016/s0140-6736(15)60692-4 · Cited by 6,414
Whiteford, H. A., Degenhardt, L., Rehm, J., Baxter, A. J., Ferrari, A. J., Erskine, H. E., Charlson, F. J., Norman, R. E., Flaxman, A. D., Johns, N., et al. (2013) · The Lancet · doi:10.1016/s0140-6736(13)61611-6 · Cited by 6,006
Gout-associated uric acid crystals activate the NALP3 inflammasome
Martinon, F., Pétrilli, V., Mayor, A., Tardivel, A., & Tschopp, J. (2006) · Nature · doi:10.1038/nature04516 · Cited by 5,326
Mind-altering microorganisms: the impact of the gut microbiota on brain and behaviour
Cryan, J. F., & Dinan, T. G. (2012) · Nature Reviews Neuroscience · doi:10.1038/nrn3346 · Cited by 4,572
The gut microbiota--masters of host development and physiology
Sommer, F., & Bäckhed, F. (2013) · Nature Reviews Microbiology · doi:10.1038/nrmicro2974 · Cited by 3,681
Host microbiota constantly control maturation and function of microglia in the CNS
Erny, D., Hrabě de Angelis, A. L., Jaitin, D., Wieghofer, P., Staszewski, O., David, E., Keren-Shaul, H., Mahlakoiv, T., Jakobshagen, K., Buch, T., et al. (2015) · Nature Neuroscience · doi:10.1038/nn.4030 · Cited by 3,569
Altered fecal microbiota composition in patients with major depressive disorder
Jiang, H., Ling, Z., Zhang, Y., Mao, H., Ma, Z., Yin, Y., Wang, W., Tang, W., Tan, Z., Shi, J., et al. (2015) · Brain, Behavior, and Immunity · doi:10.1016/j.bbi.2015.03.016 · Cited by 2,275
Cross-national epidemiology of DSM-IV major depressive episode
Bromet, E., Andrade, L. H., Hwang, I., Sampson, N. A., Alonso, J., de Girolamo, G., de Graaf, R., Demyttenaere, K., Hu, C., Iwata, N., et al. (2011) · BMC Medicine · doi:10.1186/1741-7015-9-90 · Cited by 2,221
Grand challenges in global mental health
Collins, P. Y., Patel, V., Joestl, S. S., March, D., Insel, T. R., Daar, A. S., Bordin, I. A., Costello, E. J., Durkin, M., Fairburn, C., et al. (2011) · Nature · doi:10.1038/475027a · Cited by 2,043
Cited by
Sorted by citations
The Role of Microbiota-Gut-Brain Axis in Neuropsychiatric and Neurological Disorders
Socała, K., Doboszewska, U., Szopa, A., Serefko, A., Włodarczyk, M., Zielińska, A., Poleszak, E., Fichna, J., & Wlaź, P. (2021) · Pharmacological Research · doi:10.1016/j.phrs.2021.105840 · Cited by 857
Targeting circular RNAs as a therapeutic approach: current strategies and challenges
He, A. T., Liu, J., Li, F., & Yang, B. B. (2021) · Signal Transduction and Targeted Therapy · doi:10.1038/s41392-021-00569-5 · Cited by 567
Brain–gut–microbiota axis in depression: A historical overview and future directions
Chang, L., Wei, Y., & Hashimoto, K. (2022) · Brain Research Bulletin · doi:10.1016/j.brainresbull.2022.02.004 · Cited by 407
Kanmani, S., & Koo, B. (2020) · International Journal of Molecular Sciences · doi:10.3390/ijms21207551 · Cited by 392
Microbiota in neuroinflammation and synaptic dysfunction: a focus on Alzheimer’s disease
Bairamian, D., Sha, S., Rolhion, N., Sokol, H., Dorothée, G., Lemere, C. A., & Krantic, S. M. (2022) · Molecular Neurodegeneration · doi:10.1186/s13024-022-00522-2 · Cited by 326
From gut microbiota to host appetite: gut microbiota-derived metabolites as key regulators
Han, H., Yi, B., Zhong, R., Wang, M., Zhang, S., Ma, J., Yin, Y., Yin, J., Chen, L., & Zhang, H. (2021) · Microbiome · doi:10.1186/s40168-021-01093-y · Cited by 292
Effect of fecal microbiota transplant on symptoms of psychiatric disorders: a systematic review
Chinna Meyyappan, A., Forth, E., Wallace, C. J. K., & Milev, R. (2020) · BMC Psychiatry · doi:10.1186/s12888-020-02654-5 · Cited by 254
Yuan, M., Yang, B., Rothschild, G., Mann, J. J., Sanford, L. D., Tang, X., Huang, C., Wang, C., & Zhang, W. (2023) · Signal Transduction and Targeted Therapy · doi:10.1038/s41392-023-01519-z · Cited by 246
“295 Fecal microbiota transplantation signi fi cantly alleviated astrocyte dysfunction and depression-like behaviors in recipient depressive mice via inhibition of circHIPK2 expression.”
BackgroundResultThe NLRP3 inflammasome in depression: Potential mechanisms and therapies
Xia, C., Guo, Y., Lian, W., Yan, Y., Ma, B.-Z., Cheng, Y., Xu, J., He, J., & Zhang, W. (2022) · Pharmacological Research · doi:10.1016/j.phrs.2022.106625 · Cited by 188
Gut Microbial Signatures Can Discriminate Unipolar from Bipolar Depression
Zheng, P., Yang, J., Li, Y., Wu, J., Liang, W., Yin, B., Tan, X., Huang, Y., Chai, T., Zhang, H., et al. (2020) · Advanced Science · doi:10.1002/advs.201902862 · Cited by 177
Pellegrini, C., Antonioli, L., Calderone, V., Colucci, R., Fornai, M., & Blandizzi, C. (2020) · Progress in Neurobiology · doi:10.1016/j.pneurobio.2020.101806 · Cited by 174
Li, X., He, C., Li, N., Ding, L., Chen, H., Wan, J., Yang, X., Xia, L., He, W., Xiong, H., et al. (2020) · Gut Microbes · doi:10.1080/19490976.2020.1770042 · Cited by 174
Extracellular vesicle‐mediated delivery of circDYM alleviates CUS‐induced depressive‐like behaviours
Yu, X., Bai, Y., Han, B., Ju, M., Tang, T., Shen, L., Li, M., Yang, L., Zhang, Z., Hu, G., et al. (2022) · Journal of Extracellular Vesicles · doi:10.1002/jev2.12185 · Cited by 167
Lu, S., Zhao, Q., Yu, G., Sun, Z., Li, W., Guo, S., & Zhang, A. (2024) · Biomedicine & Pharmacotherapy · doi:10.1016/j.biopha.2024.117207 · Cited by 191
Gheorghe, C. E., Ritz, N. L., Martin, J. A., Wardill, H. R., Cryan, J. F., & Clarke, G. A. (2021) · Gut Microbes · doi:10.1080/19490976.2021.1941711 · Cited by 156
Roles and Mechanisms of Gut Microbiota in Patients With Alzheimer’s Disease
Wu, S., Liu, X., Jiang, R., Yan, X., & Ling, Z. (2021) · Frontiers in Aging Neuroscience · doi:10.3389/fnagi.2021.650047 · Cited by 150
P2X7 receptor mediates NLRP3 inflammasome activation in depression and diabetes
Wang, D., Wang, H., Gao, H., Zhang, H., Zhang, H., Wang, Q., & Sun, Z. (2020) · Cell & Bioscience · doi:10.1186/s13578-020-00388-1 · Cited by 151
Stress-induced blood brain barrier disruption: Molecular mechanisms and signaling pathways
Welcome, M. O., & Mastorakis, N. E. (2020) · Pharmacological Research · doi:10.1016/j.phrs.2020.104769 · Cited by 139
Yang, Z., Li, J., Gui, X., Shi, X., Bao, Z., Han, H., & Li, M. D. (2020) · Molecular Psychiatry · doi:10.1038/s41380-020-0729-1 · Cited by 139
Gut microbiota regulates neuropathic pain: potential mechanisms and therapeutic strategy
Lin, B., Wang, Y., Zhang, P., Yuan, Y., Zhang, Y., & Chen, G. (2020) · The Journal of Headache and Pain · doi:10.1186/s10194-020-01170-x · Cited by 137
The gut microbiome and mental health: advances in research and emerging priorities
Shoubridge, A. P., Choo, J. M., Martin, A. M., Keating, D. J., Wong, M., Licinio, J., & Rogers, G. B. (2022) · Molecular Psychiatry · doi:10.1038/s41380-022-01479-w · Cited by 133
Wu, S., Bekhit, A. E. A., Wu, Q., Chen, M., Liao, X., Wang, J., & Ding, Y. (2020) · Trends in Food Science & Technology · doi:10.1016/j.tifs.2020.12.019 · Cited by 129
Yao, H., Zhang, D., Yu, H., Yuan, H., Shen, H., Lan, X., Liu, H., Chen, X., Meng, F., Wu, X., et al. (2022) · Molecular Psychiatry · doi:10.1038/s41380-022-01841-y · Cited by 125
He, X., Li, L., Xian, W., Li, M., Zhang, L., Xu, J., Pei, Z., Zheng, H., & Hu, X. (2021) · Journal of Neuroinflammation · doi:10.1186/s12974-021-02199-8 · Cited by 116
Zhu, F., Tu, H., & Chen, T. (2022) · Nutrients · doi:10.3390/nu14102081 · Cited by 123
Hu, B., Das, P., Lv, X., Shi, M., Aa, J., Wang, K., Duan, L., Gilbert, J. A., Nie, Y., & Wu, X. (2022) · mSystems · doi:10.1128/msystems.00218-22 · Cited by 116
Zhao, N., Chen, Q.-G., Chen, X., Liu, X.-T., Geng, F., Zhu, M.-M., Yan, F.-L., Zhang, Z.-J., & Ren, Q.-G. (2023) · Brain, Behavior, and Immunity · doi:10.1016/j.bbi.2022.11.013 · Cited by 105
Alterations in the Gut-Microbial-Inflammasome-Brain Axis in a Mouse Model of Alzheimer’s Disease
Shukla, P. K., Delotterie, D. F., Xiao, J., Pierre, J. F., Rao, R., McDonald, M. P., & Khan, M. M. (2021) · Cells · doi:10.3390/cells10040779 · Cited by 105
Settanni, C. R., Ianiro, G., Bibbò, S., Cammarota, G., & Gasbarrini, A. (2021) · Progress in Neuro-Psychopharmacology and Biological Psychiatry · doi:10.1016/j.pnpbp.2021.110258 · Cited by 106
The gut microbiota–brain axis in neurological disorders
You, M., Chen, N., Yang, Y., Cheng, L., He, H., Cai, Y., Liu, Y., Liu, H., & Hong, G. (2024) · MedComm · doi:10.1002/mco2.656 · Cited by 113
Fecal Microbiota Transplantation: A New Therapeutic Attempt from the Gut to the Brain
Xu, H., Huang, H., Zhou, Y., Zhao, H., Xu, J., Shou, D., Liu, Y., Zhou, Y., & Nie, Y. (2021) · Gastroenterology Research and Practice · doi:10.1155/2021/6699268 · Cited by 100
Chen, M., Lai, X., Wang, X., Ying, J., Zhang, L., Zhou, B., Liu, X., Zhang, J., Wei, G., & Hua, F. (2021) · Frontiers in Molecular Neuroscience · doi:10.3389/fnmol.2021.745066 · Cited by 97
Zeng, B., Huang, Y., Chen, S., Xu, R., Xu, L., Qiu, J.-H., Shi, F., Liu, S., Zha, Q., Ouyang, D., et al. (2022) · Cellular and Molecular Immunology · doi:10.1038/s41423-022-00891-0 · Cited by 89
Du, M., Wu, C., Yu, R., Cheng, Y., Tang, Z., Wu, B., Fu, J., Tan, W., Zhou, Q., Zhu, Z., et al. (2022) · Molecular Psychiatry · doi:10.1038/s41380-022-01711-7 · Cited by 86
Xu, Q., Sun, L., Chen, Q., Jiao, C., Wang, Y., Li, H., Xie, J., Zhu, F., Wang, J., Zhang, W., et al. (2024) · Brain Behavior and Immunity · doi:10.1016/j.bbi.2024.04.002 · Cited by 87
Tao, W., Ruan, J., Wu, R., Zhao, M., Zhao, T. T., Qi, M., Yau, S., Yao, G., Zhang, H., Hu, Y., et al. (2022) · Journal of Advanced Research · doi:10.1016/j.jare.2022.02.015 · Cited by 85
Alteration of Gut Microbiome and Correlated Lipid Metabolism in Post-Stroke Depression
Jiang, W., Gong, L., Liu, F., Ren, Y., & Mu, J. (2021) · Frontiers in Cellular and Infection Microbiology · doi:10.3389/fcimb.2021.663967 · Cited by 83
The brain-gut-microbiota interplay in depression: A key to design innovative therapeutic approaches
Varesi, A., Campagnoli, L. I. M., Chirumbolo, S., Candiano, B., Carrara, A., Ricevuti, G., Esposito, C., & Pascale, A. (2023) · Pharmacological Research · doi:10.1016/j.phrs.2023.106799 · Cited by 88
Cui, Y., Yu, H., Bu, Z., Wen, L., Yan, L.-L., & Feng, J. (2022) · Frontiers in Molecular Neuroscience · doi:10.3389/fnmol.2022.894298 · Cited by 80
How Oxidative Stress Induces Depression?
Ji, N., Lei, M., Chen, Y., Tian, S., Li, C., & Zhang, B. (2023) · ASN NEURO · doi:10.1177/17590914231181037 · Cited by 84
Agranyoni, O., Meninger-Mordechay, S., Uzan-Yulzari, A., Oren, Z., Salmon‐Divon, M., Rodin, D., Raz, O., Koman, I. E., Koren, O., Pinhasov, A., et al. (2021) · npj Biofilms and Microbiomes · doi:10.1038/s41522-021-00193-9 · Cited by 78
Jang, H., Kim, J.-K., Joo, M.-K., Shin, Y.-J., Lee, C. K., Kim, H. J., & Kim, D. (2021) · Scientific Reports · doi:10.1038/s41598-021-00088-x · Cited by 71
Astaxanthin-Shifted Gut Microbiota Is Associated with Inflammation and Metabolic Homeostasis in Mice
Wu, L., Lyu, Y., Ramkumar, S., Wu, J., Ojo, B. A., Tang, M., El-Rassi, G. D., Metzinger, K., Smith, B. J., Lucas, E. A., et al. (2020) · Journal of Nutrition · doi:10.1093/jn/nxaa222 · Cited by 66
Xiao, L., Zheng, H., Li, J., Zeng, M., He, D., Liang, J., Sun, K., Luo, Y., Li, F., Ping, B., et al. (2022) · Biomedicine & Pharmacotherapy · doi:10.1016/j.biopha.2022.112797 · Cited by 65
Shi, Y., Song, R., Wang, Z., Zhang, H., Zhu, J., Yue, Y., Zhao, Y., & Zhang, Z. (2021) · eBioMedicine · doi:10.1016/j.ebiom.2021.103337 · Cited by 65
Self-citationInteractions between gut microbes and NLRP3 inflammasome in the gut-brain axis
Ding, Y., Wang, Z., Chen, Y., Guo, Q., & Dong, Y. (2023) · Computational and Structural Biotechnology Journal · doi:10.1016/j.csbj.2023.03.017 · Cited by 69
Zhou, Z., Wang, Y., Sun, S., Zhang, K., Wang, L., Zhao, H., & Zhang, Y. (2023) · Journal of Ethnopharmacology · doi:10.1016/j.jep.2023.116716 · Cited by 67
Subba, R., Sandhir, R., Singh, S. P., Mallick, B. N., & Mondal, A. C. (2021) · European Journal of Neuroscience · doi:10.1111/ejn.15136 · Cited by 69
Bi, C., Guo, S., Hu, S., Chen, J., Ye, M., & Liu, Z. (2022) · Pharmacological Research · doi:10.1016/j.phrs.2022.106372 · Cited by 69
Gut Microbiota Regulate Astrocytic Functions in the Brain: Possible Therapeutic Consequences
Zhao, Y.-F., Wei, D., & Tang, Y. (2021) · Current Neuropharmacology · doi:10.2174/1570159x19666210215123239 · Cited by 60
Remodeling of microbiota gut-brain axis using psychobiotics in depression
Palepu, M. S. K., & Dandekar, M. P. (2022) · European Journal of Pharmacology · doi:10.1016/j.ejphar.2022.175171 · Cited by 62
Honda, T. S. B., Ku, J., & Anders, H. (2023) · Frontiers in Immunology · doi:10.3389/fimmu.2023.1214289 · Cited by 63
Noncoding RNAs: Regulatory Molecules of Host–Microbiome Crosstalk
Malmuthuge, N., & Guan, L. L. (2021) · Trends in Microbiology · doi:10.1016/j.tim.2020.12.003 · Cited by 62
Target Dysbiosis of Gut Microbes as a Future Therapeutic Manipulation in Alzheimer’s Disease
Zhu, F., Li, C., Chu, F., Tian, X., & Zhu, J. (2020) · Frontiers in Aging Neuroscience · doi:10.3389/fnagi.2020.544235 · Cited by 59
An interplay between non-coding RNAs and gut microbiota in human health
Fardi, F., Khasraghi, L. B., Shahbakhti, N., Naseriyan, A. S., Najafi, S., Sanaaee, S., Alipourfard, I., Zamany, M., Karamipour, S., Jahani, M., et al. (2023) · Diabetes Research and Clinical Practice · doi:10.1016/j.diabres.2023.110739 · Cited by 60
Yan, T., Wang, N., Liu, B., Wu, B., Xiao, F., He, B., & Jia, Y. (2020) · Phytotherapy Research · doi:10.1002/ptr.6799 · Cited by 58
Luo, T., Guo, Z., Liu, D., Guo, Z., Wu, Q., Li, Q., Lin, R., Chen, P., Ou, C., & Chen, M. (2022) · Gut Microbes · doi:10.1080/19490976.2022.2077602 · Cited by 56
Immunotherapy for depression: Recent insights and future targets
Bai, Y., Cai, Y., Chang, D., Li, D., Huo, X., & Zhu, T. (2024) · Pharmacology & Therapeutics · doi:10.1016/j.pharmthera.2024.108624 · Cited by 56
Borsom, E. M., Lee, K., & Cope, E. K. (2020) · Brain Sciences · doi:10.3390/brainsci10110814 · Cited by 56
The microbiota restrains neurodegenerative microglia in a model of amyotrophic lateral sclerosis
Cox, L. M., Calcagno, N., Gauthier, C., Madore, C., Butovsky, O., & Weiner, H. L. (2022) · Microbiome · doi:10.1186/s40168-022-01232-z · Cited by 53
NLRP3 Inflammasome: From Pathophysiology to Therapeutic Target in Major Depressive Disorder
Kouba, B. R., Gil‐Mohapel, J., & Rodrigues, A. L. S. (2022) · International Journal of Molecular Sciences · doi:10.3390/ijms24010133 · Cited by 57
Lentinan improves intestinal inflammation and gut dysbiosis in antibiotics-induced mice
Ji, X., Su, L., Zhang, P., Yue, Q., Zhao, C., Sun, X., Li, K., Liu, X., Zhang, S., & Zhao, L. (2022) · Scientific Reports · doi:10.1038/s41598-022-23469-2 · Cited by 48
Liu, P., Chen, J., Ma, S., Zhang, J., & Zhou, J. (2020) · The International Journal of Neuropsychopharmacology · doi:10.1093/ijnp/pyaa076 · Cited by 46
Huang, L., Ma, Z., Ze, X., Zhao, X., Zhang, M., Lv, X., Zheng, Y., & Liu, H. (2023) · Frontiers in Cellular and Infection Microbiology · doi:10.3389/fcimb.2023.1189008 · Cited by 46
Zhang, Y., Sun, Y., Liu, Y., Liu, J., Sun, J., Liu, X., Fan, B., Lü, C., & Wang, F. (2023) · Phytotherapy Research · doi:10.1002/ptr.7813 · Cited by 45
A new perspective on depression and neuroinflammation: Non-coding RNA
Zhou, S., Chen, R., She, Y., Liu, X., Zhao, H., Li, C., & Jia, Y. (2022) · Journal of Psychiatric Research · doi:10.1016/j.jpsychires.2022.02.007 · Cited by 42
The gut microbiota‐astrocyte axis: Implications for type 2 diabetic cognitive dysfunction
Li, Z.-H., Jiang, Y., Long, C., Peng, Q., & Yue, R. (2023) · CNS Neuroscience & Therapeutics · doi:10.1111/cns.14077 · Cited by 41
Yi, W., Cheng, J., Wei, Q., Pan, R., Song, S., He, Y., Tang, C. K., Liu, X., Zhou, Y., & Su, H. (2021) · The Science of The Total Environment · doi:10.1016/j.scitotenv.2020.144568 · Cited by 43
Circular RNAs in depression: Biogenesis, function, expression, and therapeutic potential
Gan, H., Lei, Y., Yuan, N., Tang, K., Hao, W., Ma, Q., Wu, M., Zhou, X., Li, X., Huang, J., et al. (2021) · Biomedicine & Pharmacotherapy · doi:10.1016/j.biopha.2021.111244 · Cited by 41
NLRP3 Inflammasome From Bench to Bedside: New Perspectives for Triple Negative Breast Cancer
Sonnessa, M., Cioffi, A., Brunetti, O., Silvestris, N., Zito, F. A., Saponaro, C., & Mangia, A. (2020) · Frontiers in Oncology · doi:10.3389/fonc.2020.01587 · Cited by 39
Liu, D.-C., Tian, Q., Liu, K., Ren, F., Liu, G., Zhou, J., Yuan, L., Fang, Z., Zou, B., & Wang, S. (2023) · Journal of Agricultural and Food Chemistry · doi:10.1021/acs.jafc.2c07766 · Cited by 40
Current landscape of fecal microbiota transplantation in treating depression
Zhang, Q., Bi, Y., Zhang, B., Jiang, Q., Mou, C. K., Lei, L., Deng, Y., Li, Y., Yu, J., Liu, W., et al. (2024) · Frontiers in Immunology · doi:10.3389/fimmu.2024.1416961 · Cited by 38
Dual-directional regulation of spinal cord injury and the gut microbiota
Cui, Y., Liu, J., Xiao, L., Liu, S., Chen, H., Wei, Z., Li, H., Yang, Y., Zheng, C., & Li, Z. (2023) · Neural Regeneration Research · doi:10.4103/1673-5374.380881 · Cited by 38
León‐Rodríguez, A., Fernández‐Arjona, M. D. M., Grondona, J. M., Pedraza, C., & López-Ávalos, M. D. (2022) · Scientific Reports · doi:10.1038/s41598-022-15617-5 · Cited by 41
Exosome-sheathed ROS-responsive nanogel to improve targeted therapy in perimenopausal depression
Hu, Y., Zhao, M., Wang, H., Guo, Y., Cheng, X., Zhao, T. T., Wang, H., Zhang, Y., Ma, Y., & Tao, W. (2023) · Journal of Nanobiotechnology · doi:10.1186/s12951-023-02005-y · Cited by 40
Lin, X., Peng, Y., Guo, Z., He, W., Guo, W., Feng, J., Lin, L., Liu, Q., & Xu, P. (2024) · Cellular and Molecular Life Sciences · doi:10.1007/s00018-024-05332-x · Cited by 39
NLRP3 deficiency-induced hippocampal dysfunction and anxiety-like behavior in mice
Komleva, Y. K., Lopatina, O. L., Валерьевна, Г. Я., Shuvaev, А. N., Chernykh, A., Potapenko, I., & Salmina, A. B. (2020) · Brain Research · doi:10.1016/j.brainres.2020.147220 · Cited by 36
Sah, R. K., Nandan, A., Athira, K. V., Prashant, S. K., Sankaran, S., Jose, A., Venkidasamy, B., & Nile, S. H. (2023) · Asian Journal of Psychiatry · doi:10.1016/j.ajp.2023.103861 · Cited by 37
Yu, T., Luo, L., Xue, J., Tang, W., Wu, X., & Fan, Y. (2024) · Clinics and Research in Hepatology and Gastroenterology · doi:10.1016/j.clinre.2024.102458 · Cited by 41
Wang, H., Liu, L., Rao, X., Zeng, B., Yu, Y., Zhou, C., Zeng, L., Zheng, P., Pu, J., Xu, S., et al. (2020) · Translational Psychiatry · doi:10.1038/s41398-020-01024-9 · Cited by 34
Bai, S., Wang, W., Ting, W., Li, J., Zhang, S., Chen, Z., Qi, X., Chen, J., Cheng, K., & Xie, P. (2021) · Translational Psychiatry · doi:10.1038/s41398-020-01130-8 · Cited by 33
Sanchez‐Quintero, M. J., Delgado, J., Vera, D. M., Becerra‐Muñoz, V. M., Queipo‐Ortuño, M. I., Estévez, M., Plaza-Andrades, I. J., Rodríguez‐Capitán, J., Sanchez, P. L., Crespo-Leiro, M. G., et al. (2022) · Nutrients · doi:10.3390/nu14214650 · Cited by 38
Zhu, Z., Cheng, Y., Liu, X., Xu, X., Ding, W., Ling, Z., Liu, J., & Cai, G. (2025) · Frontiers in Immunology · doi:10.3389/fimmu.2025.1644160 · Cited by 40
Lataliza, A. A. B., de Assis, P. M., Laurindo, L. R., Gonçalves, E. C. D., Raposo, N. R. B., & Dutra, R. C. (2021) · Phytotherapy Research · doi:10.1002/ptr.7318 · Cited by 33
Interplay between Gut Microbiota and NLRP3 Inflammasome in Intracerebral Hemorrhage
Zhang, Y., Yu, W., Flynn, C., Chang, W., Zhang, L., Wang, M., Zheng, W., & Li, P. (2022) · Nutrients · doi:10.3390/nu14245251 · Cited by 34
Interaction mechanisms between major depressive disorder and non-alcoholic fatty liver disease
Shao, Q., Wu, Y., Ji, J., Xu, T., Yu, Q., Ma, C., Liao, X., Cheng, F., & Wang, X. (2021) · Frontiers in Psychiatry · doi:10.3389/fpsyt.2021.711835 · Cited by 32
Gut–Brain Axis: Focus on Neurodegeneration and Mast Cells
Conte, C., Sichetti, M., & Traina, G. (2020) · Applied Sciences · doi:10.3390/app10051828 · Cited by 33
The regulatory role of N6 ‐methyladenosine modification in the interaction between host and microbes
Zhuo, R., Xu, M., Wang, X., Zhou, B., Wu, X., Leone, V., Chang, E. B., & Zhong, X. (2022) · Wiley Interdisciplinary Reviews - RNA · doi:10.1002/wrna.1725 · Cited by 31
Chen, L., Qing, W., Yi, Z., Lin, G., Peng, Q., & Zhou, F. (2021) · Frontiers in Nutrition · doi:10.3389/fnut.2021.701760 · Cited by 31
Pick fecal microbiota transplantation to enhance therapy for major depressive disorder
Meng, Y., Sun, J., & Zhang, G. (2023) · Progress in Neuro-Psychopharmacology and Biological Psychiatry · doi:10.1016/j.pnpbp.2023.110860 · Cited by 32
Host Factors of Favorable Intestinal Microbial Colonization
Pirr, S. M., & Viemann, D. (2020) · Frontiers in Immunology · doi:10.3389/fimmu.2020.584288 · Cited by 30
Sp1-Mediated circRNA circHipk2 Regulates Myogenesis by Targeting Ribosomal Protein Rpl7
Yan, J., Yang, Y., Fan, X., Tang, Y., & Tang, Z. (2021) · Genes · doi:10.3390/genes12050696 · Cited by 31
Gut microbiome at the crossroad of genetic variants and behavior disorders
Cheng, L., Wu, H., Chen, Z., Hao, H., & Zheng, X. (2023) · Gut Microbes · doi:10.1080/19490976.2023.2201156 · Cited by 29
Microglial circ-UBE2K exacerbates depression by regulating parental gene UBE2K via targeting HNRNPU
Cai, Y., Ji, Y., Liu, Y., Zhang, D., Gong, Z., Li, L., Chen, X., Liang, C., Feng, S., Lu, J., et al. (2024) · Theranostics · doi:10.7150/thno.96890 · Cited by 32
Mechanism of Resveratrol on LPS/ATP-induced pyroptosis and inflammatory response in HT29 cells
Zhao, P., Ning, J., Huang, J., & Huang, X. (2024) · Autoimmunity · doi:10.1080/08916934.2024.2427094 · Cited by 29
Gu, J., Xu, Y.-W., Feng, L.-P., Dong, J., Zhao, L., Liu, C., Wang, H., Zhang, X., Song, C., & Wang, C. (2021) · Brain Research Bulletin · doi:10.1016/j.brainresbull.2021.10.005 · Cited by 30
Targeting the inflammasome in Parkinson’s disease
Su, Q., Ng, W. L., Goh, S. Y., Gulam, M. Y., Wang, L., Tan, E., Ahn, M., & Chao, Y. (2022) · Frontiers in Aging Neuroscience · doi:10.3389/fnagi.2022.957705 · Cited by 31
Song, Z., Bian, Z., Zhang, Z., Wang, X., Zhu, A., & Zhu, G. (2021) · Toxicology and Applied Pharmacology · doi:10.1016/j.taap.2021.115711 · Cited by 28
Microbial Therapeutics in Neurocognitive and Psychiatric Disorders
Alagiakrishnan, K., & Halverson, T. (2021) · Journal of Clinical Medicine Research · doi:10.14740/jocmr4575 · Cited by 29
Zhang, Y., Zhang, J., Wu, J., Zhu, Q., Chen, C., & Li, Y. (2023) · Frontiers in Microbiology · doi:10.3389/fmicb.2023.1124454 · Cited by 28
Metadata
- Authors
- Zhang, Y., Huang, R., Cheng, M., Wang, L., Chao, J., Li, J., Zheng, P., Xie, P., Zhang, Z., & Yao, H.
- Affiliations
- Southeast University (CN)
- China Pharmaceutical University (CN)
- The Affiliated Yongchuan Hospital of Chongqing Medical University (CN)
- Zhongda Hospital Southeast University (CN)
- Nantong University (CN)
- Corresponding author
- Yao, Honghong
- Venue
- Microbiome
- Published
- 2019-08-22
- Volume
- 7
- Issue
- 1
- Pages
- 116-116
- ISSN
- 2049-2618 (ISSN-L)
- PMC
- PMC6706943
- OpenAlex
- W2969822493
- Cited by
- 263
- References
- 48
- Citations by year
- 2026: 17 · 2025: 36 · 2024: 46 · 2023: 47 · 2022: 55 · 2021: 38 · 2020: 24
- FWCI
- 9.67
- Type
- journal article
- Language
- en
- Open access
- gold
- doi.org
- Locations
- Microbiome (publishedVersion, cc-by)
- PubMed Central (publishedVersion, cc-by)
- PubMed (publishedVersion)
- DOAJ (DOAJ: Directory of Open Access Journals) (submittedVersion, cc-by-sa)
- Funders
- National Natural Science Foundation of China (2017YFA0104303, 81603090, 81761138048, 81673410)
- Government of Jiangsu Province
- National Key Research and Development Program of China (2017YFA0104303)
- Fundamental Research Funds for the Central Universities (2242019, 2017YFA0104303)
- Topics
- Life Sciences › Biochemistry, Genetics and Molecular Biology › Molecular Biology › Gut microbiota and health
- Life Sciences › Neuroscience › Biological Psychiatry › Tryptophan and brain disorders
- Health Sciences › Medicine › Gastroenterology › Gastrointestinal motility and disorders
- Keywords
- gut microbiota, NLRP3 inflammasome, depression, depression-like behavior, astrocyte dysfunction, circular RNA, fecal microbiota transplantation, chronic unpredictable mild stress, locomotor activity, depression treatment
- MeSH terms
- Gastrointestinal Microbiome, Fecal Microbiota Transplantation, NLR Family, Pyrin Domain-Containing 3 Protein, Animals, Astrocytes, Behavior, Animal, Depression, Male, Mice, Inbred C57BL, Protein Serine-Threonine Kinases, Mice
About these checks
Registry, retraction, Cites and statistics results are computed, not judged, with one exception: a printed reference that no index lists is read once by a model before it counts as a citation error. Claims are extracted by a model and kept only when their quote appears verbatim in the text; each cited source is then checked, with a model’s help, for whether it says what the claim relies on. Those verdicts can be wrong — read the claim’s quote and the cited source before relying on one.
Statistics and arithmetic are recomputed, not judged.
Confidence bands are shown only for fields calibrated on our annotated test set. None is calibrated yet, so no band is shown.
What counts as a claim ›How we measure confidence ›How we check this ›
Are you an author, or do you see a problem with this page? Request a review
