

The DOI matches its Crossref record; 110 of the 117 references it cites were found in a registry or an index, and 1 are not checked yet.
Why does peer instruction benefit student learning?
Open accessAbstract
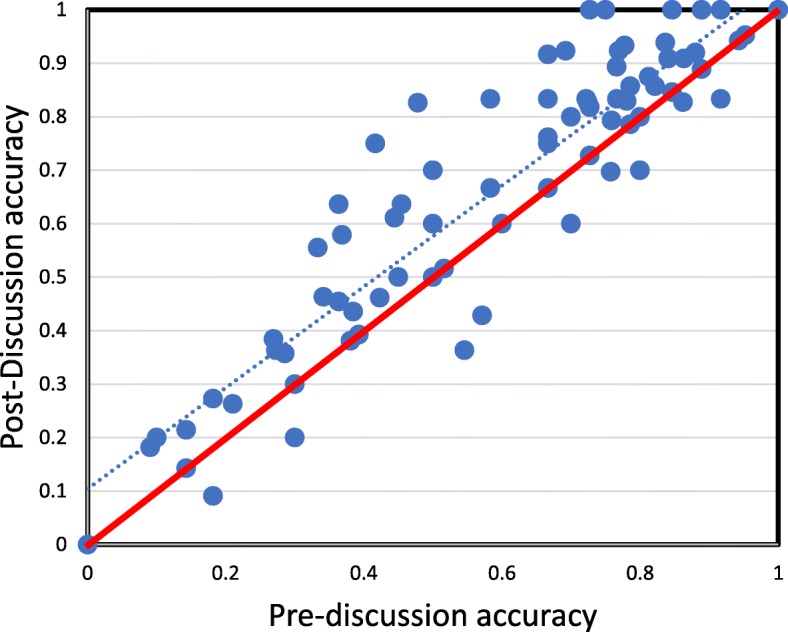
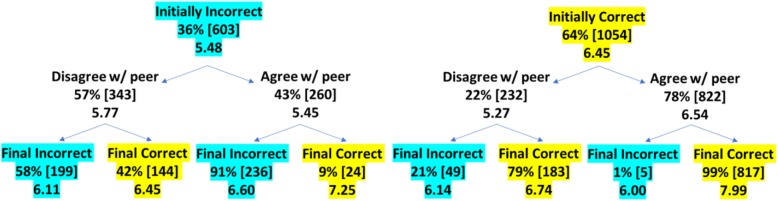
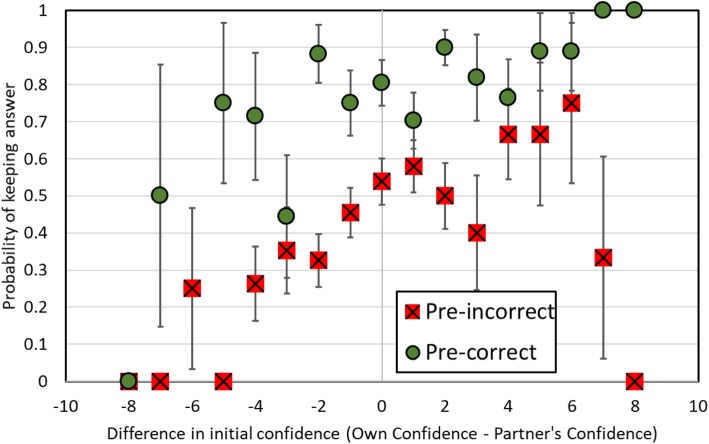
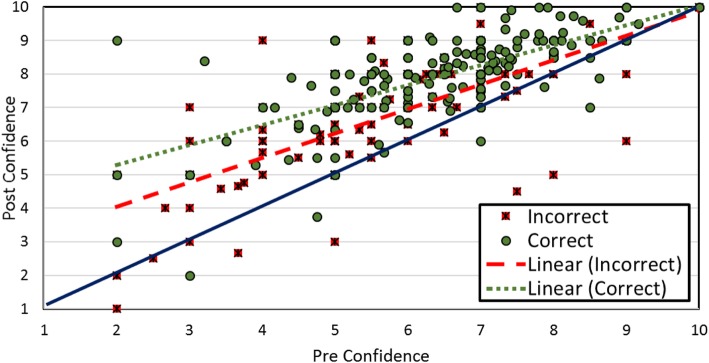
In peer instruction, instructors pose a challenging question to students, students answer the question individually, students work with a partner in the class to discuss their answers, and finally students answer the question again. A large body of evidence shows that peer instruction benefits student learning. To determine the mechanism for these benefits, we collected semester-long data from six classes, involving a total of 208 undergraduate students being asked a total of 86 different questions related to their course content. For each question, students chose their answer individually, reported their confidence, discussed their answers with their partner, and then indicated their possibly revised answer and confidence again. Overall, students were more accurate and confident after discussion than before. Initially correct students were more likely to keep their answers than initially incorrect students, and this tendency was partially but not completely attributable to differences in confidence. We discuss the benefits of peer instruction in terms of differences in the coherence of explanations, social learning, and the contextual factors that influence confidence and accuracy.
Overview
The claims and statistics of this paper haven’t been checked yet.
Run the check — free, no account needed. It reads the open-access text and checks the sources it cites.
Integrity signals
Registry
Cites
Statistics
Figures
Verification
Claims the paper makes
The claims and statistics of this paper haven’t been checked yet.
Run the check — free, no account needed. It reads the open-access text and checks the sources it cites.
Claims other papers make about this one
Each is checked against this paper’s own text: does it say what the citing paper says it does?
The cited source says what the claim attributes to it.
In the citing paper
“Prior research on peer instruction shows that when students can talk through their answers with a peer, they think more carefully about their reasoning, and this makes the assessment more collaborative and learning oriented (Tullis and Goldstone, 2020).”
From Generative AI-Enhanced Oral Exams in Economics Education (2026) · cites this paper as Tullis and Goldstone, 2020
Self-check
Percentages, sums and reported differences re-computed from the paper’s own numbers.
The self-check needs the paper’s full text.
Citations
Cites
Fitting Linear Mixed-Effects Models Using lme4
Bates, D., Mächler, M., Bolker, B., & Walker, S. (2015) · Journal of Statistical Software · doi:10.18637/jss.v067.i01 · Cited by 86,835
Mixed-effects modeling with crossed random effects for subjects and items
Baayen, R. H., Davidson, D. J., & Bates, D. M. (2008) · Journal of Memory and Language · doi:10.1016/j.jml.2007.12.005 · Cited by 8,540 · cited 1×
“In mixed-effect models with hundreds of observations, the t distribution effectively converges to the normal, so we compared the t statistic to the normal distribution for analyses involving continuous outcomes (i.e., confidence; Baayen, 2008).”
MethodReview of research in education
Shulman, L. S., Mowry, S., & Berliner, D. C. (1973) · F.E. Peacock eBooks · Cited by 7,754
Handbook of educational psychology
(1997) · Choice Reviews Online · doi:10.5860/choice.34-3084 · Cited by 4,850
Categorical data analysis: Away from ANOVAs (transformation or not) and towards logit mixed models
Jaeger, T. F. (2008) · Journal of Memory and Language · doi:10.1016/j.jml.2007.11.007 · Cited by 3,317 · cited 1×
“Finally, mixed effects models can predict the log odds (or logit) of a correct answer, which is needed when examining binary outcomes (i.e., correct or incorrect; Jaeger, 2008).”
BackgroundThe Journal of College Science Teaching
(1971) · Journal of Chemical Education · doi:10.1021/ed048p284 · Cited by 3,314
Analyzing Linguistic Data: A Practical Introduction to Statistics using R
Baayen, R. H. (2008) · doi:10.1017/cbo9780511801686 · Cited by 3,253
Test-Enhanced Learning: Taking Memory Tests Improves Long-Term Retention
Roediger, H. L., & Karpicke, J. D. (2006) · Psychological Science · doi:10.1111/j.1467-9280.2006.01693.x · Cited by 2,867
Peer Instruction: Ten years of experience and results
Crouch, C. H., & Mazur, E. (2001) · American Journal of Physics · doi:10.1119/1.1374249 · Cited by 2,682
Eliciting Self‐Explanations Improves Understanding
Michelene, T. H., Leeuw, N. D., Chiu, M., & Lavancher, C. (1994) · Cognitive Science · doi:10.1016/0364-0213(94)90016-7 · Cited by 2,492
Research works printed but not linked: 4
- Newbury, P., & Heiner, C. (2012). Ready, set, react! getting the most out of peer instruction using clickers. Retrieved October 28, 2015, from http://www.cwsei.ubc.ca/Files/ReadySetReact_3fold.pdf.
- Steiner, I. D. (1972). Group processes and productivity. New York: Academic Press.
- Vedder, P. (1985). Cooperative learning: A study on processes and effects of cooperation between primary school children. Westerhaven: Rijkuniversiteit Groningen.
- Wieman, C., Perkins, K., Gilbert, S., Benay, F., Kennedy, S., Semsar, K., et al. (2009). Clicker resource guide: An instructor’s guide to the effective use of personalresponse systems (clickers) in teaching. Vancouver: University of British Columbia Available from http://www.cwsei.ubc.ca/resources/files/Clicker_guide_CWSEI_CU-SEI.pdf.
Cited by
Sorted by citations
Carvalho, C., & Almeida, A. C. (2022) · Sustainability · doi:10.3390/su14105755 · Cited by 80
Perspectives on Active Learning: Challenges for Equitable Active Learning Implementation
Nardo, J. E., Chapman, N. C., Shi, E. Y., Wieman, C., & Salehi, S. (2022) · Journal of Chemical Education · doi:10.1021/acs.jchemed.1c01233 · Cited by 67
The neuroscience of active learning and direct instruction
Dubinsky, J. M., & Hamid, A. (2024) · Neuroscience & Biobehavioral Reviews · doi:10.1016/j.neubiorev.2024.105737 · Cited by 121
Molin, F., Haelermans, C., Cabus, S. J., & Groot, W. (2021) · Comput. Educ. · doi:10.1016/j.compedu.2021.104339 · Cited by 35
Fakoya, A. O. J., Ndrio, M., & McCarthy, K. J. (2023) · Advances in Medical Education and Practice · doi:10.2147/amep.s421400 · Cited by 34
Peñafiel, J. J. R., & Inga, E. (2023) · Education Sciences · doi:10.3390/educsci13030301 · Cited by 34
Barut, Ç., Öğüt, E., Karaer, E., & TOPALOĞLU, M. Y. (2025) · Bratislavské lekárske listy/Bratislava medical journal · doi:10.1007/s44411-025-00078-9 · Cited by 27
Zhong, Z., Zhang, G., Jin, S., Wang, J., Ma, N., & Feng, S. (2022) · Education and Information Technologies · doi:10.1007/s10639-022-11115-3 · Cited by 28
Karademir, O., Mitri, D. D., Schneider, J., Jivet, I., Allmang, J., Gombert, S., Kubsch, M., Neumann, K., & Drachsler, H. (2024) · Journal of Computer Assisted Learning · doi:10.1111/jcal.12997 · Cited by 23
Parmar, J. S., Mistry, S. K., Micheal, S., Dune, T. M., LIM, D. J., Alford, S., & Arora, A. (2025) · Education Sciences · doi:10.3390/educsci15050602 · Cited by 44
Reen, F. J., Jump, O., McEvoy, G., McSharry, B. P., Morgan, J. G., Murphy, D., O’Leary, N. D., O’Mahony, B., Scallan, M. F., Walsh, C., et al. (2022) · FEMS Microbiology Letters · doi:10.1093/femsle/fnac051 · Cited by 29
Supporting social interactions to improve MOOC participants’ learning outcomes: a literature review
Loh, H. S., Jaarsveld, G. M. V., Mesutoğlu, C., & Baars, M. (2024) · Frontiers in Education · doi:10.3389/feduc.2024.1345205 · Cited by 20
Innovative Pedagogical Approaches for Diverse Learning Styles and Student-Centric Learning
Dixit, A. C., Harshavardhan, B. S., Ashok, B. C., Sriraj, M. A., & Prakasha, K. N. (2024) · Journal of Engineering Education/Journal of engineering education transformations/Journal of engineering education transformation · doi:10.16920/jeet/2024/v37is2/24039 · Cited by 17
Wiens, P. D., Calkins, L., Yoder, P. J., & Hightower, A. (2021) · The Journal of Social Studies Research · doi:10.1016/j.jssr.2021.05.006 · Cited by 22
Chaotic image encryption based on partial face recognition and DNA diffusion
Teng, L., Du, L., Leng, Z., & Wang, X. (2024) · Applied Intelligence · doi:10.1007/s10489-024-05613-9 · Cited by 16
Nel, M., Hay, J. F., Bekker, T. L.-A., Beyers, C., Pylman, N., Alexander, G., & Matoti, S. N. (2023) · Frontiers in Education · doi:10.3389/feduc.2023.1024054 · Cited by 15
Subjective Confidence as a Monitor of the Replicability of the Response
Koriat, A. (2024) · Perspectives on Psychological Science · doi:10.1177/17456916231224387 · Cited by 22
Molin, F., de Bruin, A. B. H., & Haelermans, C. (2022) · Social Sciences & Humanities Open · doi:10.1016/j.ssaho.2022.100323 · Cited by 17
Active teaching methodologies in health education
Sanglard, L. F., Oliveira, L. B., de Brito, R. B., de CALASANS, M. C. M., Simões, L. F. D. C. C., Issa, Y. S. M. D. M., & FRATESCHI, R. D. (2022) · RGO - Revista Gaúcha de Odontologia · doi:10.1590/1981-86372022005020220037 · Cited by 13
Wang, Z.-J., Liu, X., He, J., Wang, Y.-P., Zhao, C.-X., Yang, X.-J., Yin, H., Cao, D., & Zhang, S.-E. (2023) · Psychology Research and Behavior Management · doi:10.2147/prbm.s403219 · Cited by 13
Teaching Shakespeare and His Sisters
Whipday, E. (2023) · Cambridge University Press eBooks · doi:10.1017/9781108975650 · Cited by 12
Students’ perception of peer teaching in engineering education: a mixed–method case study
Dosoftei, C.-C., & Alexa, L. (2024) · Humanities and Social Sciences Communications · doi:10.1057/s41599-024-03349-y · Cited by 21
Hao, M., Liu, Z., Liu, Y., Wan, Q., Chen, J., Shu, J., Liu, Y., & Mei, L. (2024) · Interactive Learning Environments · doi:10.1080/10494820.2024.2362804 · Cited by 9
Beyond Question Shuffling: Randomization Techniques in Programming Assessment
Hickman, H., McKeown, P., & Bell, T. (2023) · IEEE Frontiers in Education Conference (FIE) · doi:10.1109/fie58773.2023.10342976 · Cited by 9
Learning during the pandemic: Perspectives of medical students in Singapore
Ng, I. K., Zhang, V. R., Tseng, F. S., Tay, D. S. H., Lee, S. S., & Lau, T. C. (2021) · Annals of the Academy of Medicine Singapore · doi:10.47102/annals-acadmedsg.2021136 · Cited by 9
Recommendations for Orchestration of Formative Assessment Sequences: A Data-Driven Approach
Andriamiseza, R., Silvestre, F., Parmentier, J., & Broisin, J. (2021) · Lecture notes in computer science · doi:10.1007/978-3-030-86436-1_19 · Cited by 15
Investigations into EFL Students’ Pragmatic and Grammatical Awareness through Peer Collaboration
Chiu, E. F.-Y., Chen, Y., & Tai, H. (2022) · Sustainability · doi:10.3390/su141710568 · Cited by 9
Yang, J. W., Choe, K., Lim, J., & Park, J. (2025) · Interactive Learning Environments · doi:10.1080/10494820.2025.2488984 · Cited by 9
Szalai, C., Shehada, S.-E., Iancu, S., Herbstreit, F., Ruhparwar, A., Brenner, T., & Haddad, A. (2022) · Medical Teacher · doi:10.1080/0142159x.2022.2133692 · Cited by 8
Lee, C., & Wang, J. (2023) · Anatomical Sciences Education · doi:10.1002/ase.2350 · Cited by 8
Gellisch, M., Cramer, J., Trenkel, J., Bäker, F., Bablok, M., Moroşan‐Puopolo, G., Schäfer, T., & Brand‐Saberi, B. (2025) · Anatomical Sciences Education · doi:10.1002/ase.70010 · Cited by 8
Bickel, J. E., Bunnell, L. M., & Heus, T. (2021) · European journal of physics · doi:10.1088/1361-6404/ac0321 · Cited by 8
Rudinsky, S. L., Spalding, C. N., Conley, S. P., Everett, L., & Cole, R. (2022) · AEM Education and Training · doi:10.1002/aet2.10782 · Cited by 8
Lima, R. M., Villas-Boas, V., Soares, F., Carneiro, O. S., Ribeiro, P. J. G., & Mesquita, D. (2024) · European Journal of Engineering Education · doi:10.1080/03043797.2024.2313541 · Cited by 7
Twelve tips for providing academic remediation to widening access learners in medical education
Selva-Rodriguez, A., & Sandars, J. E. (2023) · Medical Teacher · doi:10.1080/0142159x.2023.2216360 · Cited by 7
Bashir, A., Dudley, K., Rana, K. S., Wilkins, K., & Pallett, R. (2024) · British Journal of Biomedical Science · doi:10.3389/bjbs.2024.12017 · Cited by 6
Catania, A., Coutts, K. A., & Barber, N. (2023) · The Clinical Teacher · doi:10.1111/tct.13674 · Cited by 6
Student-centredness in physics laboratory teaching sessions
Lehesvuori, S., Lehtinen, A., Hämäläinen, R., Maunuksela, J., & Koskinen, P. (2023) · Learning Culture and Social Interaction · doi:10.1016/j.lcsi.2023.100773 · Cited by 16
Improving learners’ comprehension skills in the early years through group discussion
Omidire, M. F. (2021) · Early Child Development and Care · doi:10.1080/03004430.2020.1868999 · Cited by 6
Using digital formative assessments to improve learning in physics education
Molin, F. (2021) · Research Publications (Maastricht University) · doi:10.26481/dis.20220114fm · Cited by 5
Ngoma, K. (2024) · Interdisciplinary Journal of Education Research · doi:10.38140/ijer-2024.vol6.41 · Cited by 5
Popichak, K. A., Gruber, P. E., Suchman, E., & McLean, J. (2025) · Journal of Microbiology and Biology Education · doi:10.1128/jmbe.00042-25 · Cited by 5
Flipped Classroom Models: A Rapid Review From Recent Literatures
Poudel, N., & Sharma, L. (2022) · International Journal of Educational Reform · doi:10.1177/10567879221124878 · Cited by 11
Engineering students’ cognitive engagement and visual attention in undergraduate mathematics lessons
Lehesvuori, S., Järvinen, M., Räty, P., Lämsä, J., Roslöf, J., Kettunen, L., & Hämäläinen, R. (2025) · International Journal of Mathematical Education in Science and Technology · doi:10.1080/0020739x.2025.2551829 · Cited by 4
Clark, S. A., Rivers, M. L., & Overono, A. L. (2025) · Behavioral Sciences · doi:10.3390/bs15040477 · Cited by 6
Basheer, H. A., Isreb, M., Batarseh, Y. S., & Tweddell, S. (2022) · Indian Journal of Pharmaceutical Education and Research · doi:10.5530/ijper.56.2s.85 · Cited by 4
Versatile video assignment improves undergraduates’ learning and confidence
Cardace, A., Hefferon, K. L., Levina, A., Angert, E. R., Buckley, D. H., Miller, W., Sanfilippo, L., Silva, T., & Aslan, C. (2024) · Active Learning in Higher Education · doi:10.1177/14697874241287208 · Cited by 7
de Magalhães, S. R., Rodrigues, L. M., & Pereira, C. A. (2021) · Revista Prática Docente · doi:10.23926/rpd.2021.v6.n3.e083.id1257 · Cited by 4
Andueza, A. (2022) · Revista Electrónica Educare · doi:10.15359/ree.27-1.14000 · Cited by 4
Nguyen, T. Q. T., & Nguyen, A. T. (2025) · Dong Thap University Journal of Science · doi:10.52714/dthu.14.7.2025.1559 · Cited by 4
A systematic review of classroom technologies supporting student centered teaching
Swai, C. T. (2025) · Discover Education · doi:10.1007/s44217-025-00932-6 · Cited by 11
Xiao, F., Wang, C., & Jiang, J. (2026) · Sustainability · doi:10.3390/su18062791 · Cited by 3
Ndone, J., & Kiura, M. (2025) · SAGE Open · doi:10.1177/21582440251339524 · Cited by 3
Review of Trends in Peer Instruction: Bibliometric Mapping Analysis and Systematic Review
Olpak, Y. Z., & Yılmaz, R. (2021) · Journal of Learning and Teaching in Digital Age · doi:10.53850/joltida.978824 · Cited by 4
Educators' Perspective On The Progressivist Approach In Teaching Science Online
Florungco, J. K. (2022) · International Journal of Asian Education · doi:10.46966/ijae.v3i3.265 · Cited by 3
EMPOWERING THE COMMUNITY AND PROFESSIONAL DEVELOPMENT THROUGH COLLABORATIVE DIGITAL LEARNING
Hoo, C. L., Poh, W. L., & Tierney, A. M. (2022) · Asean Journal of Teaching and Learning in Higher Education · doi:10.17576/ajtlhe.1402.2022.07 · Cited by 3
High School Students' Comprehension of Kinematics Graphs wıth Peer Instruction Approach
Gök, T., & Gok, O. (2022) · Jurnal Pendidikan Fisika Indonesia · doi:10.15294/jpfi.v18i2.35028 · Cited by 3
The Student Grand Round: A Peer Teaching Initiative
Nazari, A., Rajesh, M., Antoun, I., Azhar, M. S. M., & Hayat, M. (2024) · Cureus · doi:10.7759/cureus.60976 · Cited by 3
Engaging students in online workshops Using Articulate Rise
Hooley, Z., Forster, E., & Browne, A. (2021) · Journal of Learning Development in Higher Education · doi:10.47408/jldhe.vi22.780 · Cited by 3
Evaluation of a student pharmacist approach to NCAA substance education for student athletes
Bye, K., Kohler, J., Frenzel, J. E., & Richter, L. M. (2024) · Currents in Pharmacy Teaching and Learning · doi:10.1016/j.cptl.2023.12.020 · Cited by 2
Imitating Mistakes in a Learning Companion AI Agent for Online Peer Learning
Moribe, S., & Ushiama, T. (2025) · International Conference on Ubiquitous Information Management and Communication (IMCOM) · doi:10.1109/imcom64595.2025.10857528 · Cited by 2
A Roadmap Towards an Inclusive Anatomy Curriculum
Venkatesh, A., & Rahmanova, A. (2025) · Biomedical visualization · doi:10.1007/978-3-031-91849-0_3 · Cited by 2
Leutner, D., & Biele, J. (2025) · Educational Psychology Review · doi:10.1007/s10648-025-10067-7 · Cited by 4
Spang, L., Greisel, M., & Kollar, I. (2025) · Journal of the Learning Sciences · doi:10.1080/10508406.2025.2553543 · Cited by 2
Lin, C., Li, T., Zou, G., Li, X., Li, L., & Chen, W. L. (2022) · Frontiers in Public Health · doi:10.3389/fpubh.2022.772632 · Cited by 2
THE EFFECT OF PEER-ASSISTED LEARNING ON MEDICAL LABORATORY SCIENCE STUDENTS’ ACHIEVEMENT
Osman, S., Abukaraig, E. A. B., Elsheikh, N. M. A., Alameen, M. A. A., Ahmed, E. M. E. M., Ahmed, A., & Almahi, O. M. (2022) · International Journal of Research -GRANTHAALAYAH · doi:10.29121/granthaalayah.v10.i11.2022.4900 · Cited by 2
Co-curricular Immersion as a Public–Private Capacity Building Activity
Reddy, A., Sieg, J., Ristevski, E., Polaconda, S. S., Buck, J., Guenther, R., Jones, A. M., Sweet, L., Williams, M. R., & Drummond, C. K. (2023) · Biomedical Engineering Education · doi:10.1007/s43683-022-00098-9 · Cited by 2
Peer teachers taking the lead in classroom instruction: program creation and challenges faced
Lowe, M. S., Stone, S. M., & Macy, K. (2023) · Reference Services Review · doi:10.1108/rsr-09-2022-0041 · Cited by 3
Banu, M. S. (2023) · International Conference on Research Methodologies in Knowledge Management, Artificial Intelligence and Telecommunication Engineering (RMKMATE) · doi:10.1109/rmkmate59243.2023.10369488 · Cited by 2
Sa’dijah, C., Anwar, L., Hidayah, I. R., Abdullah, A. H., & Cahyowati, E. T. D. (2024) · AIP conference proceedings · doi:10.1063/5.0234944 · Cited by 2
Buddychecking, a Way to Enhance Student Participation in Bioscience Project-Based Learning
Wood, D., & Pranjol, M. Z. I. (2024) · Education Sciences · doi:10.3390/educsci14101103 · Cited by 8
Jigsaw as a Revision Module for Enhancing Learning in Biochemistry Among First-Year Medical Students
Nimesh, A., Kumawat, R., Sinha, S., Harshitha, R., Goyal, G., Pathak, A. K., & Sharma, H. (2024) · Cureus · doi:10.7759/cureus.74720 · Cited by 2
SETT: A Framework for Capacity Building Partnerships
Sweet, L., Jones, A., & Drummond, C. K. (2024) · ASEE North Central Section Conference · doi:10.18260/1-2--39258 · Cited by 2
Warwick-Booth, L., Coan, S., Rushworth, S., Davies, S., Cross, R., Rowlands, S., Ismaila, M. S., Uneke, E., Osoro, O. I., Oladele, D., et al. (2023) · Advances in higher education and professional development book series · doi:10.4018/978-1-6684-8198-1.ch012 · Cited by 2
Building Training Methodology: Preparing Invigilators for Active, In-person, Exam Management
Cameron, T., Salvia, A. C., & Hirji, N. Z. (2023) · Journal of innovation in polytechnic education. · doi:10.69520/jipe.v4i2.81 · Cited by 3
Development of the Individual and Peer Study Skills Scale
Fer, S., Ertuna, L., UYSAL, İ., Gürer, M. D., Debbağ, M., Karataş, F., Karadeniz, D., Kuzgun, Y., Genç, E., Cırık, İ., et al. (2024) · Uluslararası Türk Eğitim Bilimleri Dergisi · doi:10.46778/goputeb.1460366 · Cited by 1
Kireeti, K., Egitim, S., & Thomson, B. J. (2024) · Language Learning in Higher Education · doi:10.1515/cercles-2024-0037 · Cited by 1
How Virtual Agents Can Shape Human-Human Collaboration: A Systematic Review
Earle-Randell, T. V., Zhang, S., Schroeder, N. L., Boyer, K. E., & Dorley, E. (2025) · Lecture notes in computer science · doi:10.1007/978-3-031-98420-4_33 · Cited by 1
Smith, C. M., Emery, N. N., Payne, J. S., Kaloi, M., Niu, M. E., Fife, P., & Jensen, J. L. (2025) · Journal of Science Education and Technology · doi:10.1007/s10956-025-10254-9 · Cited by 1
Grundy, L. S., & Koretsky, M. (2025) · Journal of Engineering Education · doi:10.1002/jee.70035 · Cited by 3
Nascimento, M. S., & Marques, J. D. D. O. (2025) · Educação (UFSM) · doi:10.5902/1984644491918 · Cited by 1
Empowering self-directed learners through digital innovation and open educational practices
Laubscher, D. J. (2026) · NWU self-directed learning series · doi:10.4102/aosis.2025.bk546 · Cited by 2
Sadiah, R. L., Ali, M. S., & Khaeruddin (2025) · Jurnal Penelitian Pendidikan IPA · doi:10.29303/jppipa.v11i2.7277 · Cited by 1
Lehesvuori, S., Järvinen, M., Lämsä, J., Heilala, V., & Hämäläinen, R. (2026) · Instructional Science · doi:10.1007/s11251-026-09786-3 · Cited by 1
RANA, H. P. (2022) · International Journal of Research Publications · doi:10.47119/ijrp1001021620223291 · Cited by 1
Mitchell, S. L., McCourt, J. S., Nesset-Tollefson, D. J., Kimball, G. L., Mikesell, J. N., Tollefson, E. J., & Carlson, E. E. (2022) · Journal of Chemical Education · doi:10.1021/acs.jchemed.2c00836 · Cited by 1
Ways of overcoming academic failures: A review article
Tavstukha, O. G., Ganaeva, E. A., Артуровна, М. А., Юрьевна, Ш. Л., & Геннадьевна, М. Е. (2022) · Science for Education Today · doi:10.15293/2658-6762.2206.02 · Cited by 1
Valdivia, K. B. (2023) · Revista de educación y derecho · doi:10.1344/reyd2023.27.40622 · Cited by 1
‘Virtual café’ sessions: supporting medical sonography students learning anatomy online
Fenech, M., Mead, N., & Fenech, N. (2023) · Reflective Practice · doi:10.1080/14623943.2023.2297673 · Cited by 1
Lopez, L. C., & Guidry, M. (2024) · American Journal of Audiology · doi:10.1044/2024_aja-23-00273 · Cited by 1
Ospanbekov, Y., Maxutov, S., Sandybayev, Y., Boranbekova, A., & Balta, N. (2024) · Eurasia Journal of Mathematics Science and Technology Education · doi:10.29333/ejmste/14778 · Cited by 1
Teacher’s Perceptions of the Fertility in Implementing Project-based Learning in Engineering Courses
Neto, O. M., & Souza, G. (2024) · ASEE Annual Conference & Exposition · doi:10.18260/1-2--48056 · Cited by 1
DOES DISCUSSION HAVE EFFECT ON STUDENTS’ RESPONSES?
Kaymak, S. (2020) · Proceedings of International Young Scholars Workshop · doi:10.47344/iysw.v9i0.199 · Cited by 2
Andriamiseza, R., Silvestre, F., Parmentier, J., & Broisin, J. (2021) · ACM Conference on Learning @ Scale (L@S) · doi:10.1145/3430895.3460153 · Cited by 1
Talking during a test?! Embracing mobile instant messaging during assessment
van Rensburg, C. J., Coetzee, S. A., & Schmulian, A. (2022) · Assessment & Evaluation in Higher Education · doi:10.1080/02602938.2022.2041545 · Cited by 1
Peer-Led Case Study Methodology in the Learning of Statistics
John, S., & Sagadavan, R. (2022) · Springer eBooks · doi:10.1007/978-981-19-4383-6_12 · Cited by 2
Solutions to improve students' ability to work in pairs and achieve higher results
Cuong, H. K. (2023) · Journal for Educators Teachers and Trainers · doi:10.47750/jett.2023.14.03.016 · Cited by 1
Generative AI-Enhanced Oral Exams in Economics Education
Onodipe, G., Ayadi, M. F., & Burke, K. (2026) · Journal of Economics Teaching · doi:10.58311/jeconteach/1857ce5b8076c7d7c2e6adb75f531cbd5c7ac473
Assessment in Preparing In-Service Teachers to Teach in the Digital Age
Batane, T., & Butale, C. (2022) · Future education and learning spaces · doi:10.1007/978-981-19-4226-6_4
Dental students’ attitudes and perceptions about intraprofessional collaboration/education
AlSarhan, M., Alaqeely, R., Ahmedani, M. S., Jasser, R. A., Alotaibi, D. H., Aloraini, S. S., & Habib, S. R. (2022) · Journal of Taibah University Medical Sciences · doi:10.1016/j.jtumed.2022.09.003
Metadata
- Authors
- Tullis, J. G., & Goldstone, R. L.
- Affiliations
- University of Arizona (US)
- Indiana University Bloomington (US)
- Corresponding author
- Tullis, Jonathan G.
- Venue
- Cognitive Research: Principles and Implications
- Published
- 2020-04-09
- Volume
- 5
- Issue
- 1
- Pages
- 15-15
- ISSN
- 2365-7464 (ISSN-L)
- PMC
- PMC7145884
- OpenAlex
- W3015961046
- Cited by
- 153
- References
- 117
- Citations by year
- 2026: 28 · 2025: 34 · 2024: 31 · 2023: 21 · 2022: 27 · 2021: 11 · 2020: 1
- FWCI
- 22.77
- Type
- journal article
- Language
- en
- Open access
- gold
- doi.org
- Locations
- Cognitive Research Principles and Implications (publishedVersion, cc-by)
- PubMed Central (publishedVersion, cc-by)
- PubMed (publishedVersion)
- UA Campus Repository (The University of Arizona) (acceptedVersion, cc-by)
- DOAJ (DOAJ: Directory of Open Access Journals) (submittedVersion, cc-by-sa)
- Topics
- Social Sciences › Education › Innovative Teaching Methods
- Social Sciences › Psychology › Developmental and Educational Psychology › Innovative Teaching and Learning Methods
- Social Sciences › Psychology › Experimental and Cognitive Psychology › Visual and Cognitive Learning Processes
- Keywords
- peer instruction, student learning, confidence, accuracy, peer discussion, social learning, misconceptions, metacognition, undergraduate science education
- MeSH terms
- Academic Performance, Adult, Female, Humans, Learning, Male, Peer Group, Students, Universities, Young Adult
About these checks
Registry, retraction, Cites and statistics results are computed, not judged, with one exception: a printed reference that no index lists is read once by a model before it counts as a citation error. Claims are extracted by a model and kept only when their quote appears verbatim in the text; each cited source is then checked, with a model’s help, for whether it says what the claim relies on. Those verdicts can be wrong — read the claim’s quote and the cited source before relying on one.
Statistics and arithmetic are recomputed, not judged.
Confidence bands are shown only for fields calibrated on our annotated test set. None is calibrated yet, so no band is shown.
What counts as a claim ›How we measure confidence ›How we check this ›
Are you an author, or do you see a problem with this page? Request a review
