

The DOI matches its Crossref record; 47 of the 48 references it cites were found in a registry or an index.
AKR1C3-Mediated Adipose Androgen Generation Drives Lipotoxicity in Women With Polycystic Ovary Syndrome
Open accessAbstract
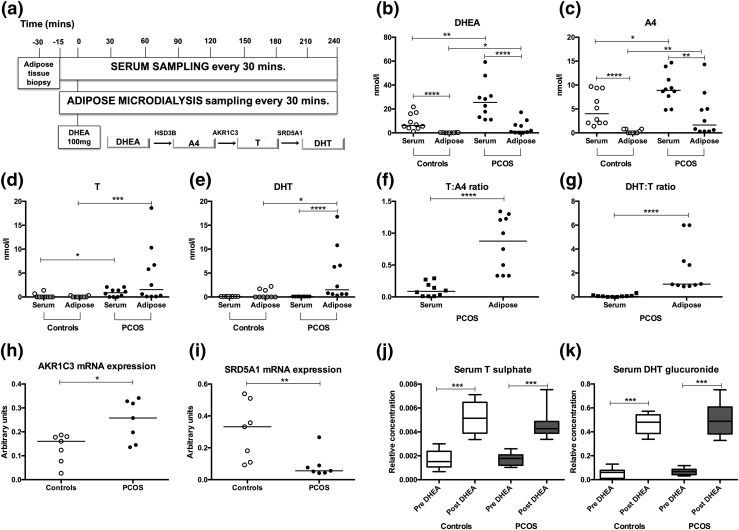
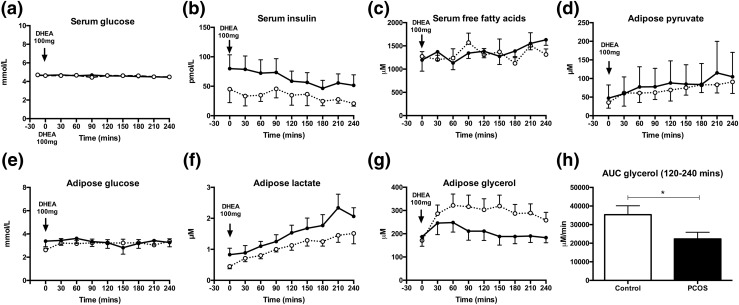
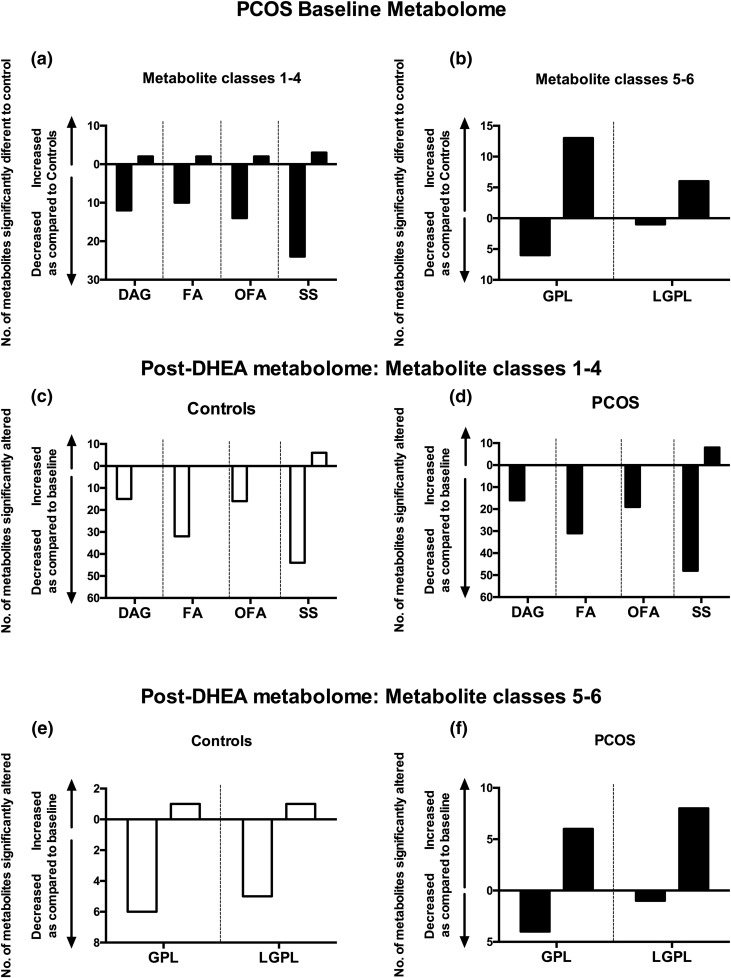
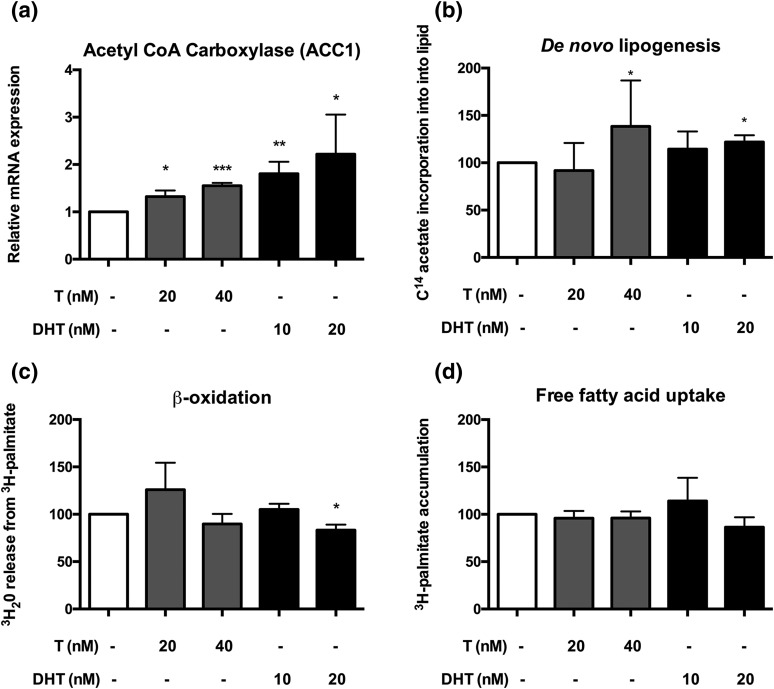
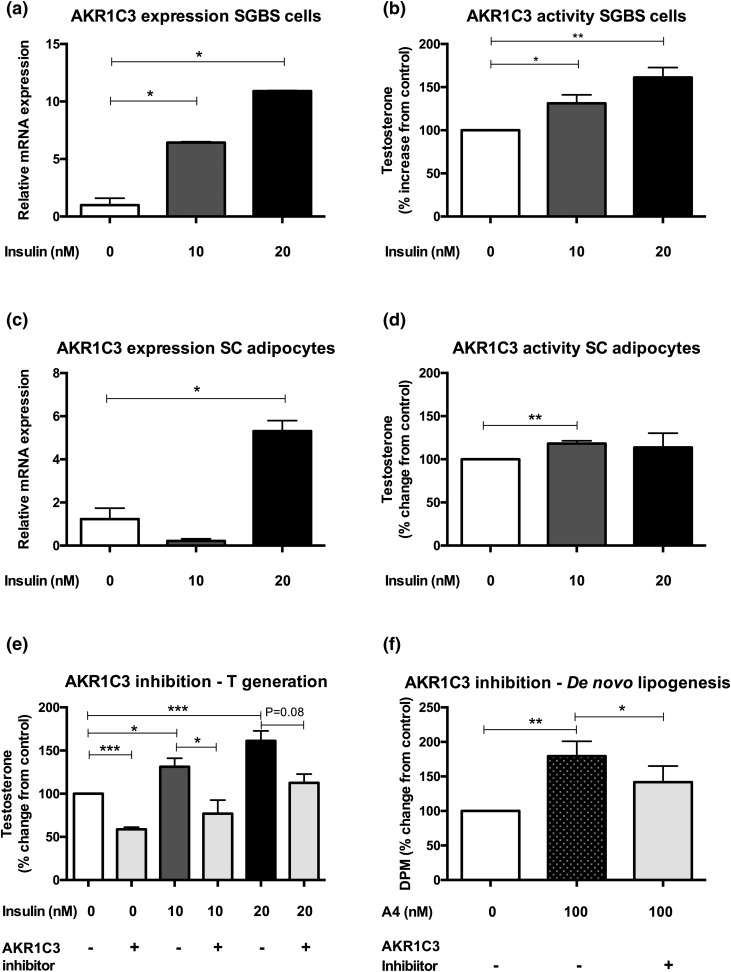
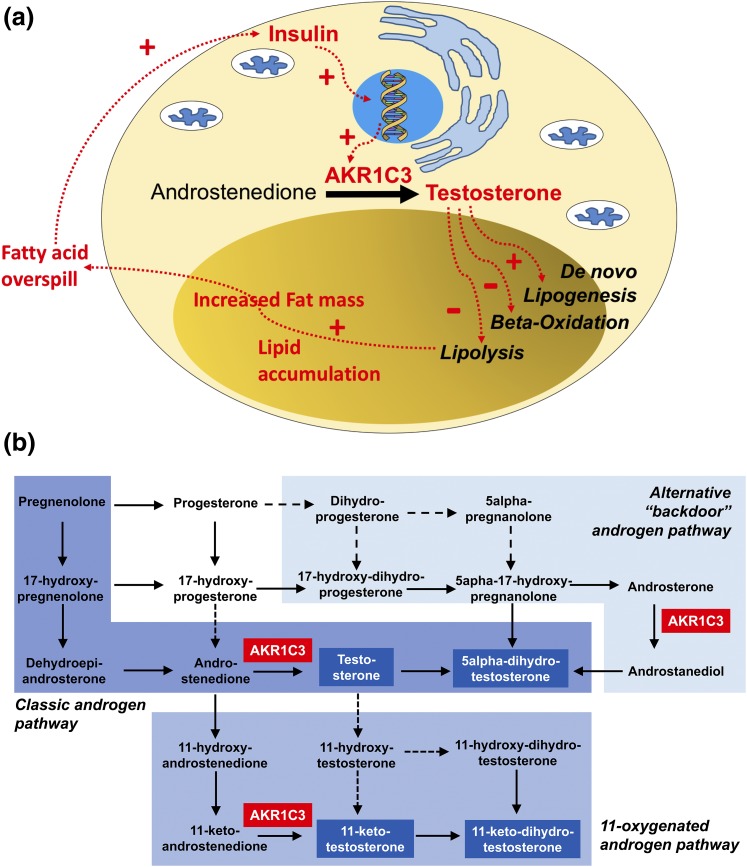
Context: Polycystic ovary syndrome (PCOS) is a prevalent metabolic disorder occurring in up to 10% of women of reproductive age. PCOS is associated with insulin resistance and cardiovascular risk. Androgen excess is a defining feature of PCOS and has been suggested as causally associated with insulin resistance; however, mechanistic evidence linking both is lacking. We hypothesized that adipose tissue is an important site linking androgen activation and metabolic dysfunction in PCOS. Methods: We performed a human deep metabolic in vivo phenotyping study examining the systemic and intra-adipose effects of acute and chronic androgen exposure in 10 PCOS women, in comparison with 10 body mass index-matched healthy controls, complemented by in vitro experiments. Results: PCOS women had increased intra-adipose concentrations of testosterone (P = 0.0006) and dihydrotestosterone (P = 0.01), with increased expression of the androgen-activating enzyme aldo-ketoreductase type 1 C3 (AKR1C3) (P = 0.04) in subcutaneous adipose tissue. Adipose glycerol levels in subcutaneous adipose tissue microdialysate supported in vivo suppression of lipolysis after acute androgen exposure in PCOS (P = 0.04). Mirroring this, nontargeted serum metabolomics revealed prolipogenic effects of androgens in PCOS women only. In vitro studies showed that insulin increased adipose AKR1C3 expression and activity, whereas androgen exposure increased adipocyte de novo lipid synthesis. Pharmacologic AKR1C3 inhibition in vitro decreased de novo lipogenesis. Conclusions: These findings define an intra-adipose mechanism of androgen activation that contributes to adipose remodeling and a systemic lipotoxic metabolome, with intra-adipose androgens driving lipid accumulation and insulin resistance in PCOS. AKR1C3 represents a promising therapeutic target in PCOS.
Overview
The claims and statistics of this paper haven’t been checked yet.
Run the check — free, no account needed. It reads the open-access text and checks the sources it cites.
Integrity signals
Registry
Cites
Statistics
Figures
Verification
Claims the paper makes
The claims and statistics of this paper haven’t been checked yet.
Run the check — free, no account needed. It reads the open-access text and checks the sources it cites.
Claims other papers make about this one
Each is checked against this paper’s own text: does it say what the citing paper says it does?
The source backs part of the claim, not all of it — or backs it for a different population, condition or comparison.
In the citing paper
“Insulin stimulates AKR1C3 expression in the adipose tissue of women with PCOS and its inhibition has been suggested as offering a therapeutic target to reduce the hyperandrogenism that is a feature of this disorder [101].”
From Endometrial Intracrinology: Oestrogens, Androgens and Endometrial Disorders (2018) · cites this paper as [101]
Experimental — accuracy not yet measuredIn the citing paper
“Using a human preadipocyte cell line, both testosterone and DHT increased de novo lipogenesis in the absence of insulin [95], whereas pharmacologic inhibition of AKR1C3 activity prevented androgen-mediated adverse effects on adipocyte lipogenesis.”
From Polycystic Ovary Syndrome: Pathophysiology, Presentation, and Treatment With Emphasis on Adolescent Girls (2019) · cites this paper as [95]
In the citing paper
“Using this model system, insulin increased AKR1C3 expression.”
From Polycystic Ovary Syndrome: Pathophysiology, Presentation, and Treatment With Emphasis on Adolescent Girls (2019) · cites this paper as [95]
In the citing paper
“Using a human preadipocyte cell line, both testosterone and DHT increased de novo lipogenesis in the absence of insulin [95], whereas pharmacologic inhibition of AKR1C3 activity prevented androgen-mediated adverse effects on adipocyte lipogenesis.”
From Polycystic Ovary Syndrome: Pathophysiology, Presentation, and Treatment With Emphasis on Adolescent Girls (2019) · cites this paper as [95]
In the citing paper
“A deep in vivo metabolic phenotyping study showed increased AKR1C3 and decreased SRD5A1 mRNA expression in subcutaneous fat of women with PCOS [95].”
From Polycystic Ovary Syndrome: Pathophysiology, Presentation, and Treatment With Emphasis on Adolescent Girls (2019) · cites this paper as [95]
Self-check
Percentages, sums and reported differences re-computed from the paper’s own numbers.
The self-check needs the paper’s full text.
Citations
Cites
(2004) · Fertility and Sterility · doi:10.1016/j.fertnstert.2003.10.004 · Cited by 9,050
The Diagnosis of Polycystic Ovary Syndrome during Adolescence
Witchel, S. F., Oberfield, S., Rosenfield, R. L., Codner, E., Bonny, A., Ibáñez, L., Pena, A., Horikawa, R., Gomez-Lobo, V., Joel, D., et al. (2015) · Hormone Research in Paediatrics · doi:10.1159/000375530 · Cited by 3,113
Insulin Resistance and the Polycystic Ovary Syndrome: Mechanism and Implications for Pathogenesis
Dunaif, A. E. (1997) · Endocrine Reviews · doi:10.1210/edrv.18.6.0318 · Cited by 2,776
Franks, S. (1995) · New England Journal of Medicine · doi:10.1056/nejm199509283331307 · Cited by 2,463
Men at risk: occupation and male infertility.
Claman, P. (2004) · Fertility and Sterility · doi:10.1016/s0015-0282(03)01188-9 · Cited by 2,219
Legro, R. S. (1999) · Journal of Clinical Endocrinology & Metabolism · doi:10.1210/jc.84.1.165 · Cited by 1,743
Gao, X., Wu, G., Gu, X., Fu, L., & Mei, C. (2013) · Kidney & Blood Pressure Research · doi:10.1159/000355743 · Cited by 1,035
Franks, S. (1997) · Archives of Disease in Childhood · doi:10.1136/adc.77.1.89 · Cited by 802
Yildiz, B. O., Bozdag, G., Yapici, Z., Esinler, I., & Yarali, H. (2012) · Human Reproduction · doi:10.1093/humrep/des232 · Cited by 704
Genetic Syndromes of Severe Insulin Resistance
Semple, R. K., Savage, D. B., Cochran, E. K., Görden, P., & O’Rahilly, S. (2011) · Endocrine Reviews · doi:10.1210/er.2010-0020 · Cited by 367
Self-citationArlt, W., Walker, E. A., Draper, N., Ivison, H. E., Ride, J. P., Hammer, F., Chalder, S. M., Borucka-Mankiewicz, M., Hauffa, B. P., Malunowicz, E. M., et al. (2004) · The Lancet · doi:10.1016/s0140-6736(04)16503-3 · Cited by 345
Self-citationRole of Krüppel-like Factor 15 (KLF15) in Transcriptional Regulation of Adipogenesis
Mori, T., Sakaue, H., Iguchi, H., Gomi, H., Okada, Y., Takashima, Y., Nakamura, K., Nakamura, T., Yamauchi, T., Kubota, N., et al. (2005) · Journal of Biological Chemistry · doi:10.1074/jbc.m410515200 · Cited by 340
Cardiometabolic Aspects of the Polycystic Ovary Syndrome
Randeva, H. S., Tan, B. K., Weickert, M. O., Lois, K. B., Nestler, J. E., Sattar, N. A., & Lehnert, H. (2012) · Endocrine Reviews · doi:10.1210/er.2012-1003 · Cited by 336
O’Reilly, M., TAYLOR, A. E. R., Crabtree, N. J., Hughes, B. A., Capper, F., Crowley, R. K., Stewart, P. M., Tomlinson, J., & Arlt, W. (2014) · The Journal of Clinical Endocrinology & Metabolism · doi:10.1210/jc.2013-3399 · Cited by 279
Self-citationLipid-Overloaded Enlarged Adipocytes Provoke Insulin Resistance Independent of Inflammation
Kim, J. I., Huh, J. Y., Sohn, J. H., Choe, S. S., Lee, Y. S., Lim, C. Y., Jo, A., Park, S. B., Han, W., & Kim, J. B. (2015) · Molecular and Cellular Biology · doi:10.1128/mcb.01321-14 · Cited by 272
11-Oxygenated C19 steroids are the predominant androgens in polycystic ovary syndrome
O’Reilly, M. W., Kempegowda, P., Jenkinson, C., Taylor, A. E., Quanson, J. L., Storbeck, K.-H., & Arlt, W. (2017) · The Journal of Clinical Endocrinology & Metabolism · doi:10.1210/jc.2016-3285 · Cited by 267
Self-citationJones, H., Sprung, V. S., Pugh, C. J. A., Daousi, C., Irwin, A., Aziz, N., Adams, V. L., Thomas, E. L., Bell, J. D., Kemp, G. J., et al. (2012) · The Journal of Clinical Endocrinology & Metabolism · doi:10.1210/jc.2012-1382 · Cited by 256
Regulation of Gluconeogenesis by Krüppel-like Factor 15
Gray, S., Wang, B., Orihuela, Y., Hong, E., Fisch, S., Haldar, S. M., Cline, G. W., Kim, J. K., Peroni, O. D., Kahn, B. B., et al. (2007) · Cell Metabolism · doi:10.1016/j.cmet.2007.03.002 · Cited by 253
Human SGBS Cells – a Unique Tool for Studies of Human Fat Cell Biology
Fischer‐Posovszky, P., Newell, F., Wabitsch, M., & Tornqvist, H. E. (2008) · Obesity Facts · doi:10.1159/000145784 · Cited by 248
Arlt, W., Justl, H.-G., Callies, F., Reincke, M., Hübler, D., Oettel, M., Ernst, M., Schulte, H. M., & Allolio, B. (1998) · The Journal of Clinical Endocrinology & Metabolism · doi:10.1210/jcem.83.6.4850 · Cited by 199
Self-citationQuinkler, M. O., Sinha, B., Tomlinson, J., Bujalska, I. J., Stewart, P. M., & Arlt, W. (2004) · Journal of Endocrinology · doi:10.1677/joe.1.05762 · Cited by 195
Self-citationReproductive and Metabolic Phenotype of a Mouse Model of PCOS
van Houten, E. L. A. F., Kramer, P., McLuskey, A., Karels, B., Themmen, A. P. N., & Visser, J. A. (2012) · Endocrinology · doi:10.1210/en.2011-1754 · Cited by 190
5 α-reductase activity in polycystic ovary syndrome
Stewart, P. M., Edwards, C. R. W., Shackleton, C. H. L., & Beastall, G. H. (1990) · The Lancet · doi:10.1016/0140-6736(90)90664-q · Cited by 189
Understanding androgen action in adipose tissue
O’Reilly, M. W., House, P. J., & Tomlinson., J. W. (2014) · The Journal of Steroid Biochemistry and Molecular Biology · doi:10.1016/j.jsbmb.2014.04.008 · Cited by 180
Self-citationPolycystic ovary syndrome (PCOS) and the risk of coronary heart disease (CHD): a meta-analysis.
Zhao, L., Zhu, Z., Lou, H., Zhu, G., Huang, W., Zhang, S., & Liu, F. (2016) · Oncotarget · doi:10.18632/oncotarget.9553 · Cited by 174
Inactivating PAPSS2 Mutations in a Patient with Premature Pubarche
Noordam, C., Dhir, V., McNelis, J. C., Schlereth, F., Hanley, N. A., Krone, N., Smeitink, J. A., Smeets, R., Sweep, F. C. G. J., Grinten, H. L. C.-V. D., et al. (2009) · New England Journal of Medicine · doi:10.1056/nejmoa0810489 · Cited by 169
Self-citationFassnacht, M., Schlenz, N., Schneider, S. B., Wudy, S. A., Allolio, B., & Arlt, W. (2003) · The Journal of Clinical Endocrinology & Metabolism · doi:10.1210/jc.2002-021875 · Cited by 158
Self-citationA new dawn for androgens: novel lessons from 11-oxygenated C19 steroids
Pretorius, E., Arlt, W., & Storbeck, K.-H. (2017) · Molecular and Cellular Endocrinology · doi:10.1016/j.mce.2016.08.014 · Cited by 142
Self-citationNakamura, Y., Hornsby, P. J., Casson, P., Morimoto, R., Satoh, F., Xing, Y., Kennedy, M. R., Sasano, H., & Rainey, W. E. (2009) · The Journal of Clinical Endocrinology & Metabolism · doi:10.1210/jc.2008-2374 · Cited by 129
Μacut, D., Τζιόμαλος, Κ., Antić, I. B., Bjekić-Macut, J., Katsikis, I., Papadakis, E. P., Andric, Z. G., & Panidis, D. (2016) · Human Reproduction · doi:10.1093/humrep/dew076 · Cited by 123
Circulating phospholipid profiling identifies portal contribution to NASH signature in obesity
Anjani, K., Lhomme, M., Sokolovska, N., Poitou, C., Aron-Wisnewsky, J., Bouillot, J.-L., Lesnik, P., Bedossa, P., Kontush, A., Clement, K., et al. (2015) · Journal of Hepatology · doi:10.1016/j.jhep.2014.11.002 · Cited by 106
Weight Loss Increases 11β-Hydroxysteroid Dehydrogenase Type 1 Expression in Human Adipose Tissue
Tomlinson, J., Moore, J. S., Clark, P. M. S., Holder, G., Shakespeare, L., & Stewart, P. M. (2004) · The Journal of Clinical Endocrinology & Metabolism · doi:10.1210/jc.2003-031376 · Cited by 93
Self-citationKLF15 enables rapid switching between lipogenesis and gluconeogenesis during fasting
Takeuchi, Y., Yahagi, N., Aita, Y., Murayama, Y., Sawada, Y., Piao, X., Toya, N., Oya, Y., Shikama, A., Takarada, A., et al. (2016) · Cell Reports · doi:10.1016/j.celrep.2016.07.069 · Cited by 91
Oostdijk, W., Idkowiak, J., Mueller, J. W., House, P. J., Taylor, A. E., O'Reilly, M. W., Hughes, B. A., de Vries, M. C., Kant, S. G., Santen, G. W. E., et al. (2015) · The Journal of Clinical Endocrinology & Metabolism · doi:10.1210/jc.2014-3556 · Cited by 81
Self-citationAndrogen Effects on Adipose Tissue Architecture and Function in Nonhuman Primates
Varlamov, O., White, A. E., Carroll, J. M., Bethea, C. L., Reddy, A. P., Slayden, O. D., O’Rourke, R. W., & Roberts, C. T. (2012) · Endocrinology · doi:10.1210/en.2011-2111 · Cited by 74
Morán, C., Reyna, R., BOOTS, L., & Azziz, R. (2004) · Fertility and Sterility · doi:10.1016/j.fertnstert.2003.07.008 · Cited by 72
Wang, L., Li, S., Zhao, A., Tao, T., Mao, X., Zhang, P., & Liu, W. (2012) · The Journal of Steroid Biochemistry and Molecular Biology · doi:10.1016/j.jsbmb.2012.02.003 · Cited by 71
Decreased Cholesterol Efflux Capacity and Atherogenic Lipid Profile in Young Women With PCOS
Roe, A. H., Hillman, J., Butts, S. F., Smith, M. P., Rader, D. J., Playford, M. P., Mehta, N. N., & Dokras, A. (2014) · The Journal of Clinical Endocrinology & Metabolism · doi:10.1210/jc.2013-3918 · Cited by 71
Kim, M. S., Ryabets‐Lienhard, A., Dao-Tran, A., Mittelman, S. D., Gilsanz, V., Schrager, S. M., & Geffner, M. E. (2015) · The Journal of Clinical Endocrinology & Metabolism · doi:10.1210/jc.2014-4033 · Cited by 71
Dual-5α-Reductase Inhibition Promotes Hepatic Lipid Accumulation in Man
Hazlehurst, J., Oprescu, A. I., Nikolaou, N., Guida, R. D., Grinbergs, A., Davies, N. P., Flintham, R., Armstrong, M. J., TAYLOR, A. E. R., Hughes, B. A., et al. (2015) · The Journal of Clinical Endocrinology & Metabolism · doi:10.1210/jc.2015-2928 · Cited by 71
Self-citationAlexanderson, C., Eriksson, E., Stener-Victorin, E., Lystig, T., Gabrielsson, B., Lönn, M., & Holmäng, A. (2007) · Endocrinology · doi:10.1210/en.2007-0305 · Cited by 69
Du, X., Rosenfield, R. L., & Qin, K. (2009) · The Journal of Clinical Endocrinology & Metabolism · doi:10.1210/jc.2009-0139 · Cited by 67
Blouin, K., Blanchette, S., Richard, C., Dupont, P., Luu-The, V., & Tchernof, A. (2005) · American Journal of Physiology-Endocrinology and Metabolism · doi:10.1152/ajpendo.00312.2004 · Cited by 67
Chadwick, C., Owen, L. J., & Keevil, B. G. (2005) · Annals of Clinical Biochemistry International Journal of Laboratory Medicine · doi:10.1258/000456305774538175 · Cited by 36
Polycystic ovary syndrome: evidence for a primary disorder of ovarian steroidogenesis
Franks, S., Gharani, N., & Gilling‐Smith, C. (1999) · The Journal of Steroid Biochemistry and Molecular Biology · doi:10.1016/s0960-0760(99)00044-8 · Cited by 28
Ju, R., Wu, W., Fei, J., Qin, Y., Tang, Q., Wu, D., Xia, Y., Wu, J., & Wang, X. (2014) · European Journal of Endocrinology · doi:10.1530/eje-14-0615 · Cited by 27
Mansour, M. F., Pelletier, M., Boulet, M.-M., Mayrand, D., Brochu, G., Lebel, S., Poirier, D., Fradette, J., Cianflone, K., Luu-The, V., et al. (2015) · Molecular and Cellular Endocrinology · doi:10.1016/j.mce.2015.06.016 · Cited by 18
Cited by
Sorted by citations
Witchel, S. F., Oberfield, S. E., & Peña, A. S. (2019) · Journal of the Endocrine Society · doi:10.1210/js.2019-00078 · Cited by 653
Sanchez-Garrido, M. A., & Tena-Sempere, M. (2020) · Molecular Metabolism · doi:10.1016/j.molmet.2020.01.001 · Cited by 557
Stener-Victorin, E., Teede, H., Norman, R. J., Legro, R., Goodarzi, M. O., Dokras, A., Laven, J., Hoeger, K., & Piltonen, T. T. (2024) · Nature Reviews Disease Primers · doi:10.1038/s41572-024-00511-3 · Cited by 495
Schiffer, L., Barnard, L., Baranowski, E. S., Gilligan, L. C., Taylor, A. E., Arlt, W., Shackleton, C. H. L., & Storbeck, K.-H. (2019) · The Journal of Steroid Biochemistry and Molecular Biology · doi:10.1016/j.jsbmb.2019.105439 · Cited by 450
Self-citationZhao, H., Zhang, J., Cheng, X., Nie, X., & He, B. (2023) · Journal of Ovarian Research · doi:10.1186/s13048-022-01091-0 · Cited by 408
Metadata
- Authors
- O’Reilly, M. W., Kempegowda, P., Walsh, M., Taylor, A. E., Manolopoulos, K. N., Allwood, J. W., Semple, R. K., Hebenstreit, D., Dunn, W. B., Tomlinson, J. W., & Arlt, W.
- Affiliations
- University of Birmingham (GB)
- University of Warwick (GB)
- University of Cambridge (GB)
- Churchill Hospital (GB)
- NIHR Birmingham Liver Biomedical Research Unit (GB)
- Corresponding author
- Arlt, Wiebke
- ORCID
- Venue
- The Journal of Clinical Endocrinology & Metabolism
- Publisher
- The Endocrine Society
- Published
- 2017-06-22
- Volume
- 102
- Issue
- 9
- Pages
- 3327-3339
- ISSN
- 0021-972X (ISSN-L)
- 1945-7197
- PMC
- PMC5587066
- OpenAlex
- W2684997942
- Cited by
- 215
- References
- 48
- Citations by year
- 2026: 30 · 2025: 36 · 2024: 23 · 2023: 25 · 2022: 21 · 2021: 24 · 2020: 21 · 2019: 20 · 2018: 14 · 2017: 1
- FWCI
- 17.73
- Type
- journal article
- Language
- en
- Open access
- hybrid
- doi.org
- Licence
- cc-by
- Locations
- The Journal of Clinical Endocrinology & Metabolism (publishedVersion, cc-by)
- PubMed Central (publishedVersion, cc-by)
- PubMed (publishedVersion)
- Warwick Research Archive Portal (University of Warwick) (acceptedVersion)
- University of Birmingham Research Portal (University of Birmingham) (submittedVersion, cc-by)
- Edinburgh Research Explorer (University of Edinburgh) (submittedVersion, cc-by)
- Spiral (Imperial College London) (submittedVersion, cc-by)
- Apollo (University of Cambridge) (submittedVersion, cc-by)
- Apollo (cc-by)
- Funders
- Bayer
- Wellcome Trust (099909, 098498/Z/12/Z, 092283, WT098498)
- National Institute for Health and Care Research
- National Institutes of Health
- Directorate for Biological Sciences
- Medical Research Council (MR/M009157/1, MR/P011462/1)
- Biotechnology and Biological Sciences Research Council (BB/L006340/1)
- Topics
- Health Sciences › Medicine › Reproductive Medicine › Ovarian function and disorders
- Health Sciences › Medicine › Endocrinology, Diabetes and Metabolism › Adipokines, Inflammation, and Metabolic Diseases
- Life Sciences › Biochemistry, Genetics and Molecular Biology › Biochemistry › Lipid metabolism and biosynthesis
- Keywords
- polycystic ovary syndrome, AKR1C3, testosterone, dihydrotestosterone, lipotoxicity, insulin resistance, lipolysis, de novo lipogenesis, adipose tissue remodeling, serum metabolomics, insulin signaling
- MeSH terms
- Aldo-Keto Reductase Family 1 Member C3, Adolescent, Adult, Analysis of Variance, Androgens, Cells, Cultured, Dehydroepiandrosterone, Female, Humans, Hydroxyprostaglandin Dehydrogenases, Insulin Resistance, Lipolysis, Polycystic Ovary Syndrome, Reference Values, 3-Hydroxysteroid Dehydrogenases, Biomarkers, Case-Control Studies, Adipocytes, Statistics, Nonparametric, Area Under Curve, Subcutaneous Fat, Lipid Metabolism, Young Adult, Real-Time Polymerase Chain Reaction
About these checks
Registry, retraction, Cites and statistics results are computed, not judged, with one exception: a printed reference that no index lists is read once by a model before it counts as a citation error. Claims are extracted by a model and kept only when their quote appears verbatim in the text; each cited source is then checked, with a model’s help, for whether it says what the claim relies on. Those verdicts can be wrong — read the claim’s quote and the cited source before relying on one.
Statistics and arithmetic are recomputed, not judged.
Confidence bands are shown only for fields calibrated on our annotated test set. None is calibrated yet, so no band is shown.
What counts as a claim ›How we measure confidence ›How we check this ›
Are you an author, or do you see a problem with this page? Request a review
