

The DOI matches its Crossref record; 48 of the 48 references it cites were found in a registry or an index.
Association of Fecal and Plasma Levels of Short-Chain Fatty Acids With Gut Microbiota and Clinical Severity in Patients With Parkinson Disease
Open accessAbstract
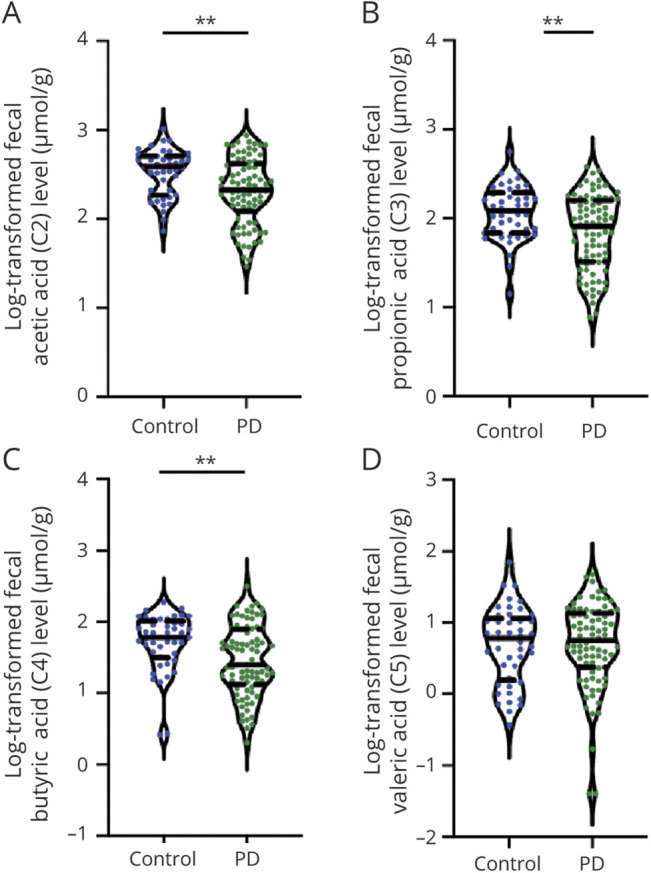
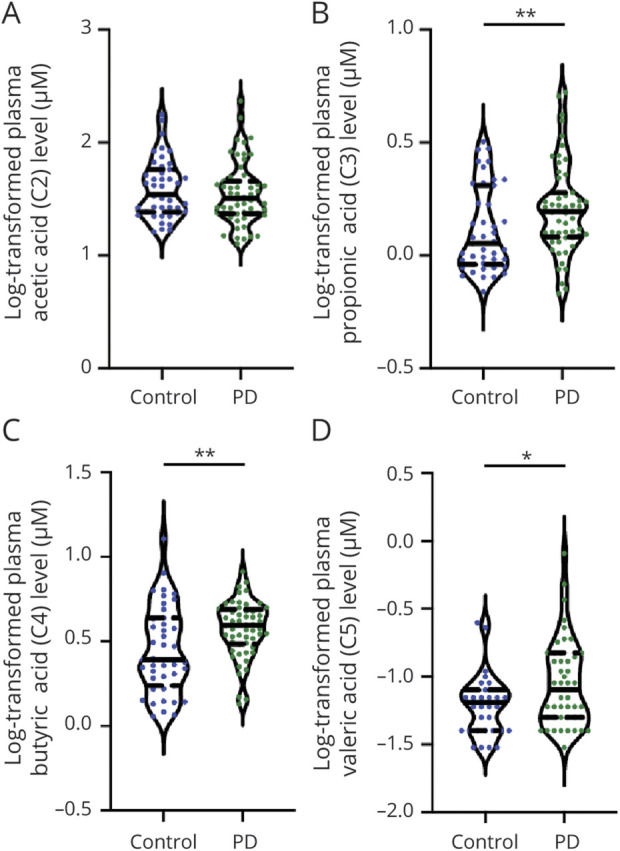
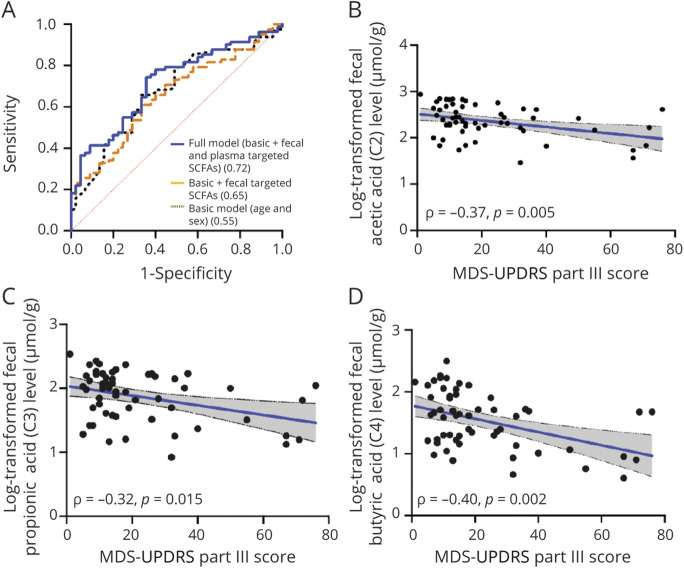
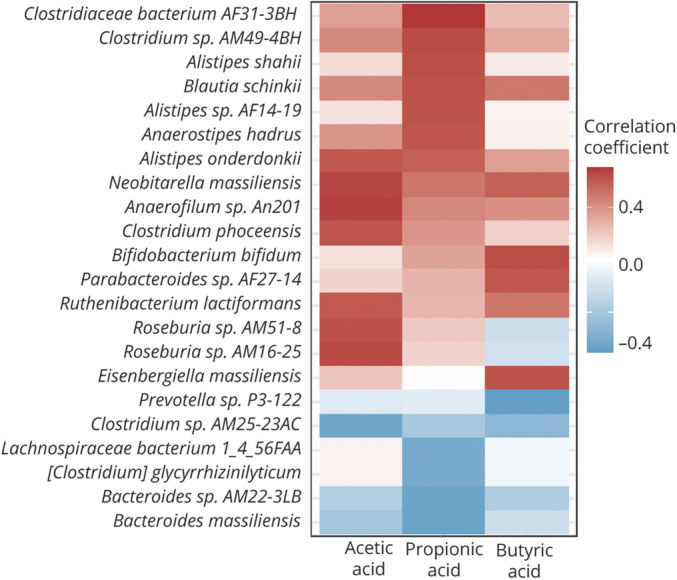
Background and Objectives Short-chain fatty acids (SCFAs) are gut microbial metabolites that promote the disease process in a rodent model of Parkinson disease (PD), but fecal levels of SCFAs in patients with PD are reduced. Simultaneous assessments of fecal and plasma SCFA levels, and their interrelationships with the PD disease process, are scarce. We aimed to compare fecal and plasma levels of different SCFA subtypes in patients with PD and healthy controls to delineate their interrelations and link to gut microbiota changes and clinical severity of PD. Methods A cohort of 96 patients with PD and 85 controls were recruited from National Taiwan University Hospital. Fecal and plasma concentrations of SCFAs were measured using chromatography and mass spectrometry. Gut microbiota was analyzed using metagenomic shotgun sequencing. Body mass index and medical comorbidities were evaluated and dietary information was obtained using a food frequency questionnaire. To assess motor and cognitive impairment, we used the Movement Disorder Society–Unified Parkinson9s Disease Rating Scale (MDS-UPDRS) and the Mini-Mental Status Examination (MMSE). Results Compared with controls, patients with PD had lower fecal but higher plasma concentrations of acetate, propionate, and butyrate. After adjustment for age, sex, disease duration, and anti-PD medication dosage, MDS-UPDRS part III motor scores correlated with reduced fecal levels of acetate (ρ = −0.37, p = 0.012), propionate (ρ = −0.32, p = 0.036), and butyrate (ρ = −0.40, p = 0.004) and with increased plasma propionate concentrations (ρ = 0.26, p = 0.042) in patients with PD. MMSE scores negatively correlated with plasma levels of butyrate (ρ = −0.09, p = 0.027) and valerate (ρ = −0.032, p = 0.033) after adjustment for confounders. SCFAs-producing gut bacteria correlated positively with fecal levels of SCFAs in healthy controls but revealed no association in patients with PD. In the PD patient group, the abundance of proinflammatory microbes, such as Clostridiales bacterium NK3B98 and Ruminococcus sp AM07-15, significantly correlated with decreased fecal levels and increased plasma levels of SCFAs, especially propionic acid. Discussion Reductions in fecal SCFAs but increased plasma SCFAs were observed in patients with PD and corelated to specific gut microbiota changes and the clinical severity of PD. Classification of Evidence This study provides Class III evidence that gut metabolite SCFAs distinguish between patients with PD and controls and are associated with disease severity in patients with PD.
Overview
The claims and statistics of this paper haven’t been checked yet.
Run the check — free, no account needed. It reads the open-access text and checks the sources it cites.
Integrity signals
Registry
Cites
Statistics
Figures
Verification
Claims the paper makes
The claims and statistics of this paper haven’t been checked yet.
Run the check — free, no account needed. It reads the open-access text and checks the sources it cites.
Claims other papers make about this one
Each is checked against this paper’s own text: does it say what the citing paper says it does?
In the citing paper
“These findings are in concordance with a substantial body of literature that consistently reports diminished SCFAs-producing species and SCFA levels in prodromal stage of PD and PD patients compared to healthy controls, which may be correlated with the clinical severity of PD.52,322–331”
From Microbiota–gut–brain axis and its therapeutic applications in neurodegenerative diseases (2024) · cites this paper as [329]
In the citing paper
“In plasma, Chen et al. report higher levels of acetate, propionate and butyrate in PD patients compared to controls, with plasma butyrate and valerate being inversely correlated with MMSE scores [62]”
From The Interplay between Gut Microbiota and Parkinson’s Disease: Implications on Diagnosis and Treatment (2022) · cites this paper as [62]
In the citing paper
“It has been shown that low levels of acetate, butyrate and above all propionate in feces from PD patients are linked to worse MDS-UPDRS part III scores [62,109], and the same is true for serum propionic acid [110]”
From The Interplay between Gut Microbiota and Parkinson’s Disease: Implications on Diagnosis and Treatment (2022) · cites this paper as [62]
In the citing paper
“lower levels of butyrate are linked to postural instability, gait disorders, Movement Disorder Society-Sponsored Revision of the Unified Parkinson’s Disease Rating Scale (MDS-UPDRS) part III motor scores and depression among PD patients showing a reduced count of Faecalibacterium [59,60,61,62,63]”
From The Interplay between Gut Microbiota and Parkinson’s Disease: Implications on Diagnosis and Treatment (2022) · cites this paper as [62]
Self-check
Percentages, sums and reported differences re-computed from the paper’s own numbers.
The self-check needs the paper’s full text.
Citations
Cites
Folstein, M. F., Folstein, S. E., & McHugh, P. R. (1975) · Journal of Psychiatric Research · doi:10.1016/0022-3956(75)90026-6 · Cited by 88,282
Parkinsonism: onset, progression, and mortality
Hoehn, M. M., & Yahr, M. D. (1967) · Neurology · doi:10.1212/wnl.17.5.427 · Cited by 12,107
Hughes, A. J., Daniel, S. E., Kilford, L., & Lees, A. J. (1992) · Journal of Neurology, Neurosurgery & Psychiatry · doi:10.1136/jnnp.55.3.181 · Cited by 10,378
Enterotypes of the human gut microbiome
MetaHIT Consortium (additional members), Arumugam, M., Raes, J., Pelletier, E., Le Paslier, D., Yamada, T., Mende, D. R., Fernandes, G. R., Tap, J., Bruls, T., et al. (2011) · Nature · doi:10.1038/nature09944 · Cited by 7,548
Goetz, C. G., Tilley, B. C., Shaftman, S. R., Stebbins, G. T., Fahn, S., Martinez‐Martin, P., Poewe, W., Sampaio, C., Stern, M. B., Dodel, R., et al. (2008) · Movement Disorders · doi:10.1002/mds.22340 · Cited by 7,536
From Dietary Fiber to Host Physiology: Short-Chain Fatty Acids as Key Bacterial Metabolites
Koh, A., De Vadder, F., Kovatcheva-Datchary, P., & Bäckhed, F. (2016) · Cell · doi:10.1016/j.cell.2016.05.041 · Cited by 7,070
Parada Venegas, D., De la Fuente, M. K., Landskron, G., González, M. J., Quera, R., Dijkstra, G., Harmsen, H. J. M., Faber, K. N., & Hermoso, M. A. (2019) · Frontiers in Immunology · doi:10.3389/fimmu.2019.00277 · Cited by 3,820
Gut microbiota regulate motor deficits and neuroinflammation in a model of Parkinson's disease
Sampson, T. R., Debelius, J. W., Thron, T., Janssen, S., Shastri, G. G., Ilhan, Z. E., Challis, C., Schretter, C. E., Rocha, S., Gradinaru, V., et al. (2016) · Cell · doi:10.1016/j.cell.2016.11.018 · Cited by 3,622
The role of short-chain fatty acids in microbiota–gut–brain communication
Dalile, B., Van Oudenhove, L., Vervliet, B., & Verbeke, K. (2019) · Nature Reviews Gastroenterology & Hepatology · doi:10.1038/s41575-019-0157-3 · Cited by 3,357
Short chain fatty acids in human large intestine, portal, hepatic and venous blood
Cummings, J. H., Pomare, E. W., Branch, W. J., Naylor, C. P., & Macfarlane, G. T. (1987) · Gut · doi:10.1136/gut.28.10.1221 · Cited by 3,119
Research works printed but not linked: 1
- Team RC. R: A Language and Environment for Statistical Computing. R Foundation for Statistical Computing; 2020.
Cited by
Sorted by citations
Microbiota–gut–brain axis and its therapeutic applications in neurodegenerative diseases
Loh, J. S., Mak, W. Q., Tan, L. K. S., Ng, C. X., Chan, H. H., Yeow, S. H., Foo, J. B., Ong, Y. S., How, C. W., & Khaw, K. Y. (2024) · Signal Transduction and Targeted Therapy · doi:10.1038/s41392-024-01743-1 · Cited by 1,193
The microbiome–gut–brain axis in Parkinson disease — from basic research to the clinic
Tan, A. H., Lim, S. Y., & Lang, A. E. (2022) · Nature Reviews Neurology · doi:10.1038/s41582-022-00681-2 · Cited by 392
Gut Microbiota: A Novel Therapeutic Target for Parkinson’s Disease
Zhu, M., Liu, X., Ye, Y., Yan, X., Cheng, Y., Zhao, L., Chen, F., & Ling, Z. (2022) · Frontiers in Immunology · doi:10.3389/fimmu.2022.937555 · Cited by 177
Varesi, A., Campagnoli, L. I. M., Fahmideh, F., Pierella, E., Romeo, M., Ricevuti, G., Nicoletta, M., Chirumbolo, S., & Pascale, A. (2022) · International Journal of Molecular Sciences · doi:10.3390/ijms232012289 · Cited by 88
A prebiotic diet modulates microglial states and motor deficits in α-synuclein overexpressing mice
Abdel-Haq, R., Schlachetzki, J. C., Boktor, J. C., Cantu-Jungles, T. M., Thron, T., Zhang, M., Bostick, J. W., Khazaei, T., Chilakala, S., Morais, L. H., et al. (2022) · eLife · doi:10.7554/elife.81453 · Cited by 82
Jiang, Z., Wang, X., Zhang, H., Yin, J., Zhao, P., Yin, Q., & Wang, Z. (2023) · MedComm · doi:10.1002/mco2.268 · Cited by 50
Early changes of fecal short‐chain fatty acid levels in patients with mild cognitive impairments
Gao, C., Li, B., He, Y., Huang, P., Du, J., He, G., Zhang, P., Tang, H., & Chen, S. (2023) · CNS Neuroscience & Therapeutics · doi:10.1111/cns.14252 · Cited by 50
Self-citationRegulation of microglial physiology by the microbiota
Cook, J., & Prinz, M. (2022) · Gut Microbes · doi:10.1080/19490976.2022.2125739 · Cited by 49
Qu, Y., An, K., Wang, D., Yu, H., Li, J., Min, Z., Xiong, Y., Xue, Z., & Mao, Z. (2025) · Molecular Neurobiology · doi:10.1007/s12035-025-04726-7 · Cited by 30
Gawlik-Kotelnicka, O., Sobczak, M., Palma, J., Popławska, M., Skonieczna-Żydecka, K., Plewka, M., Pawliczak, R., & Strzelecki, D. (2025) · Computational and Structural Biotechnology Journal · doi:10.1016/j.csbj.2025.05.035 · Cited by 4
Metadata
- Authors
- Chen, S.-J., Chen, C.-C., Liao, H.-Y., Lin, Y.-T., Wu, Y.-W., Liou, J.-M., Wu, M.-S., Kuo, C.-H., & Lin, C.-H.
- Affiliations
- National Taiwan University Hospital (TW)
- Corresponding author
- Lin, Ya-Ting
- Lin, Chin-Hsien
- Venue
- Neurology
- Published
- 2022-02-22
- Volume
- 98
- Issue
- 8
- Pages
- e848-e858
- ISSN
- 0028-3878 (ISSN-L)
- 1526-632X
- PMC
- PMC8883514
- OpenAlex
- W4206517428
- Cited by
- 269
- References
- 48
- Citations by year
- 2026: 50 · 2025: 82 · 2024: 59 · 2023: 41 · 2022: 37
- FWCI
- 17.88
- Type
- journal article
- Language
- en
- Open access
- hybrid
- doi.org
- Licence
- cc-by-nc-nd
- Locations
- Neurology (publishedVersion, cc-by-nc-nd)
- PubMed Central (publishedVersion, cc-by-nc-nd)
- PubMed (publishedVersion)
- Funders
- University of New South Wales
- National Health Research Institutes
- National Taiwan University Hospital
- National Taiwan University
- Topics
- Life Sciences › Biochemistry, Genetics and Molecular Biology › Molecular Biology › Gut microbiota and health
- Health Sciences › Medicine › Clinical Neurology › Parkinson's Disease Mechanisms and Treatments
- Health Sciences › Medicine › Gastroenterology › Gastrointestinal motility and disorders
- Keywords
- Parkinson's disease, short-chain fatty acids, gut microbiota, fecal SCFA, butyrate, propionate, acetate, valerate, motor impairment, cognitive impairment, Ruminococcus, SCFA-producing bacteria, gut-brain axis, disease severity markers, dietary fiber
- MeSH terms
- Gastrointestinal Microbiome, Fatty Acids, Volatile, Feces, Humans, Parkinson Disease, Cohort Studies
About these checks
Registry, retraction, Cites and statistics results are computed, not judged, with one exception: a printed reference that no index lists is read once by a model before it counts as a citation error. Claims are extracted by a model and kept only when their quote appears verbatim in the text; each cited source is then checked, with a model’s help, for whether it says what the claim relies on. Those verdicts can be wrong — read the claim’s quote and the cited source before relying on one.
Statistics and arithmetic are recomputed, not judged.
Confidence bands are shown only for fields calibrated on our annotated test set. None is calibrated yet, so no band is shown.
What counts as a claim ›How we measure confidence ›How we check this ›
Are you an author, or do you see a problem with this page? Request a review
