

Acute Vigorous Exercise Decreases Subsequent Nonexercise Physical Activity and Body Temperature Linked to Weight Gain
Open accessPublished version of a preprint
The DOI matches its Crossref record; 59 of the 60 references it cites were found in a registry or an index.
Abstract
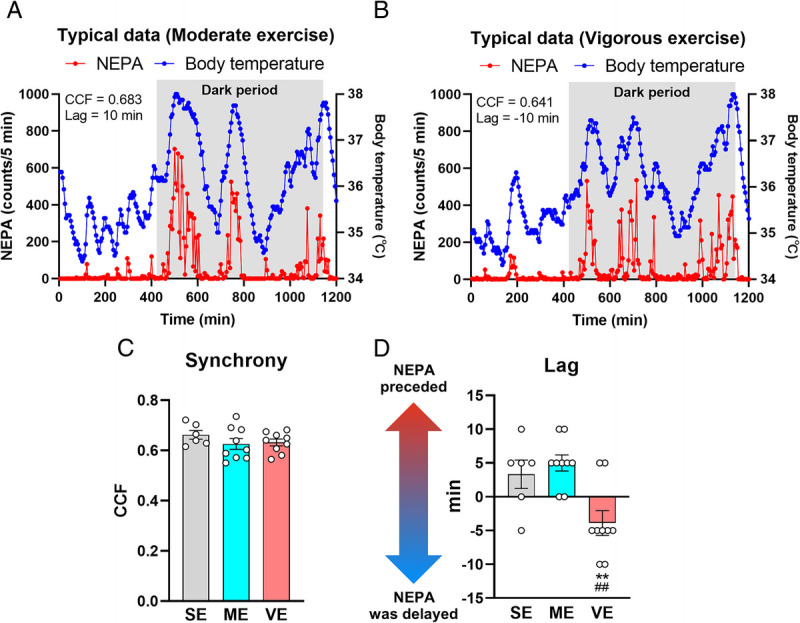
Purpose: Exercise benefits the body and mind, but its weight loss effect is less than generally expected. Although this phenomenon is likely due to an exercise intensity–dependent decrease in non-exercise physical activity (NEPA), resulting in a decrease in non-exercise activity thermogenesis, the underlying mechanisms and effects of exercise intensity remain unknown. Here we show that acute vigorous exercise decreases subsequent NEPA and body temperature (BT) in association with body weight gain. Methods: Adult male C57BL/6J mice were categorized into three groups: sedentary, moderate exercise, and vigorous exercise, with exercise groups undergoing a 30-min treadmill session. Using an intraperitoneally implanted activity monitor, NEPA and BT were monitored for 2 d before and 3 d after exercise. The daily synchrony between NEPA and BT was evaluated using a cross-correlation function. Plasma corticosterone was also detected 6 and 24 h after exercise. Results: Notably, only the vigorous exercise group exhibited a decline in both NEPA and BT, resulting in body weight gain the following day, despite no observed changes in food intake. Furthermore, vigorous exercise induces a distinct delay in the daily dynamics of NEPA compared with BT. A positive correlation was observed between plasma corticosterone levels and changes in NEPA levels before and after exercise across all exercise groups. Conclusions: Our findings provide evidence for vigorous exercise–specific reduction in subsequent NEPA, BT, and their synchrony linked to weight gain, likely due to the disturbed circadian rhythm of corticosterone. This is an initial investigation redefining the significance of exercise intensity in beneficial effects beyond the energy expenditure of the exercise itself.
Overview
The claims and statistics of this paper haven’t been checked yet.
Free: it reads the open-access text and checks the first 5 claims that cite a source we can check. Create a free account to check every claim.
Integrity signals
Registry
Cites
Statistics
Figures




Verification
Claims the paper makes
The claims and statistics of this paper haven’t been checked yet.
Free: it reads the open-access text and checks the first 5 claims that cite a source we can check. Create a free account to check every claim.
Claims other papers make about this one
Each is checked against this paper’s own text: does it say what the citing paper says it does?
The cited source doesn’t support the claim as written.
In the citing paper
“Acute exercise can cause reductions in overall energy intake that can cause weight gain”
From Lifestyle Medicine for Obesity in the Era of Highly Effective Anti-Obesity Treatment (2025) · cites this paper as [240]
Checked by a reasoning model — may be wrong.
Experimental — accuracy not yet measuredThe source backs part of the claim, not all of it — or backs it for a different population, condition or comparison.
In the citing paper
“NEAT can increase energy flux while not causing individuals to reduce their net energy expenditure as moderate to vigorous physical activity is known to”
From Lifestyle Medicine for Obesity in the Era of Highly Effective Anti-Obesity Treatment (2025) · cites this paper as [240]
Experimental — accuracy not yet measured
Self-check
Percentages, sums and reported differences re-computed from the paper’s own numbers.
The self-check needs the paper’s full text.
Citations
Cites
Walking and Dementia in Physically Capable Elderly Men
Abbott, R. D. (2004) · JAMA · doi:10.1001/jama.292.12.1447 · Cited by 743 · cited 2×
“Notably, low levels of NEPA are implicated in the deterioration of cognitive function and increased risk of dementia (9 – 11).”
BackgroundInterindividual variation in posture allocation: possible role in human obesity
Levine, J. A., Lanningham-Foster, L. M., McCrady, S. K., Krizan, A. C., Olson, L. R., Kane, P. H., Jensen, M. D., & Clark, M. M. (2005) · Science · doi:10.1126/science.1106561 · Cited by 705 · cited 2×
“xercise has been widely recommended as a pivotal strategy to improve physical and mental health (1 – 3).”
BackgroundThe aging clock: circadian rhythms and later life
Hood, S., & Amir, S. (2017) · Journal of Clinical Investigation · doi:10.1172/jci90328 · Cited by 605 · cited 1×
“To date, a lot of studies have examined the effects of several biological and environmental factors, including aging, exercise, and diet, on circadian rhythms of physical activity and body temperature (46 – 48).”
BackgroundJelleyman, C., Yates, T., O'Donovan, G., Gray, L. J., King, J. A., Khunti, K., & Davies, M. J. (2015) · Obesity Reviews · doi:10.1111/obr.12317 · Cited by 588 · cited 1×
“Despite the acknowledged efficacy of vigorous exercise in enhancing metabolic health (22), it sometimes fails to improve spatial learning and anxiety-like behaviors and increases the expression of mature brain-derived neurotrophic factor proteins in the hippocampus (23,24).”
BackgroundAtkinson, H. C., & Waddell, B. J. (1997) · Endocrinology · doi:10.1210/endo.138.9.5395 · Cited by 438 · cited 2×
“Plasma corticosterone commonly shows a higher value in the late light to early dark period, that is, before awakening (27).”
BackgroundKing, N. A., Hopkins, M., Caudwell, P., Stubbs, R. J., & Blundell, J. E. (2008) · International Journal of Obesity · doi:10.1038/sj.ijo.0803712 · Cited by 429 · cited 3×
“Compensatory responses to exercise have been well recognized to be exhibited as increased energy intake (7).”
BackgroundEffects of Exercise on Brain and Cognition Across Age Groups and Health States
Stillman, C. M., Esteban-Cornejo, I., Brown, B., Bender, C. M., & Erickson, K. I. (2020) · Trends in Neurosciences · doi:10.1016/j.tins.2020.04.010 · Cited by 423
Age-Related Decline in Circadian Output
Nakamura, T. J., Nakamura, W., Yamazaki, S., Kudo, T., Cutler, T., Colwell, C. S., & Block, G. D. (2011) · Journal of Neuroscience · doi:10.1523/jneurosci.0451-11.2011 · Cited by 386 · cited 1×
“For example, aging decreases the amplitude of the rhythm of voluntary physical activity and is linked to the phase advancement of the rhythms of body temperature, cortisol, and melatonin (43 – 45).”
BackgroundConstrained Total Energy Expenditure and Metabolic Adaptation to Physical Activity in Adult Humans
Pontzer, H., Durazo-Arvizu, R., Dugas, L. R., Plange-Rhule, J., Bovet, P., Forrester, T. E., Lambert, E. V., Cooper, R. S., Schoeller, D. A., & Luke, A. (2016) · Current Biology · doi:10.1016/j.cub.2015.12.046 · Cited by 326 · cited 1×
“Pontzer et al. (39) demonstrated that increasing physical activity does not simply add total energy expenditure in a dose – response manner.”
BackgroundTime of exercise specifies the impact on muscle metabolic pathways and systemic energy homeostasis
Sato, S., Basse, A. L., Schönke, M., Chen, S., Samad, M., Altıntaş, A., Laker, R. C., Dalbram, E., Barrès, R., Baldi, P., et al. (2019) · Cell Metabolism · doi:10.1016/j.cmet.2019.03.013 · Cited by 298 · cited 1×
“The effect of exercise is known to depend on the timing of exercise (58,59).”
Background
Cited by
Lifestyle Medicine for Obesity in the Era of Highly Effective Anti-Obesity Treatment
Sannidhi, D., Abeles, R., Andrew, W., Bonnet, J. P., Vitale, K., Niranjan, V., Gulati, M., Pauly, K., Moran, R., Alexander, L., et al. (2025) · Nutrients · doi:10.3390/nu17142382 · Cited by 29
“…can cause reductions in overall energy intake that can cause weight gain, so prescriptions for physical activity should be provided with a concurrent recommendation to continue to keep overall activity constant with attention to step counts and increasing non-exercise activity thermogenesis [240].”
Cho, Y. W., Chow, S., Li, J., Wang, W., Wang, S. D., Ji, L., Chinchilli, V. M., Intille, S. S., & Dunton, G. F. (2025) · JMIR mhealth and uhealth · doi:10.2196/65350 · Cited by 7
“While the PA process exhibited an AR pattern in the overall sample, excessive PA on one day can reduce the next day’s PA [46].”
Shinkai, H., Shirai, T., Uemichi, K., Iwai, R., Iwata, T., Tanimura, R., Sugiyama, S., & Takemasa, T. (2025) · Physiological Reports · doi:10.14814/phy2.70542 · Cited by 1
“Such high-intensity exercise may also result in a different energy expenditure/intake balance and resting behavior (Funabashi et al., 2024).”
IF1 Protein Controls Aging RatePreprint
Forrest, M. (2021) · bioRxiv (Cold Spring Harbor Laboratory) · doi:10.1101/2021.10.28.466310 · Cited by 1
Effects of a dynamically adjusted exercise prescription in adults with overweight and obesity
Zhang, Z. K., Peng, W., Zhang, F. W., Lu, P. X., Huang, L., & Sun, S. M. (2026) · Science & Sports · doi:10.1016/j.scispo.2026.02.003
Metadata
- Authors
- FUNABASHI, D., DOBASHI, S., SAMESHIMA, K., SAGAYAMA, H., NISHIJIMA, T., & MATSUI, T.
- Affiliations
- University of Tsukuba (JP)
- Tokyo Metropolitan University (JP)
- Corresponding author
- MATSUI, TAKASHI
- Venue
- Medicine & Science in Sports & Exercise
- Published
- 2024-06-06
- Volume
- 56
- Issue
- 10
- Pages
- 1964-1975
- ISSN
- 0195-9131 (ISSN-L)
- 1530-0315
- PMC
- PMC11419279
- OpenAlex
- W4397002221
- Cited by
- 4
- References
- 60
- Citations by year
- 2026: 1 · 2025: 2
- FWCI
- 0.85
- Type
- journal article
- Language
- en
- Open access
- hybrid
- doi.org
- Licence
- Locations
- Medicine & Science in Sports & Exercise (publishedVersion, cc-by-nc-nd)
- bioRxiv (Cold Spring Harbor Laboratory) (acceptedVersion)
- PubMed Central (publishedVersion, cc-by-nc-nd)
- PubMed (publishedVersion)
- Institutional Repositories DataBase (IRDB) (acceptedVersion)
- Funders
- Japan Society for the Promotion of Science (23K24735, 22K21199, 22K11528, 24K20595, 20K20619)
- Japan Science and Technology Agency
- Topics
- Health Sciences › Medicine › Public Health, Environmental and Occupational Health › Physical Activity and Health
- Life Sciences › Neuroscience › Endocrine and Autonomic Systems › Regulation of Appetite and Obesity
- Life Sciences › Neuroscience › Endocrine and Autonomic Systems › Circadian rhythm and melatonin
- Keywords
- non-exercise physical activity, non-exercise activity thermogenesis, body temperature, weight gain, corticosterone, circadian rhythm, exercise intensity, energy expenditure, treadmill exercise
- MeSH terms
- Animals, Body Temperature, Corticosterone, Male, Mice, Inbred C57BL, Physical Conditioning, Animal, Weight Gain, Thermogenesis, Mice
About these checks
Registry, retraction, Cites and statistics results are computed, not judged, with one exception: a printed reference that no index lists is read once by a model before it counts as a citation error. Claims are extracted by a model and kept only when their quote appears verbatim in the text; each cited source is then checked, with a model’s help, for whether it says what the claim relies on. Those verdicts can be wrong — read the claim’s quote and the cited source before relying on one.
Statistics and arithmetic are recomputed, not judged.
Confidence bands are shown only for fields calibrated on our annotated test set. None is calibrated yet, so no band is shown.
What counts as a claim ›How we measure confidence ›How we check this ›
Are you an author, or do you see a problem with this page? Request a review
How to cite
Cite CoChat for the checks on this page, and the paper for its own findings.
- This page
- CoChat. (2026). Citation check: Acute Vigorous Exercise Decreases Subsequent Nonexercise Physical Activity and Body Temperature Linked to Weight Gain. https://app.cochat.ai/papers/10.1249/mss.0000000000003487
- The paper
- FUNABASHI, D., DOBASHI, S., SAMESHIMA, K., SAGAYAMA, H., NISHIJIMA, T., & MATSUI, T. (2024). Acute Vigorous Exercise Decreases Subsequent Nonexercise Physical Activity and Body Temperature Linked to Weight Gain. Medicine & Science in Sports & Exercise. https://doi.org/10.1249/mss.0000000000003487
Data sources
Bibliographic data: Semantic Scholar, OpenAlex, Crossref.
Contains information from the Semantic Scholar Academic Graph Datasets, made available under the ODC Attribution License (ODC-BY 1.0).
Semantic Scholar’s data is described in: Kinney, R., et al. (2023). The Semantic Scholar Open Data Platform. arXiv:2301.10140.
